Managing a gig workforce? Whether it’s freelancers, delivery agents, ride-share drivers, or remote specialists—data is your most powerful tool. And when it comes to monitoring performance, hitting targets, and making informed decisions, the Gig Economy KPI Dashboard in Power BI is the ultimate solution. 💼📊
This dynamic dashboard is designed specifically for gig economy managers and operations leaders. Built on Power BI and fueled by Excel, it lets you visualize trends, monitor KPIs in real-time, and track performance without writing a single line of code.
If you’re ready to move from scattered spreadsheets to a centralized, smart dashboard—this is your answer.
✨ Key Features of Gig Economy KPI Dashboard
📍 Interactive Filters – Slice data by month or KPI group to view performance in any dimension
📍 Summary Cards – Instantly see total KPIs, how many hit their target, and which ones didn’t
📍 Target vs Actual Visuals – Clear green ▲ or red ▼ indicators based on performance
📍 Auto-calculated Metrics – Compare current year MTD/YTD with targets and previous years
📍 Drill-Through Capability – Right-click any KPI to view its full definition and formula
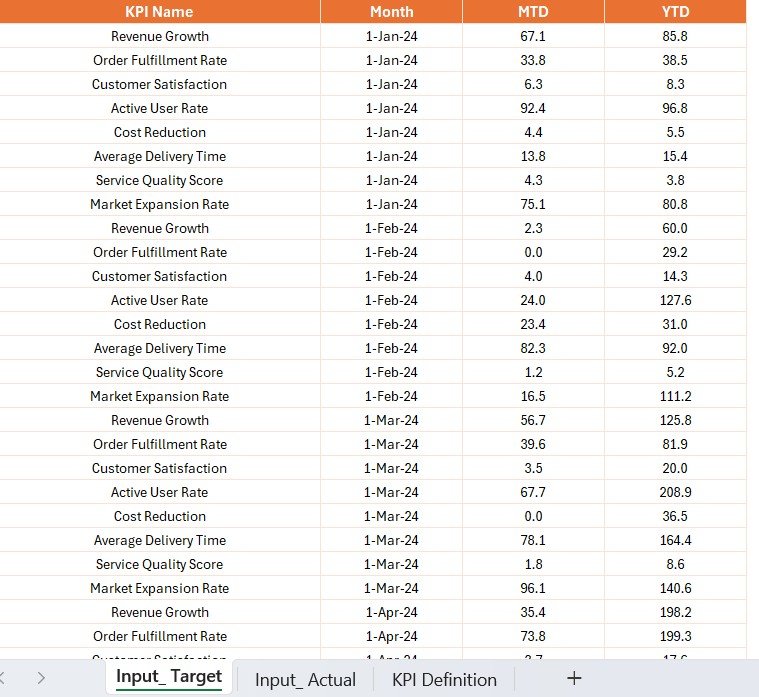
📍 Fully Excel-Driven – Update your KPIs with a few clicks—no database needed
📍 Simple Setup – Just update Excel files, refresh Power BI, and go!
📍 No Coding Required – Perfect for managers, not just data analysts
📂 What’s Inside the Gig Economy KPI Dashboard
This Power BI tool comes with three intelligent dashboard pages, each built for insight and simplicity:
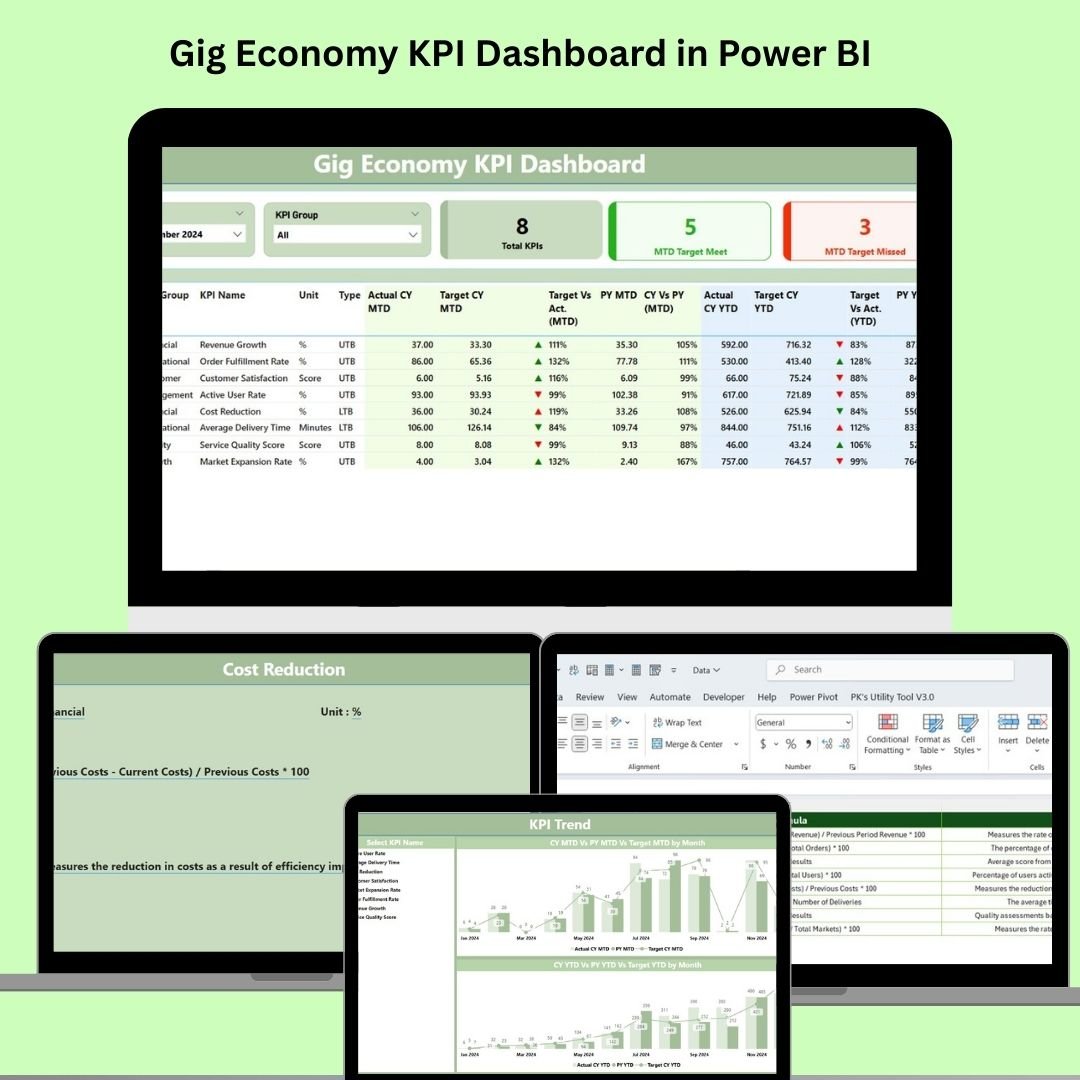
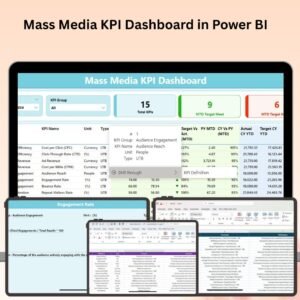
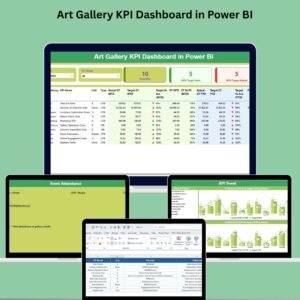
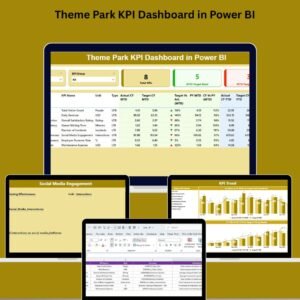
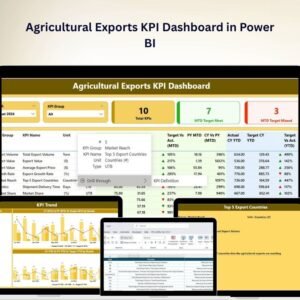
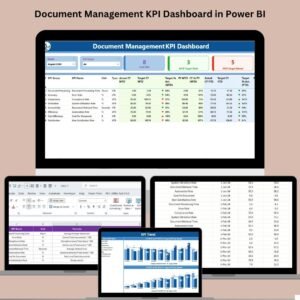
1️⃣ Summary Page – All KPIs in One Place
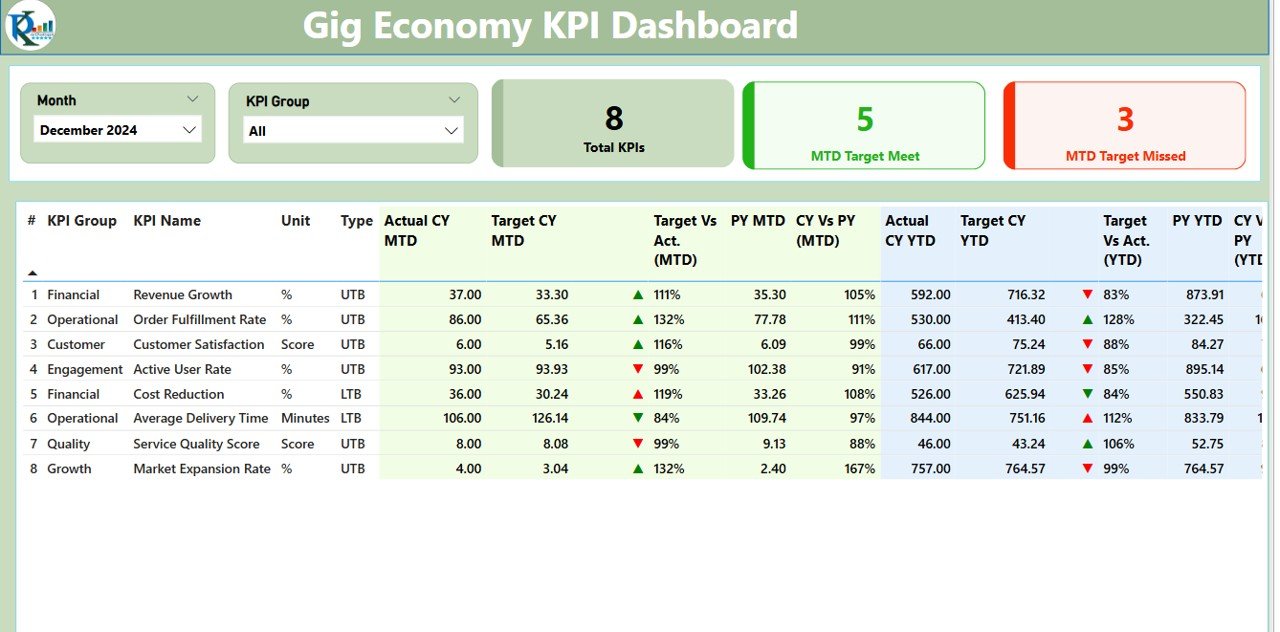
Your KPI command center. Apply filters and monitor MTD/YTD progress, goal achievement, and visual status icons at a glance. Includes:
-
KPI name, group, unit, and formula
-
Actual vs Target vs Previous Year
-
Icon-based performance indicators
-
CY MTD and CY YTD summaries
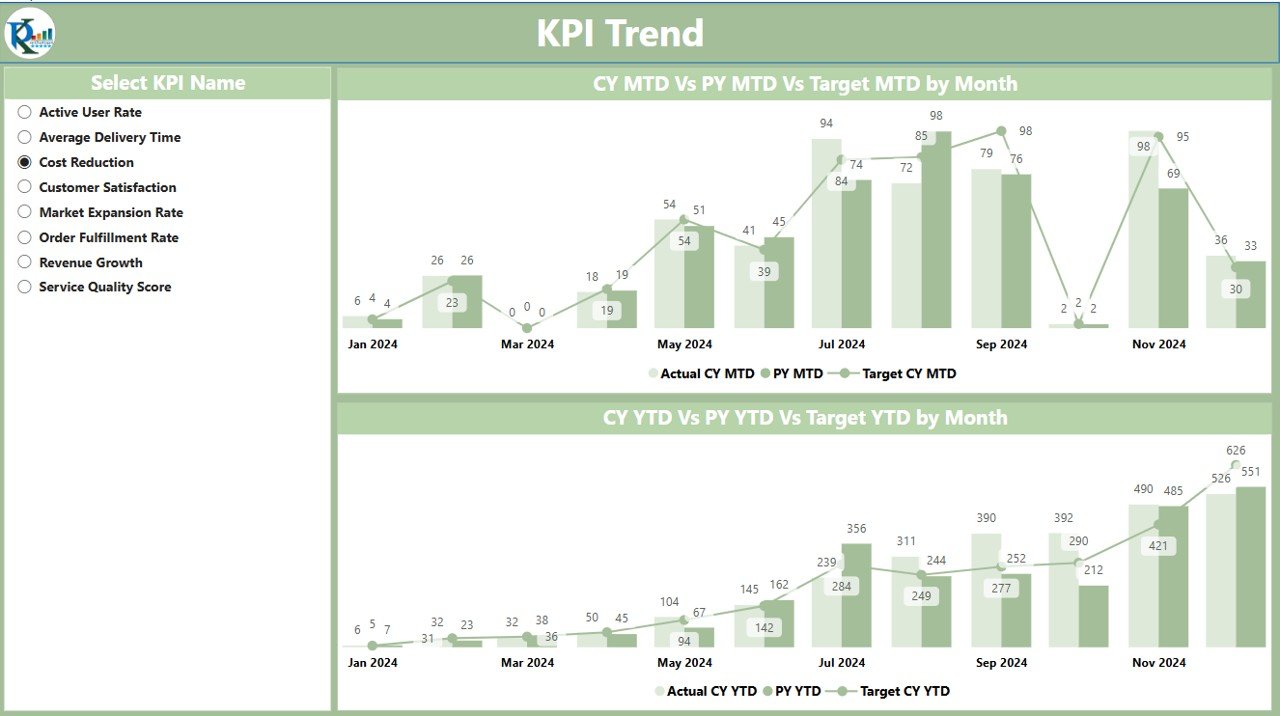
2️⃣ KPI Trend Page – Discover Patterns Over Time
Don’t just track numbers—see the why behind them. This page provides:
-
Monthly trend charts for each KPI
-
Year-to-date comparison visuals
-
Combo charts showing actuals vs targets
-
Drill-down by metric using slicers
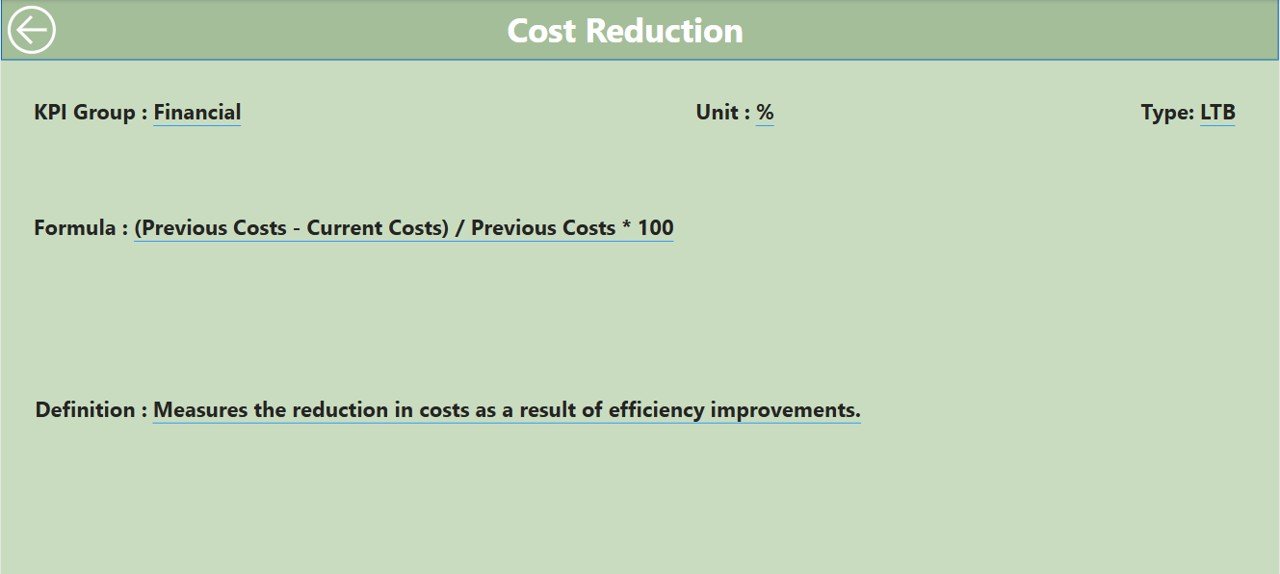
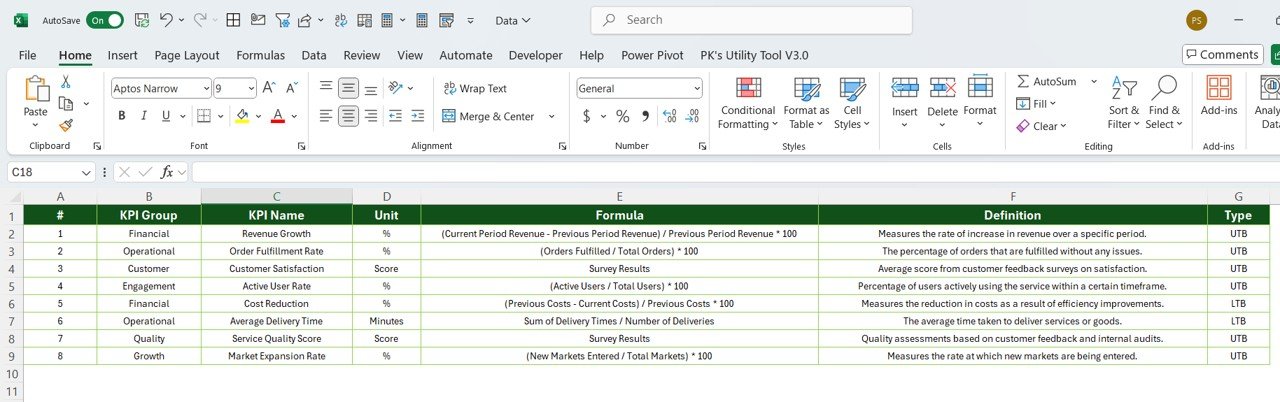
3️⃣ KPI Definition Page – Clarity at Your Fingertips
Want to know exactly what you’re measuring? This hidden page gives you:
-
KPI name, group, and unit
-
Full formula
-
Definition and whether it’s UTB or LTB
-
Accessed via right-click > Drill Through
🧾 How to Use the Gig Economy KPI Dashboard
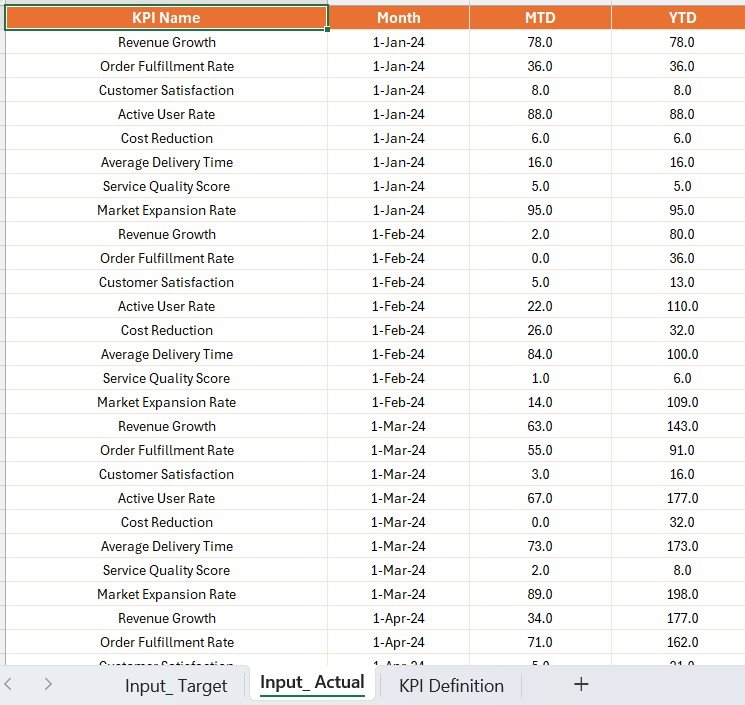
💡 Step 1: Open the provided Excel file and enter your KPI Actuals and Targets
💡 Step 2: Add or update KPI definitions as needed
💡 Step 3: Refresh the Power BI dashboard
💡 Step 4: Use filters to slice your data
💡 Step 5: Click any KPI to see definitions and historical performance
It’s that simple—no setup headaches or complex formulas to manage.
👩💼 Who Can Benefit from This Product?
This dashboard is ideal for:
🚴♂️ Gig Economy Platform Managers – Track rider, driver, or freelancer metrics
🛍️ Delivery Ops Teams – Monitor service levels, delivery times, and performance
🧑💻 HR/People Teams – Track onboarding, churn, and retention KPIs
🌐 Remote-First Organizations – Keep tabs on distributed workforce KPIs
🧩 Freelancer Platforms – Analyze satisfaction, task completion, and availability
If your team includes contractors or part-timers—you need this tool.
🔗 Click here to read the Detailed blog post
🎥 Visit our YouTube channel to learn step-by-step video tutorials


Reviews
There are no reviews yet.