

The Fishing Industry KPI Dashboard in Google Sheets is a game-changing solution for modern fisheries, vessel operators, and marine management teams 🌊. In today’s competitive seafood market, success depends on precise performance tracking — from catch efficiency to sustainability compliance. This dynamic, ready-to-use Google Sheets dashboard gives you the power to monitor, measure, and optimize every aspect of your fishing operations — all in one place.
Say goodbye to multiple spreadsheets and manual reports. This all-in-one dashboard helps you visualize progress, compare targets vs. actuals, and uncover trends across months, years, and fleets. Whether you’re managing a small local fishery or a large-scale commercial operation, this tool helps you make data-driven, sustainable, and profitable decisions.Fishing Industry KPI Dashboard in Google Sheets
⚙️ Key Features of the Fishing Industry KPI Dashboard in Google Sheets
🐟 Dynamic Dashboard Interface – View real-time MTD (Month-to-Date) and YTD (Year-to-Date) performance. Instantly switch months using a dropdown in cell D3 for live data updates.
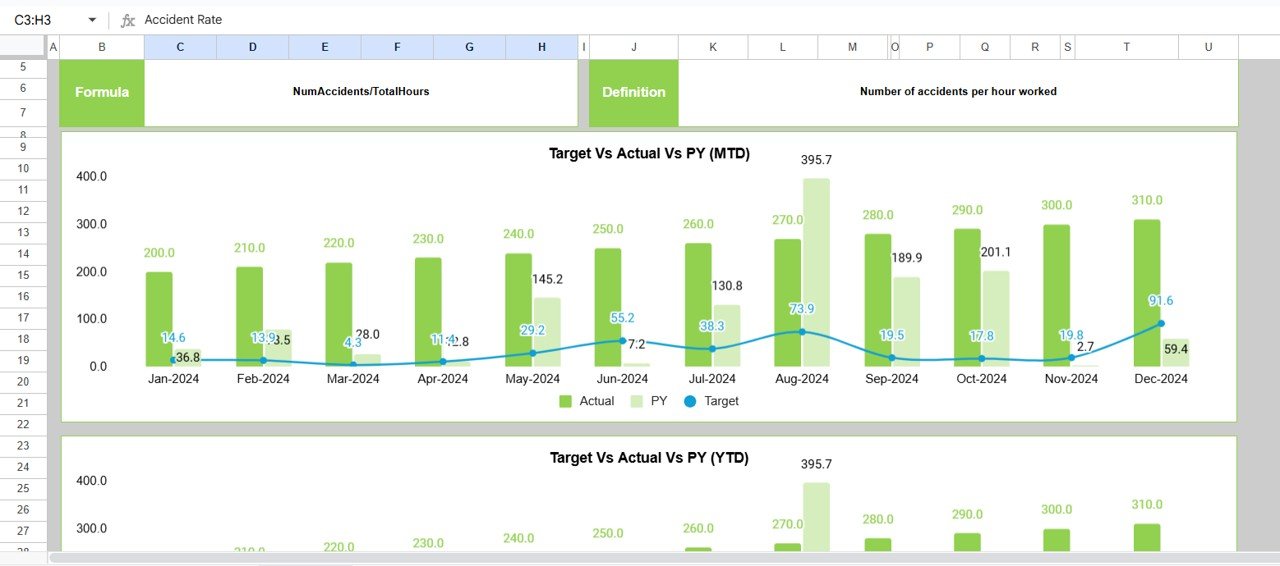
📈 KPI Trend Visualization – Track long-term trends with interactive charts showing Actual vs. Target and Previous Year performance.
💡 Smart Conditional Formatting – Instantly spot performance shifts with green (↑) and red (↓) arrows — no manual analysis required.
📊 Separate Data Tabs – Organized sheets for Actuals, Targets, and Previous Year numbers keep your data clean and structured.
🌍 Cloud-Based Collaboration – Built in Google Sheets, it’s shareable, editable, and viewable anywhere — no installation needed.
🧭 Sustainability Metrics – Track bycatch rates, fuel efficiency, and compliance to promote eco-friendly fishing practices.
⚡ Automation-Ready – Use Google Apps Script or IMPORTRANGE to connect live data feeds from tracking or accounting systems.

📂 What’s Inside the Fishing Industry KPI Dashboard
The dashboard template includes six interactive worksheet tabs, each tailored to deliver insights at different levels:
1️⃣ Home Sheet – Quick navigation buttons to jump between key sections.
2️⃣ Dashboard Sheet – Main summary page showing cards for MTD/YTD KPIs with trend indicators.
3️⃣ Trend Sheet – Drop-down-based analysis for any selected KPI with clear charts.
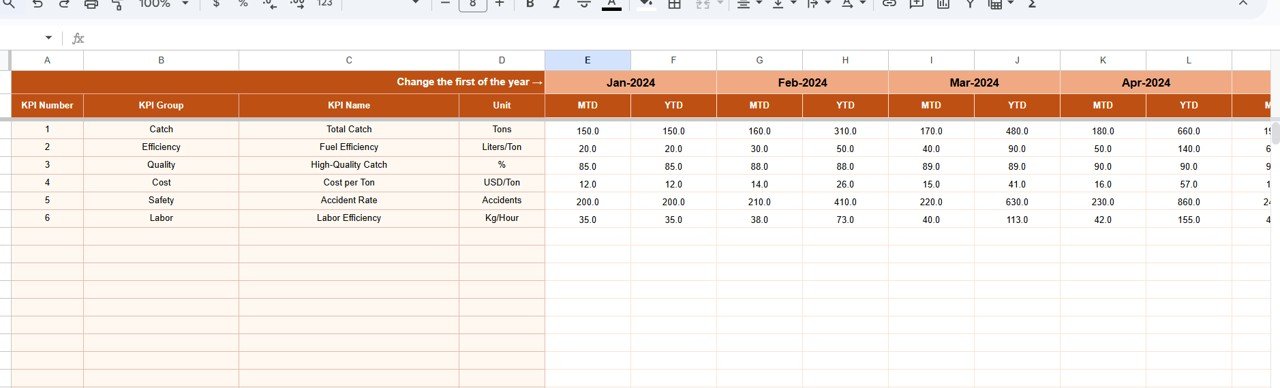
4️⃣ Actual Numbers Input Sheet – Input your operational data; auto-updates dashboard visuals.
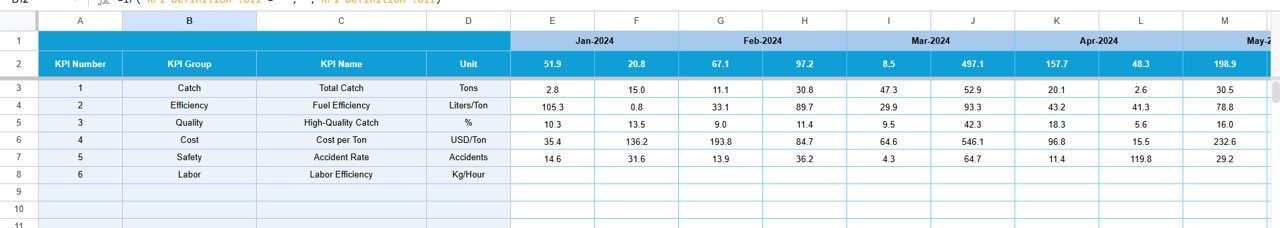
5️⃣ Target Sheet – Define MTD/YTD targets to measure against.Fishing Industry KPI Dashboard in Google Sheets
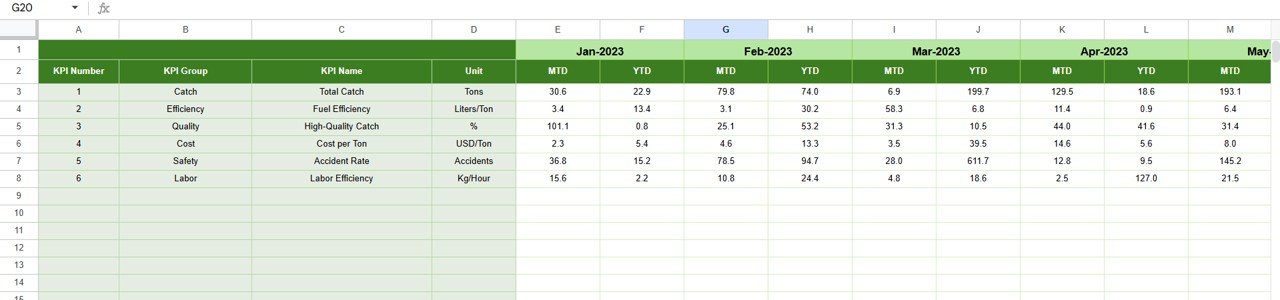
6️⃣ Previous Year Sheet – Keep historical data for year-over-year comparison.
7️⃣ KPI Definition Sheet – Comprehensive reference for all KPIs (unit, formula, and definition).
Everything is pre-formatted with intuitive color coding and responsive charts — ready to use immediately after data entry.
🧭 How to Use the Fishing Industry KPI Dashboard
1️⃣ Enter Data: Add monthly figures for each KPI in the Actual Numbers sheet.
2️⃣ Set Targets: Fill in target values for MTD & YTD columns in the Target sheet.
3️⃣ Load Previous Year Data: Enter last year’s numbers for benchmarking.
4️⃣ Select Month: Choose any month from the dropdown in D3 on the Dashboard.
5️⃣ Analyze Trends: Use the Trend tab to visualize KPI patterns.
6️⃣ Collaborate: Share the Google Sheet with your crew, managers, or stakeholders for live updates.
7️⃣ Automate: Optionally integrate with Google Forms or Apps Script for automatic data refresh.
With just a few clicks, you’ll transform raw fishing data into clear, actionable visuals that guide smarter decisions.
👥 Who Can Benefit from This Dashboard
🧑✈️ Fleet Owners & Managers – Monitor vessel performance, trip costs, and profit margins.
🌊 Sustainability Officers – Track bycatch, emissions, and eco-compliance KPIs.
💼 Business Analysts – Evaluate revenue trends and cost efficiency.
🏢 Government & Regulators – Ensure sustainable practices with data transparency.
🎣 Small Fishing Businesses – Simplify daily reporting without expensive software.
📊 Investors & Stakeholders – Get quick insights into operational performance and growth potential.


Reviews
There are no reviews yet.