Employee satisfaction is directly tied to productivity, retention, and company culture. Without a structured way to measure engagement, HR teams often miss early warning signs of disengagement or overlook improvement opportunities. That’s why we created the Employee Satisfaction Dashboard in Google Sheets — a ready-to-use solution that transforms survey data into actionable insights. 📊👥
This dashboard consolidates employee feedback into clear visualizations and KPIs, allowing HR managers and business leaders to identify strengths, track trends, and focus on areas that need attention. It’s simple, collaborative, and highly customizable, making it the perfect fit for organizations of all sizes.
🔑 Key Features of Employee Satisfaction Dashboard in Google Sheets
📋 Dashboard Sheet (Main Overview)
-
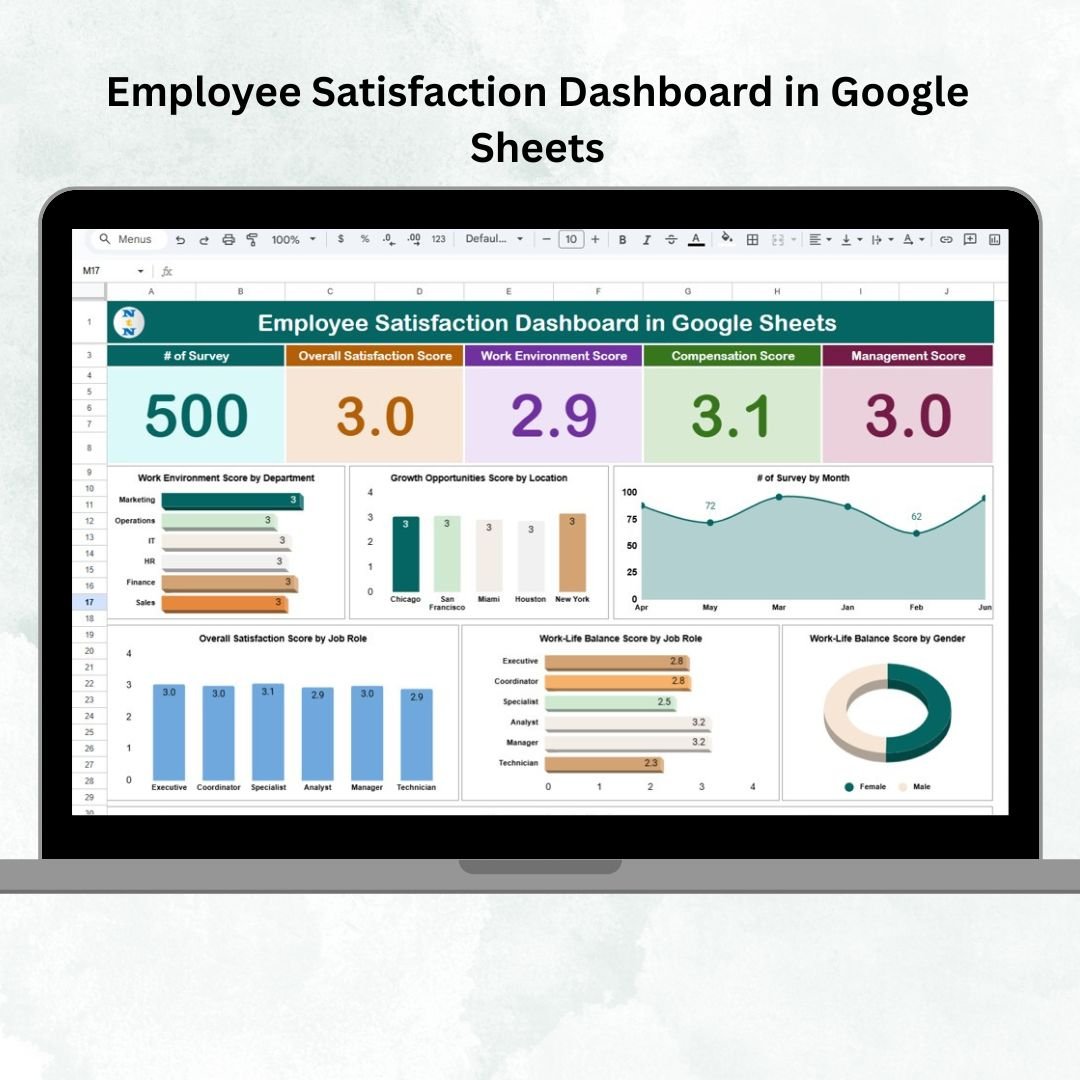
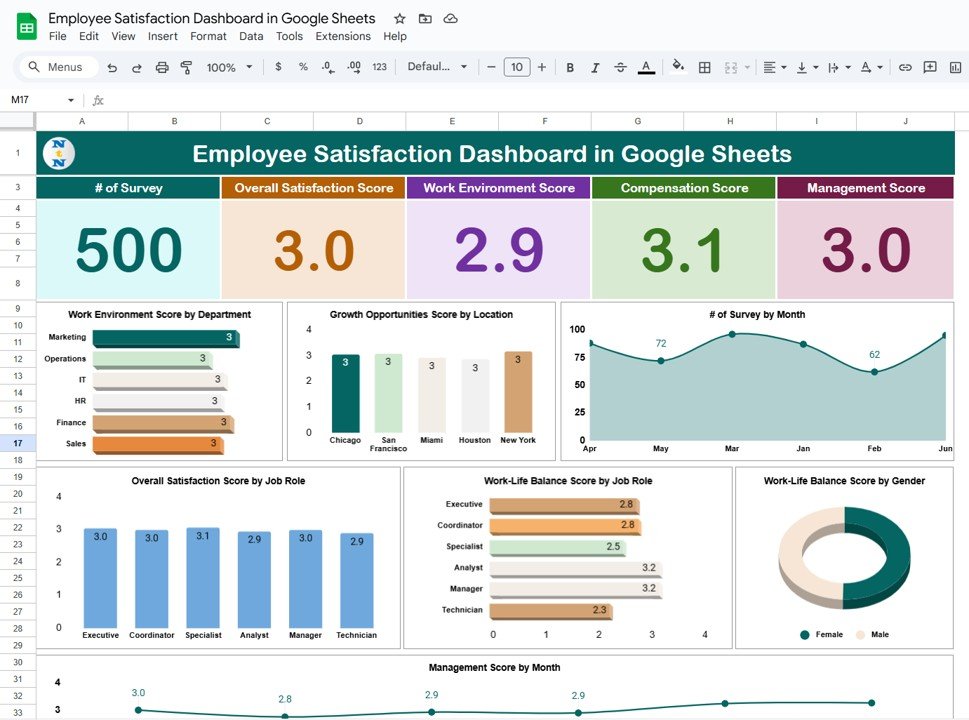
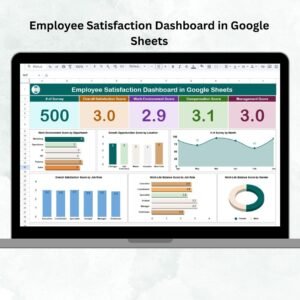
KPI cards for # of Surveys, Overall Satisfaction, Work Environment, Compensation, Management Effectiveness.
-
Charts for:
-
Work Environment Score by Department
-
Growth Opportunities Score by Location
-
Surveys by Month (trend of participation)
-
Satisfaction by Job Role
-
Work-Life Balance by Job Role & Gender
-
Management Score by Month
-
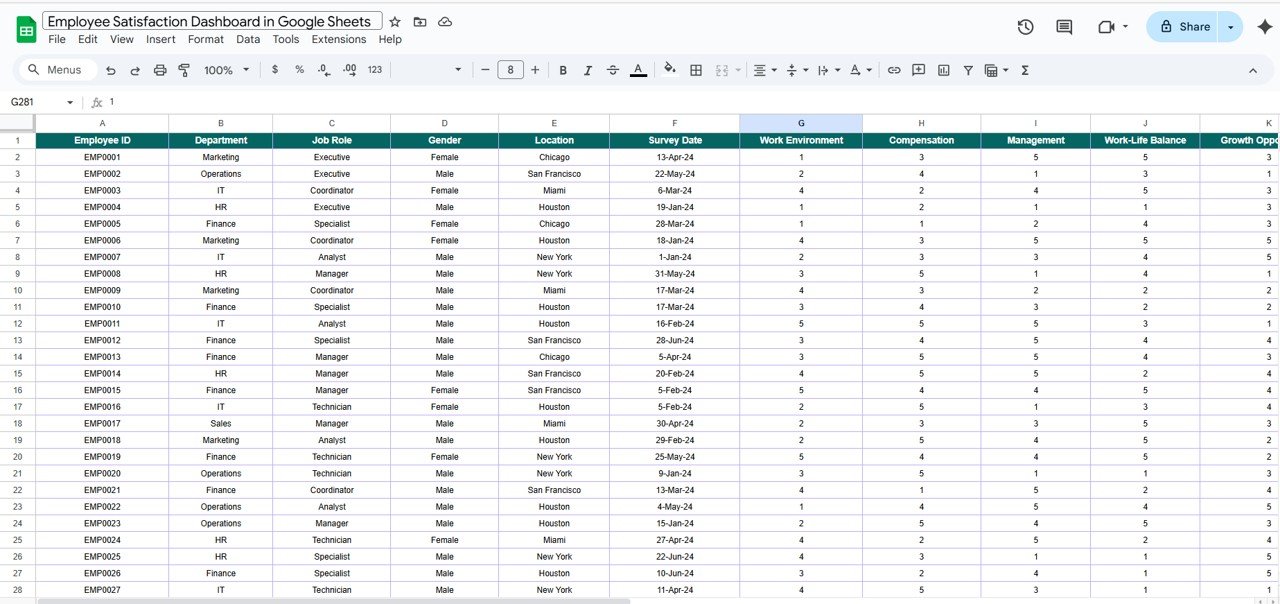
📑 Data Sheet (Survey Input)
-
Record scores for Satisfaction, Work Environment, Compensation, Management, Work-Life Balance, Growth Opportunities.
-
Segment by Department, Job Role, Location, and Gender.
-
Updates on this sheet automatically refresh the dashboard in real time.
📦 What’s Inside the Dashboard?
✅ Dashboard Tab – Visual overview with KPIs and charts
✅ Data Entry Tab – Centralized sheet for survey responses
✅ Pre-Built Formulas – Automated calculations for scores and percentages
✅ Interactive Visuals – Gender, role, and department breakdowns
✅ Customizable Layout – Add or modify KPIs to match your needs
✅ Pre-Loaded Sample Data – See how it works instantly
🎯 Who Can Benefit from This Dashboard?
👨💼 HR Teams – Track employee engagement and take proactive steps.
🏢 Managers & Executives – Measure the impact of policies and leadership effectiveness.
👥 Small & Large Companies – Adaptable for any workforce size.
📊 People Analytics Teams – Turn survey data into strategic insights.
🧠 How to Use the Employee Satisfaction Dashboard
-
Collect employee survey results.
-
Enter scores into the Data Sheet Tab.
-
Review KPIs and charts on the Dashboard Tab.
-
Segment insights by department, role, location, or gender.
-
Share results with leadership and employees to drive engagement initiatives.
It’s as easy as inputting your data — the dashboard does the rest! ✅
🚀 Advantages of Using This Dashboard
-
Centralized Tracking – Keep all survey metrics in one place.
-
Real-Time Updates – Instant dashboard refresh when new data is added.
-
Data Transparency – Share clear insights across the organization.
-
Gap Identification – Spot low-scoring departments, roles, or demographics.
-
Improved Retention – Take corrective actions before disengagement leads to turnover.
-
Customizable – Add KPIs like Diversity, Training, or Career Growth.
🔗 Click here to read the Detailed blog post
🔗 Visit our YouTube channel to learn step-by-step video tutorials


Reviews
There are no reviews yet.