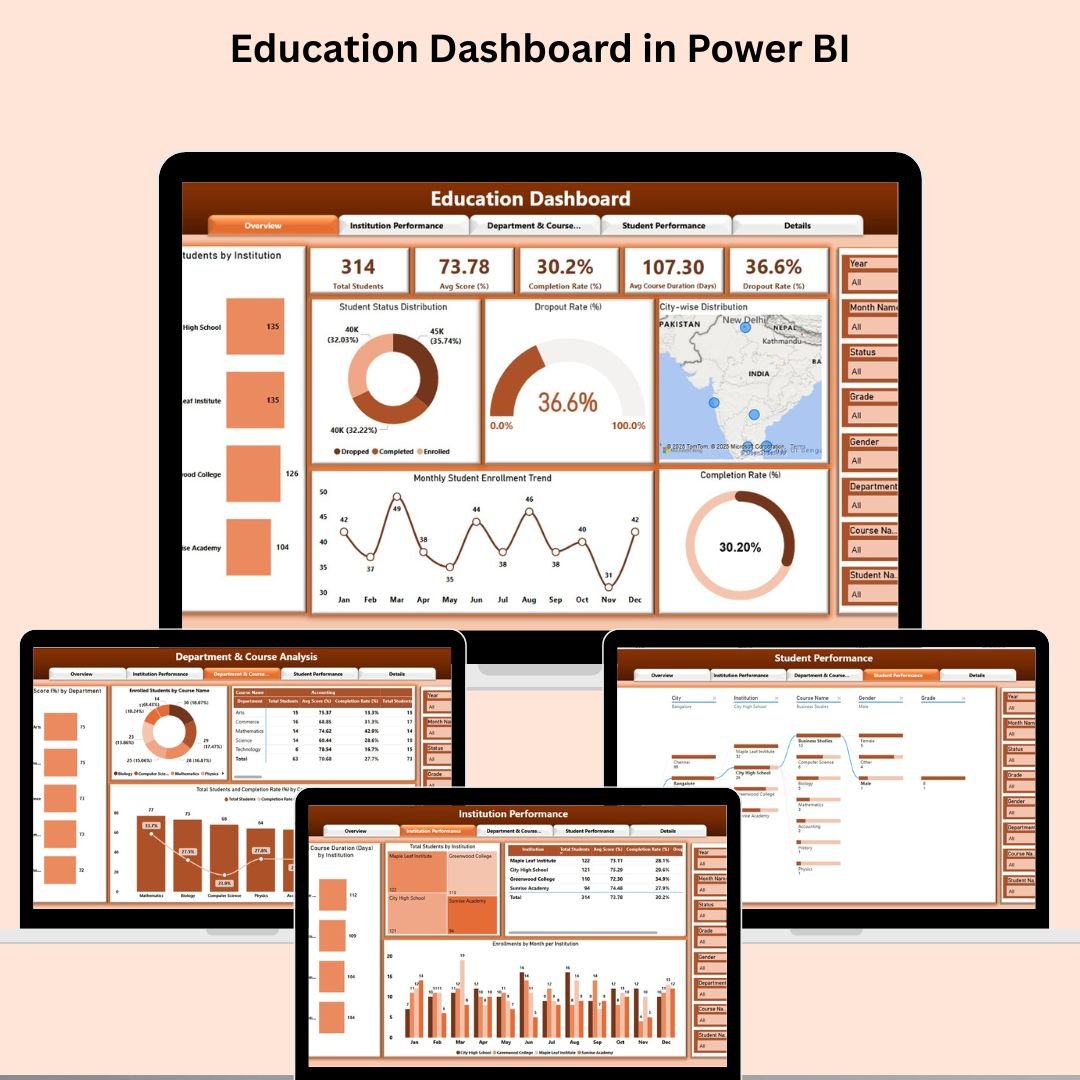

In today’s education sector, institutions must rely on more than just intuition—they need data-driven insights to elevate student outcomes, streamline operations, and make informed strategic decisions. That’s where the Education Dashboard in Power BI becomes a vital asset.
This ready-to-use Power BI dashboard is designed for schools, colleges, universities, and training institutes. It consolidates key performance indicators (KPIs) into dynamic, interactive visuals that give educators, administrators, and academic analysts a 360° view of institutional and student performance.
📊 What Does the Education Dashboard Offer?
The dashboard includes five comprehensive pages, each tailored to a specific focus area within educational management:
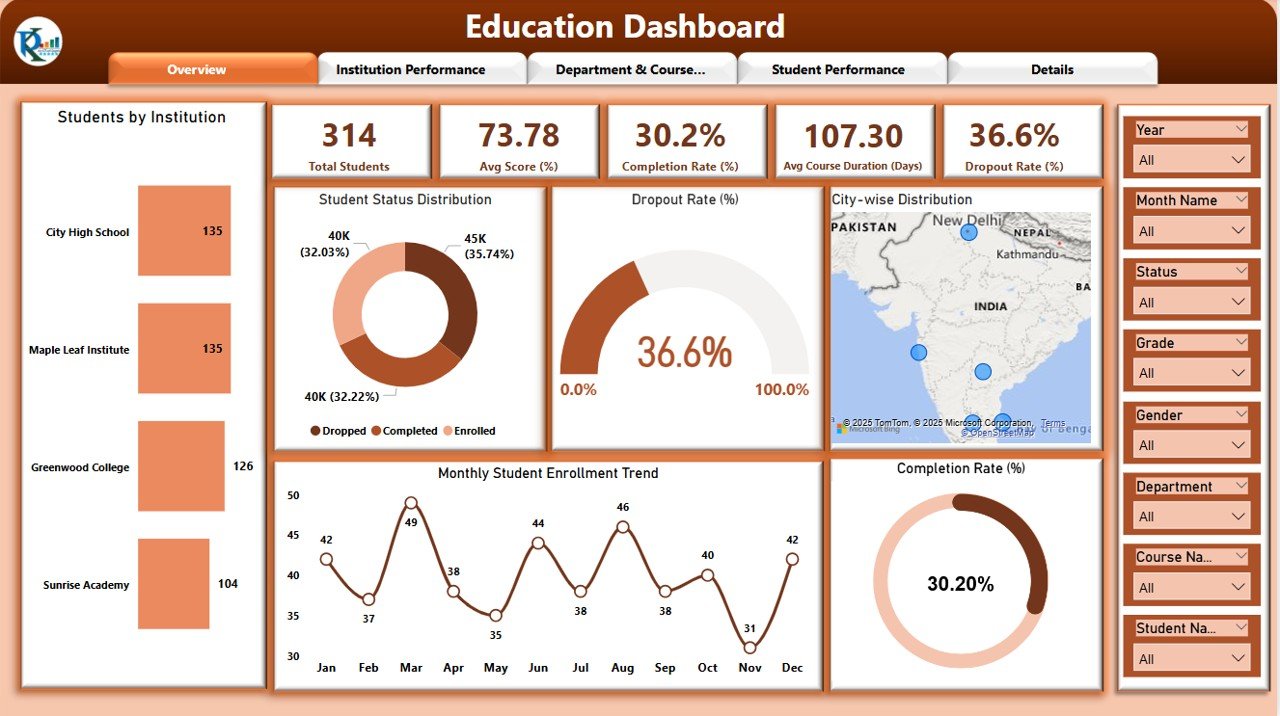
1. Overview Page
Quick-glance KPIs:
-
🎓 Total Students
-
📈 Average Score (%)
-
🏆 Completion Rate (%)
-
⏱️ Avg. Course Duration
-
❌ Dropout Rate (%)
Visuals:
-
Students by Institution
-
Dropout Rate Trend
-
Student Status Distribution
-
Monthly Enrollment Trend
-
City-wise Student Spread
-
Completion Rate Over Time
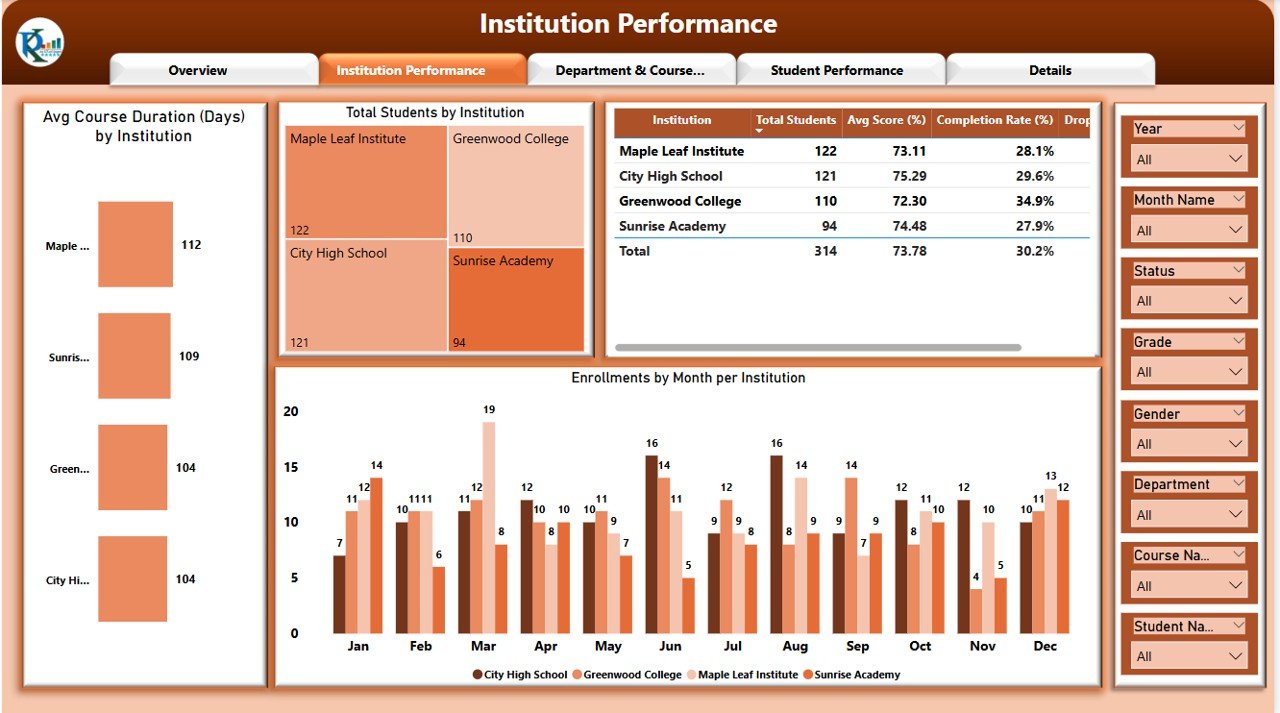
2. Institution Performance Page
Visuals & Tables:
-
Avg. Course Duration by Institution
-
Enrollments by Month per Institution
-
Total Students and KPIs by Institution
-
Institutional Comparison Slicers
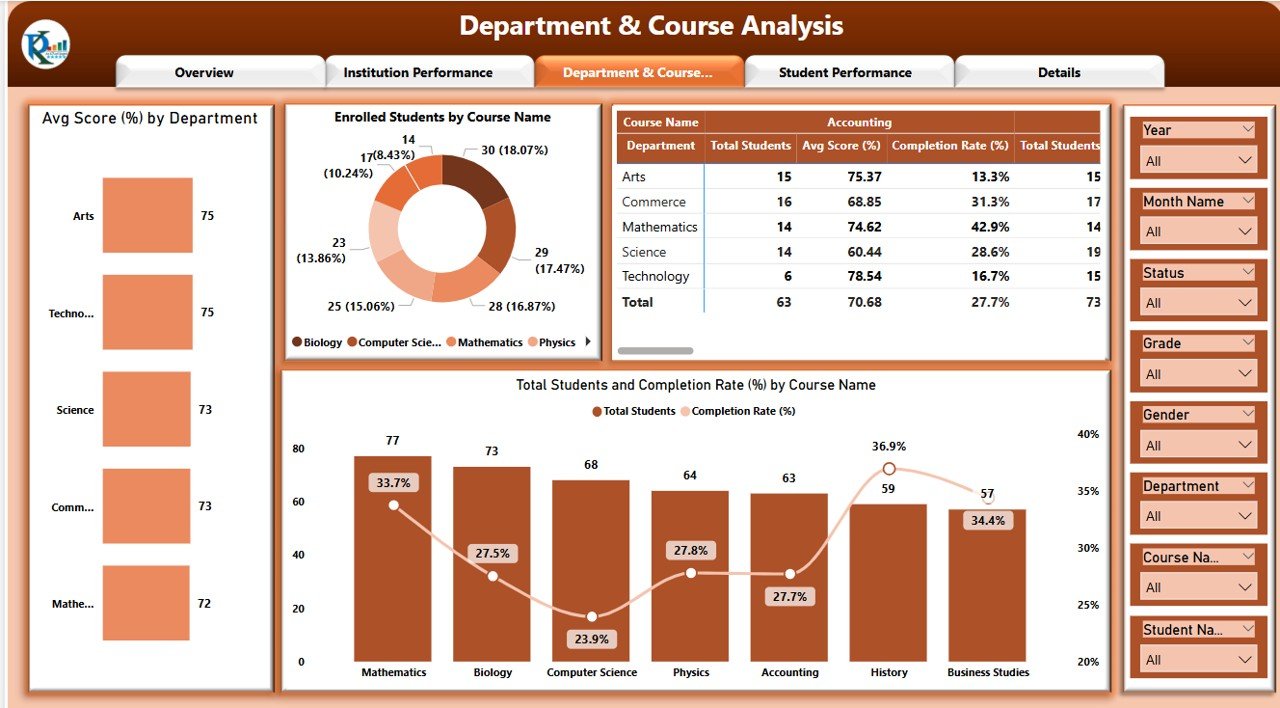
3. Department & Course Analysis Page
Dive into academic structure:
-
Avg. Score by Department
-
Enrolled Students by Course
-
Completion Rate by Course
Perfect for department heads and curriculum analysts.
4. Student Performance Page
🔍 Use decomposition trees to:
-
Filter by Institution, Department, Course
-
Analyze Score Ranges
-
Identify top and struggling students
Ideal for counseling and interventions.
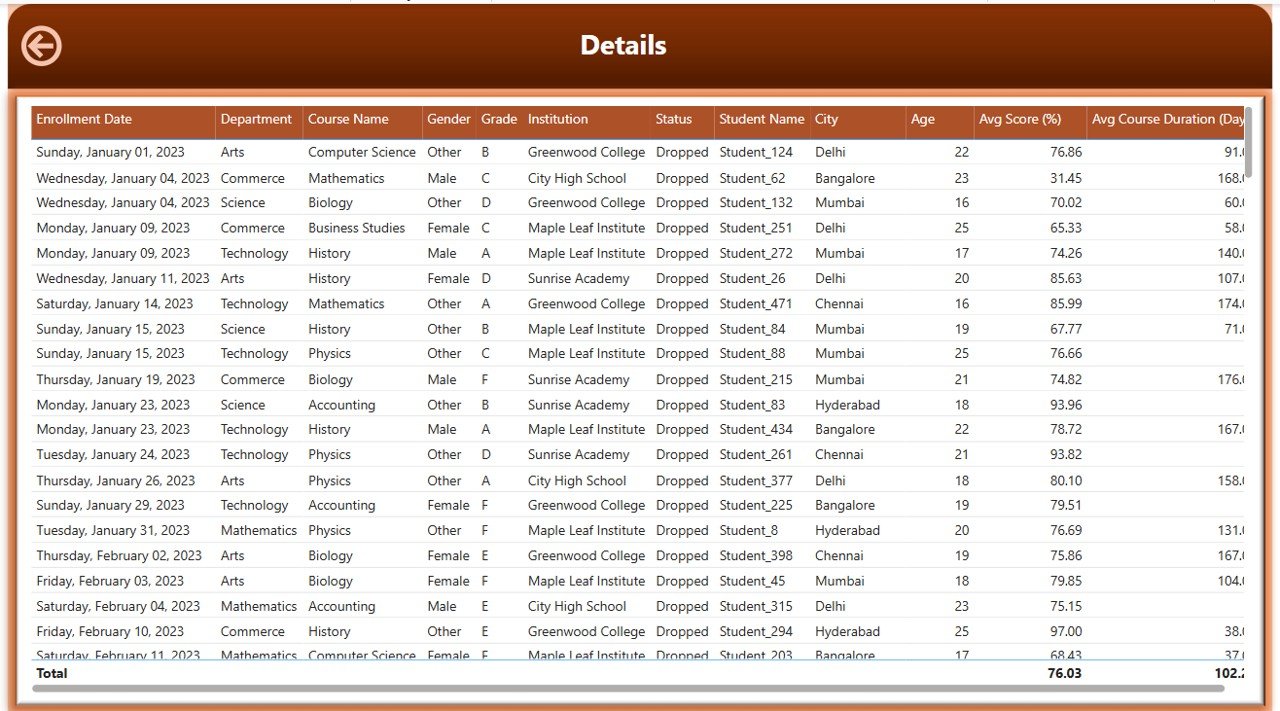
5. Details Drill-Through Page
Right-click and drill into any data point:
-
View student-level records
-
Export reports
-
Conduct case-by-case investigations
🎯 Advantages of Using This Dashboard
-
✔️ Real-time interactive reporting
-
✔️ Institution & student-level performance views
-
✔️ Data-backed academic planning
-
✔️ Custom visuals for seamless stakeholder communication
-
✔️ Drill-through & decomposition analysis
-
✔️ Scalable from K-12 to higher education
-
✔️ Centralizes academic KPIs for rapid decisions
💡 Opportunities to Improve the Dashboard
-
Add filters by year, semester, or class level
-
Track gender, age, or socioeconomic diversity
-
Integrate student satisfaction or feedback surveys
-
Set benchmarks using national averages
-
Include Power BI AI visuals for forecasting
-
Automate reports for monthly reviews
✅ Best Practices for Implementation
-
Refresh data monthly or per academic term
-
Keep KPIs visible across all pages
-
Use slicers smartly for targeted comparisons
-
Limit visuals per page for clarity
-
Train academic leaders on using the tool
-
Protect student-level data with access control
-
Use drill-through to investigate dropouts or high performers
🧑🏫 Who Should Use This Dashboard?
-
School Principals and Academic Deans
-
Data Analysts in Education
-
Curriculum Planners and Heads of Department
-
College Administrators and Government Education Officers
-
Training Center Directors
Click here to read detailed blog post
Watch the step-by-step video Demo:
📺 Learn More with Step-by-Step Tutorials
🎥 Visit our channel: YouTube.com/@PKAnExcelExpert


Reviews
There are no reviews yet.