

Digital assets such as images, videos, design files, brand documents, marketing creatives, and multimedia content are growing rapidly in every organization. However, as content volume increases, teams struggle with asset visibility, reuse tracking, storage optimization, compliance monitoring, and workflow efficiency. When digital assets are poorly managed, businesses waste time, money, and creative effort.
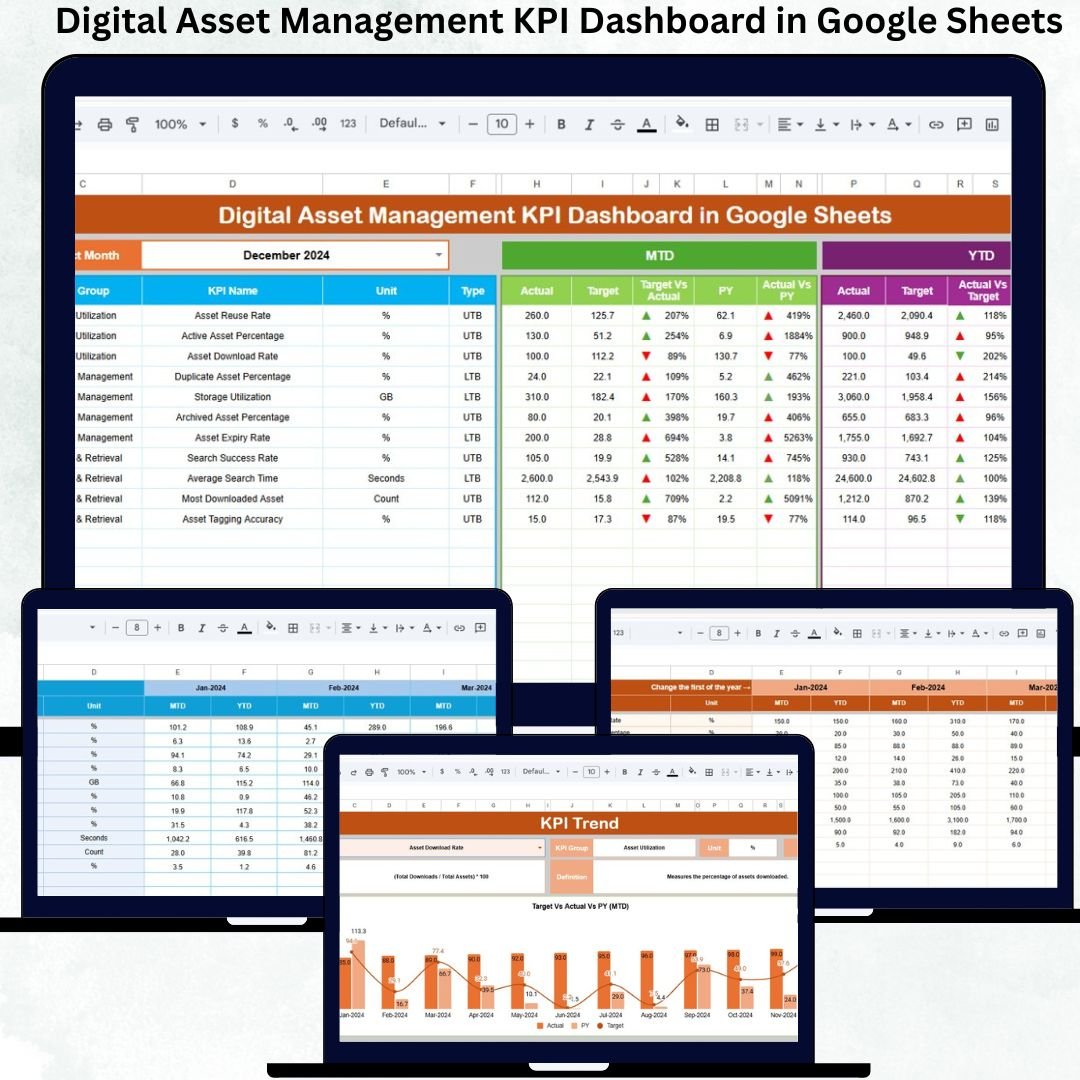
The Digital Asset Management KPI Dashboard in Google Sheets solves this problem by giving organizations a centralized, data-driven performance view of their digital assets. It tracks usage, accessibility, storage efficiency, compliance, and productivity using structured KPIs. Because the dashboard runs completely inside Google Sheets, teams collaborate effortlessly without investing in costly DAM software.
🚀 Key Features of the Digital Asset Management KPI Dashboard
✅ Centralized monitoring of all DAM KPIs
✅ Automated MTD & YTD calculations
✅ Target vs Actual & Previous Year comparison
✅ Visual trend indicators with arrows
✅ Standardized KPI definitions
✅ Fully built in Google Sheets – no setup cost
This dashboard transforms digital asset governance into a measurable, manageable process.
📦 What’s Inside the Digital Asset Management KPI Dashboard
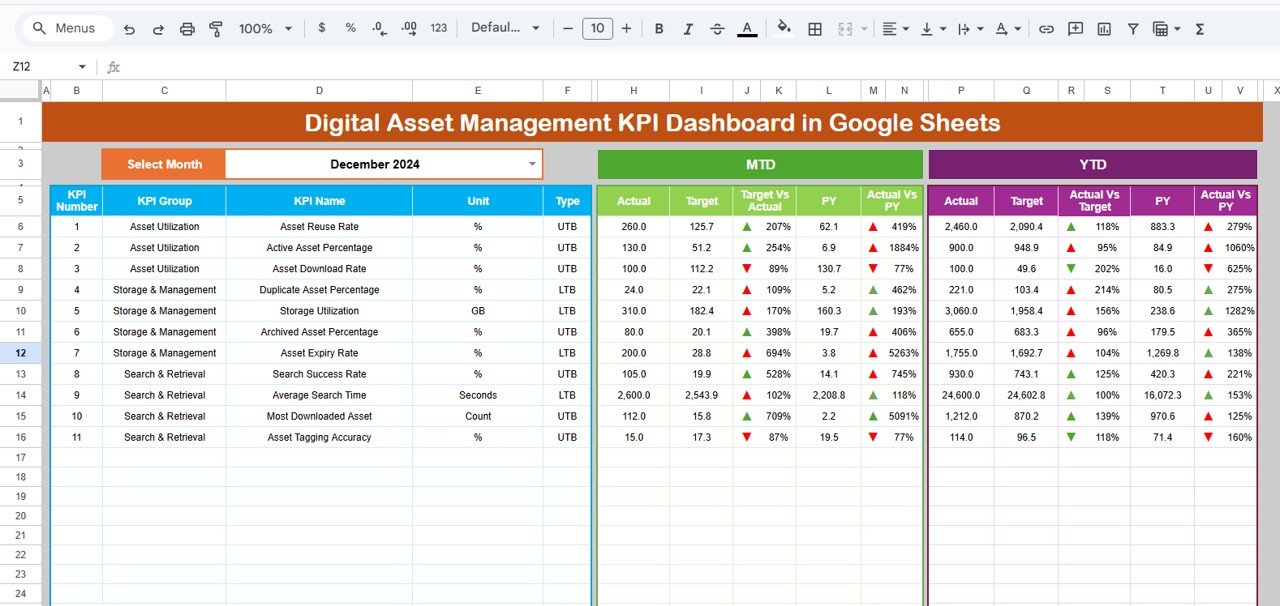
📊 1. Dashboard Sheet (Main Page)
This is the executive overview screen.
Select the month from the dropdown in cell D3
The entire dashboard updates instantly
It displays:
MTD Section
MTD Actual
MTD Target
MTD Previous Year
Target vs Actual
Previous Year vs Actual
YTD Section
YTD Actual
YTD Target
YTD Previous Year
Target vs Actual
Previous Year vs Actual
🔺 Green arrows indicate improvement
🔻 Red arrows highlight declines
This page is perfect for leadership reviews and DAM health checks.
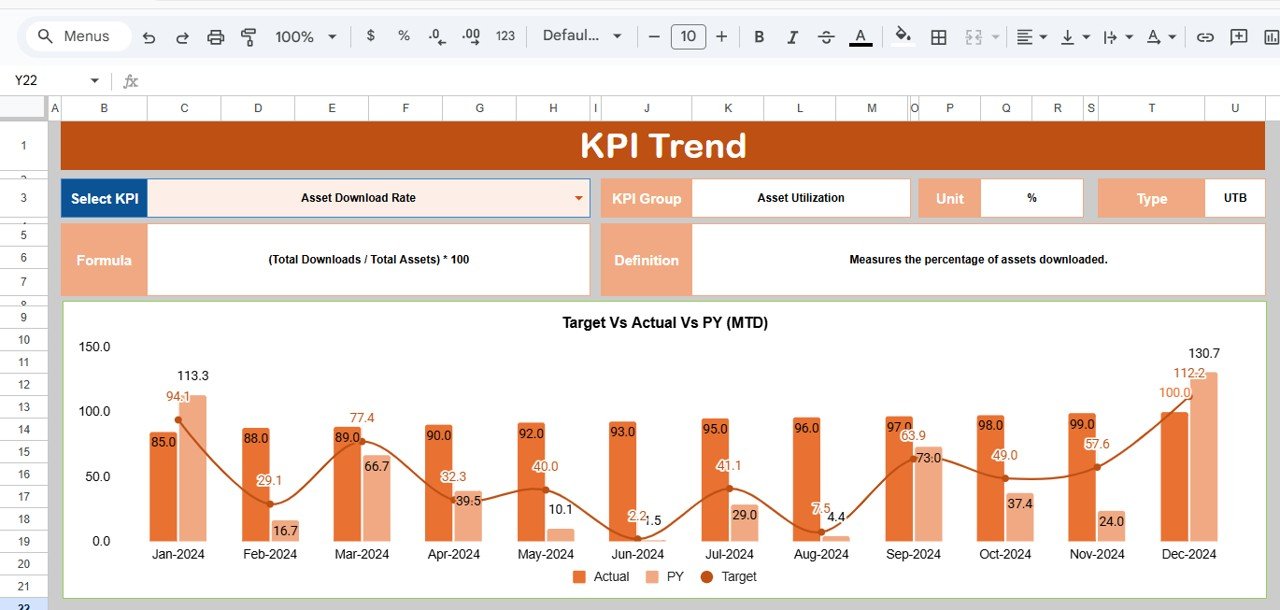
📈 2. KPI Trend Sheet Tab
This sheet allows deep analysis of individual KPIs.
Select any KPI from the dropdown in cell C3
Instantly view:
KPI Group
Unit
KPI Type (LTB / UTB)
Formula
KPI Definition
A month-wise trend chart helps identify duplication, poor reuse, tagging inefficiencies, or storage issues early.
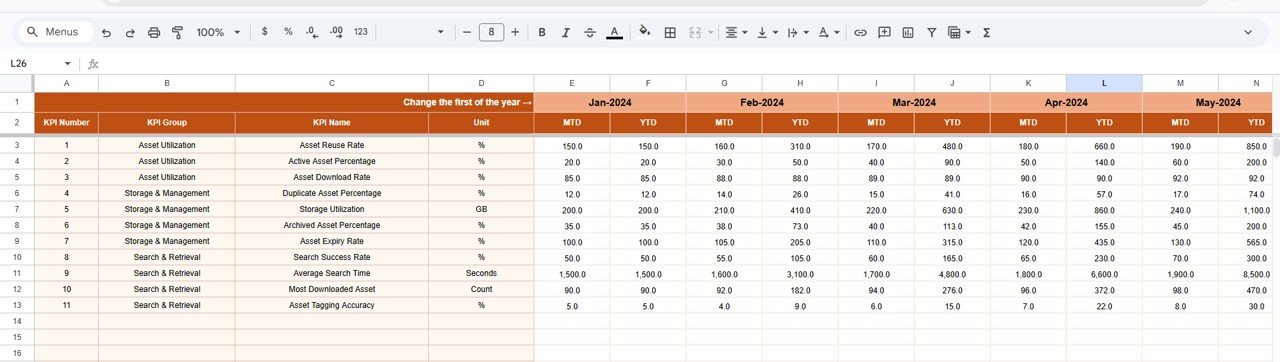
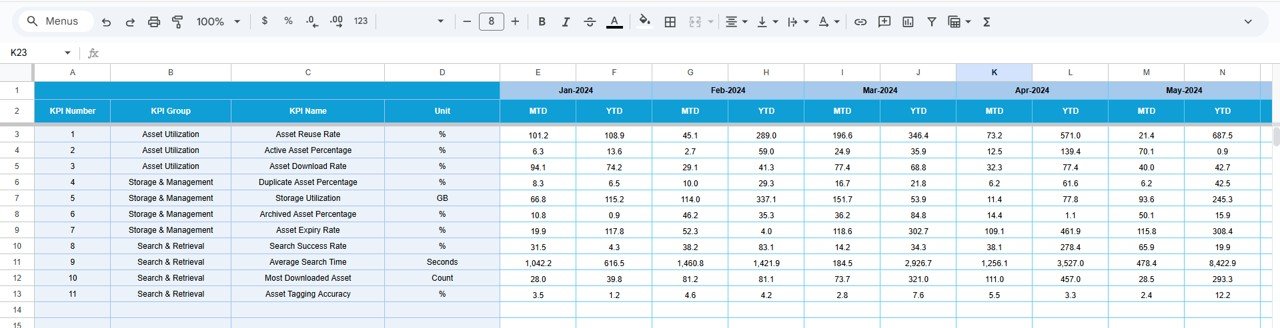
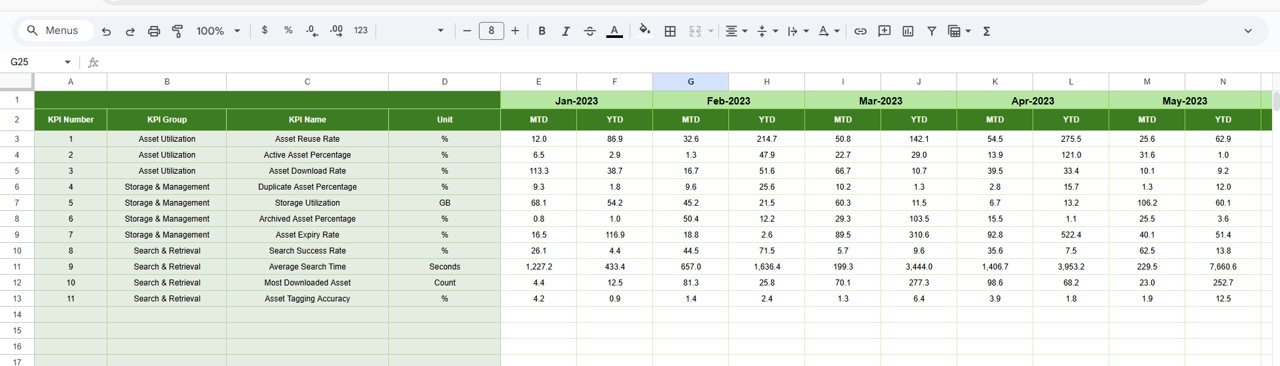
🧾 3. Actual Number Sheet Tab
This is the data entry layer.
Enter MTD Actual values
Enter YTD Actual values
Set the year’s first month in cell E1
Once updated, all dashboard pages refresh automatically.
🎯 4. Target Sheet Tab
This sheet defines performance benchmarks.
Monthly (MTD) targets
Annual (YTD) targets
Targets keep digital asset management aligned with branding, marketing, and operational goals.
📅 5. Previous Year Number Sheet Tab
This sheet stores past performance data to support:
Year-over-year KPIs
DAM maturity assessment
Long-term optimization tracking
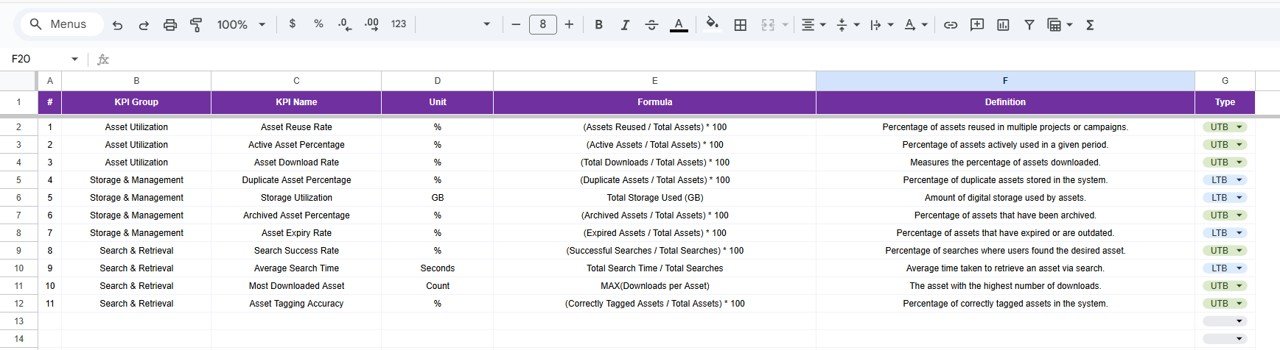
📘 6. KPI Definition Sheet Tab
This governance sheet ensures clarity.
It includes:
KPI Name
KPI Group
Unit
Formula
Definition
KPI Type (Lower the Better / Upper the Better)
This prevents KPI confusion across marketing, creative, and IT teams.
🛠️ How to Use the Digital Asset Management KPI Dashboard
1️⃣ Update asset usage data monthly
2️⃣ Maintain targets at the start of the year
3️⃣ Monitor Dashboard KPIs regularly
4️⃣ Use KPI Trend sheet for insights
5️⃣ Compare current vs previous year performance
No technical skills required—basic Google Sheets knowledge is enough.
👥 Who Can Benefit from This Dashboard
🎨 Marketing & Creative Teams
🏷️ Brand Management Teams
💻 IT & Digital Operations
📊 Content & Media Managers
🧑💼 Enterprise DAM Governance Teams
Suitable for small businesses, agencies, and enterprises.
✅ Advantages of Using This Dashboard
✔ Faster asset discovery
✔ Improved asset reuse rate
✔ Reduced storage waste
✔ Stronger brand & license compliance
✔ Optimized creative workflows
✔ Zero DAM software cost
🔧 Opportunities for Improvement
Integrate Google Drive, SharePoint, or cloud storage APIs
Add asset-type-wise KPIs
Track creative turnaround time
Enable automation alerts
Introduce AI tagging accuracy KPIs
✅ Best Practices
Update asset data consistently
Enforce metadata standards
Monitor duplication monthly
Align DAM KPIs with marketing goals
Maintain KPI definitions centrally
✅ Conclusion
The Digital Asset Management KPI Dashboard in Google Sheets gives organizations full control over digital content performance. It replaces guesswork with measurable insights, improves reuse, reduces waste, and strengthens compliance—all in a simple, cloud-based solution. With structured KPIs and clear trends, teams manage digital assets strategically instead of reactively.































Reviews
There are no reviews yet.