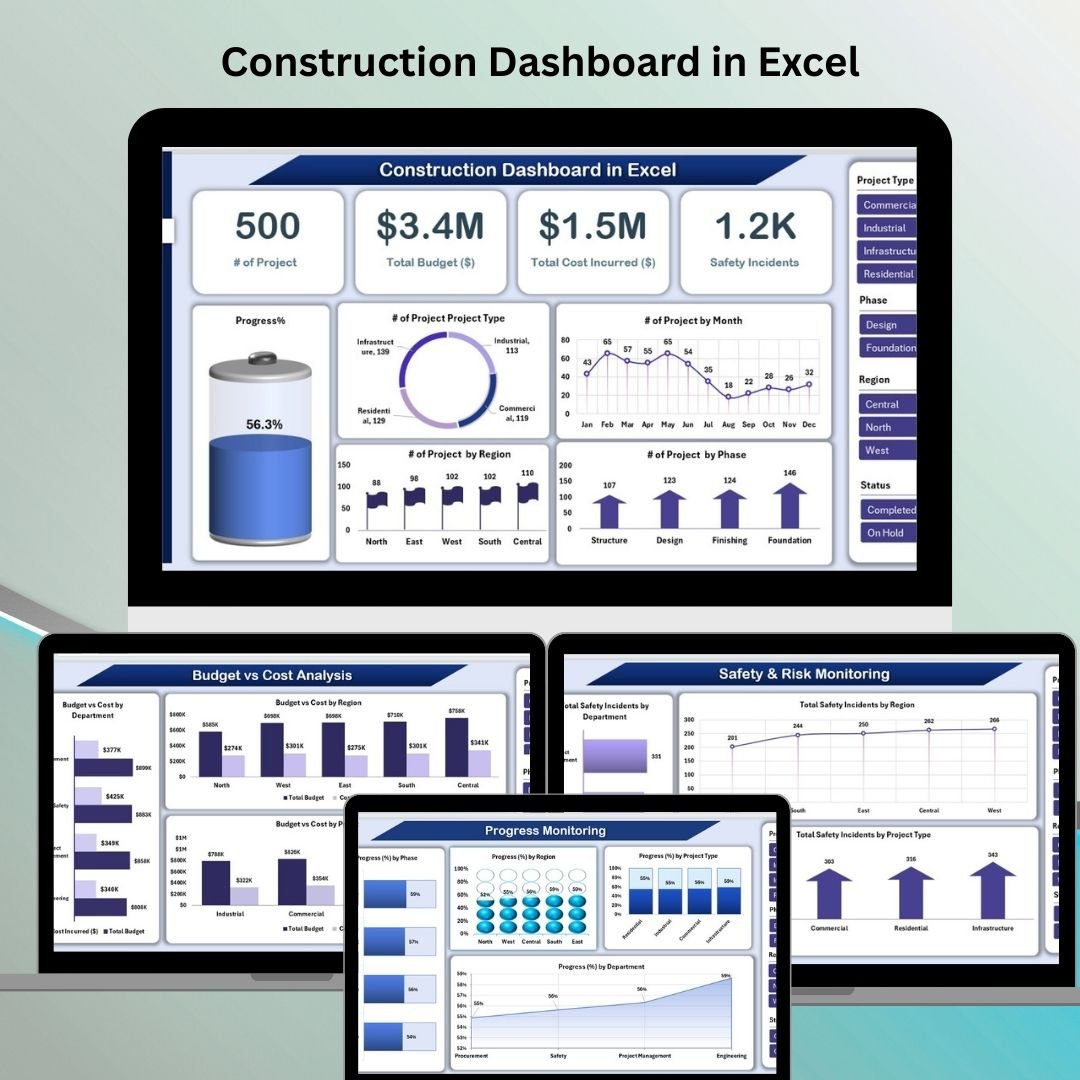
In the construction industry, delays, budget overruns, and communication breakdowns can derail even the best-planned projects. That’s why you need more than spreadsheets—you need insights. Introducing the Construction Dashboard in Excel — your all-in-one solution to track progress, monitor budgets, and analyze safety incidents across multiple projects with ease. 🏗️📊
This powerful, ready-to-use Excel tool gives construction managers, contractors, and department heads a centralized view of all ongoing projects, helping you stay ahead of potential issues and make informed decisions—faster.
✨ Key Features of the Construction Dashboard
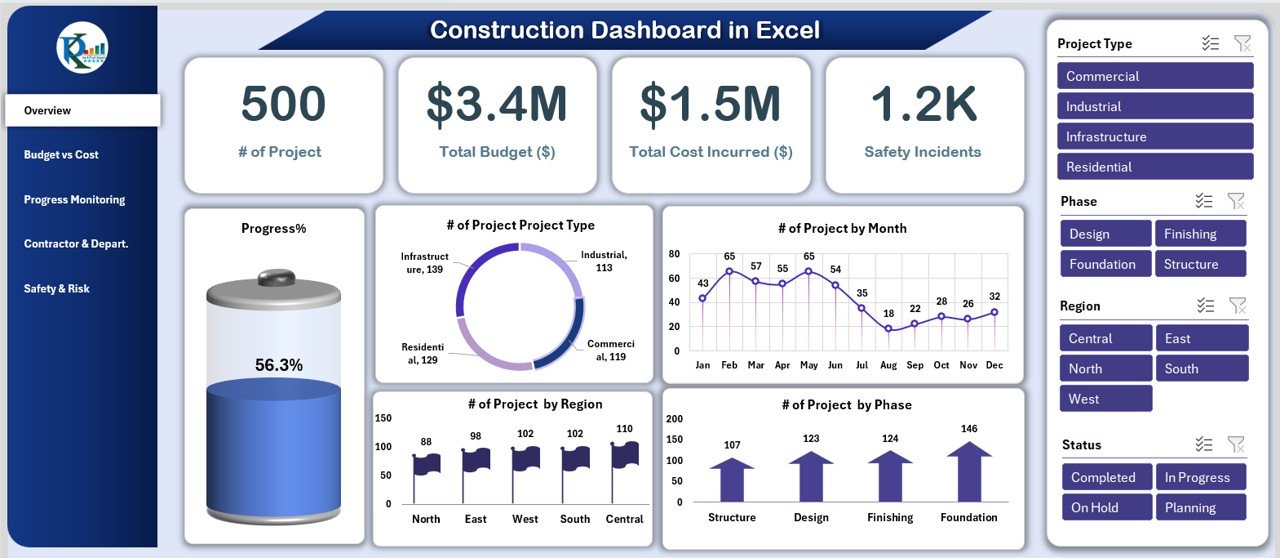
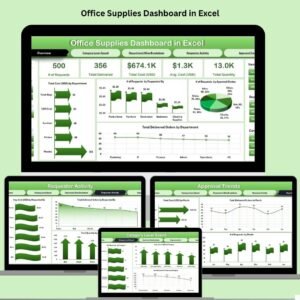
🏠 Overview Sheet – High-Level Insights at a Glance
Get a quick pulse of your entire operation:
-
🔢 # of Projects
-
💰 Total Budget vs. Cost
-
🚧 Safety Incidents
-
📊 Progress % across all projects
Visuals include:
-
📅 Projects by Month
-
📍 Projects by Region
-
🏗️ Projects by Type & Phase
Everything updates automatically as you change the data—no coding needed.
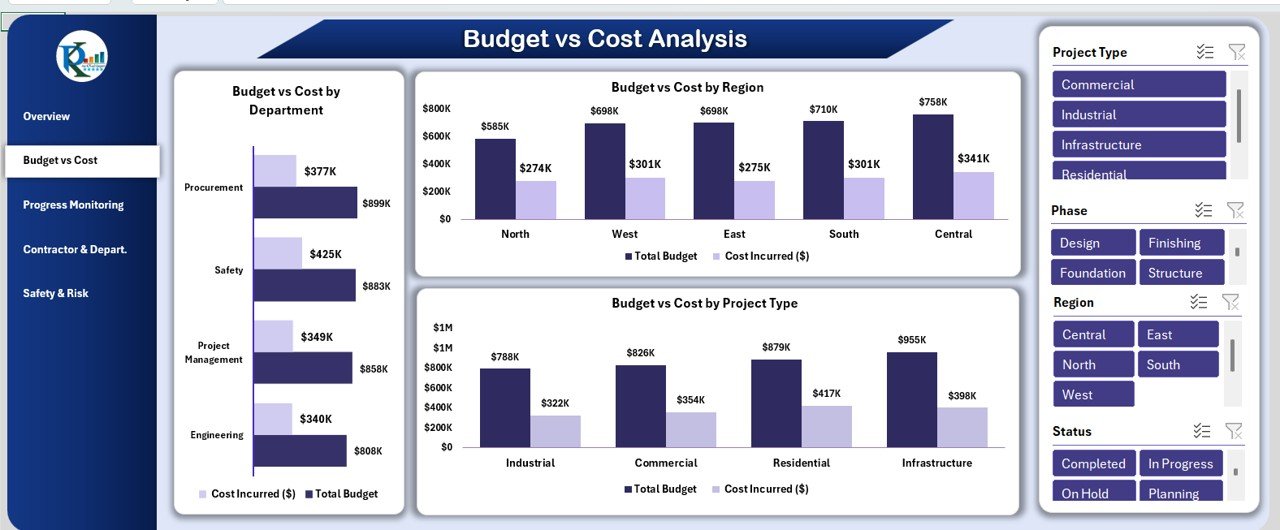
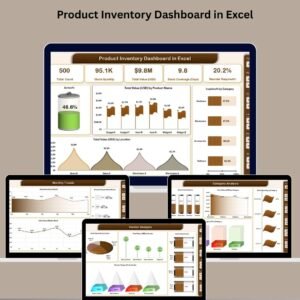
💸 Budget vs Cost Sheet – Track Financial Health
Compare projected budgets vs actual costs across:
-
🏢 Departments
-
🌍 Regions
-
🏘️ Project Types
Easily identify budget overruns or areas of savings to optimize spending.
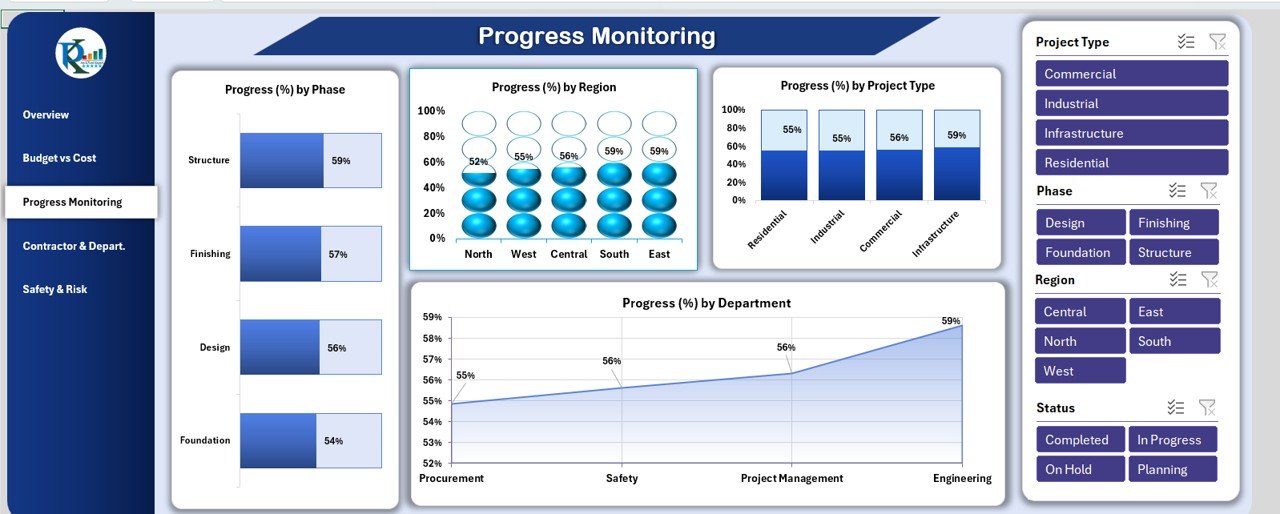
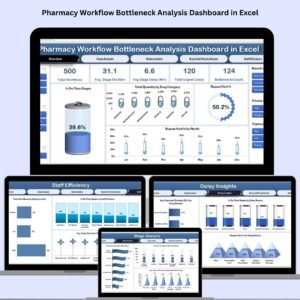
📈 Progress Monitoring Sheet – Keep Projects on Track
Monitor progress (%) based on:
-
Project Phase
-
Region
-
Department
-
Project Type
Instantly spot which areas are lagging and which are ahead of schedule.
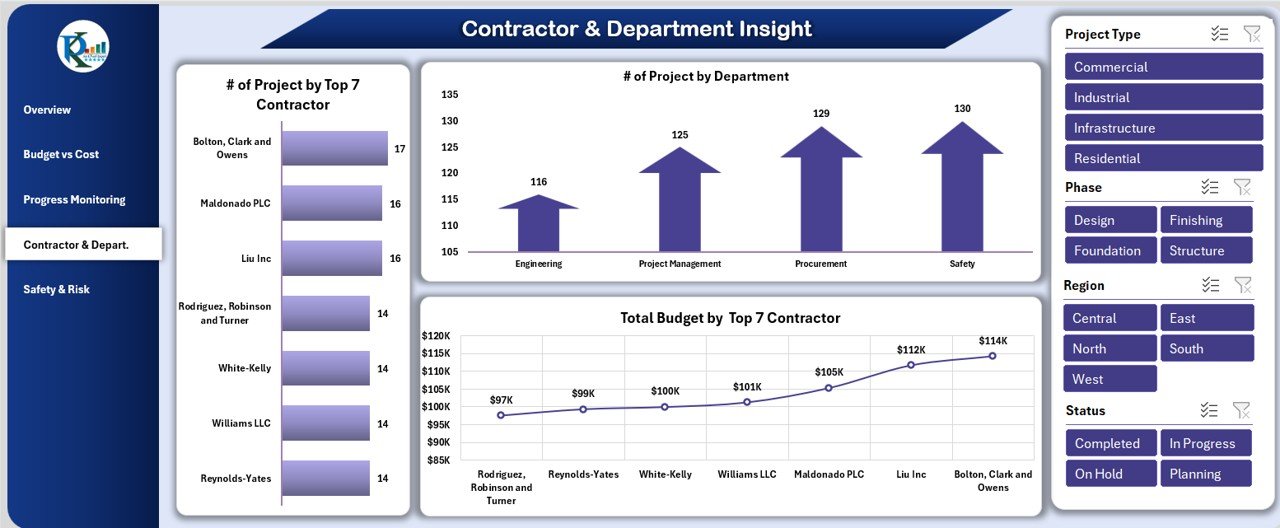
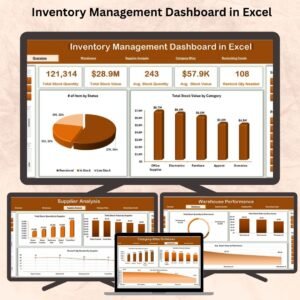
🧱 Contractor & Department Sheet – Performance Transparency
Visualize:
-
Top 7 Contractors by # of Projects and Budget
-
of Projects by Department
Empower data-driven decisions when assigning future projects.
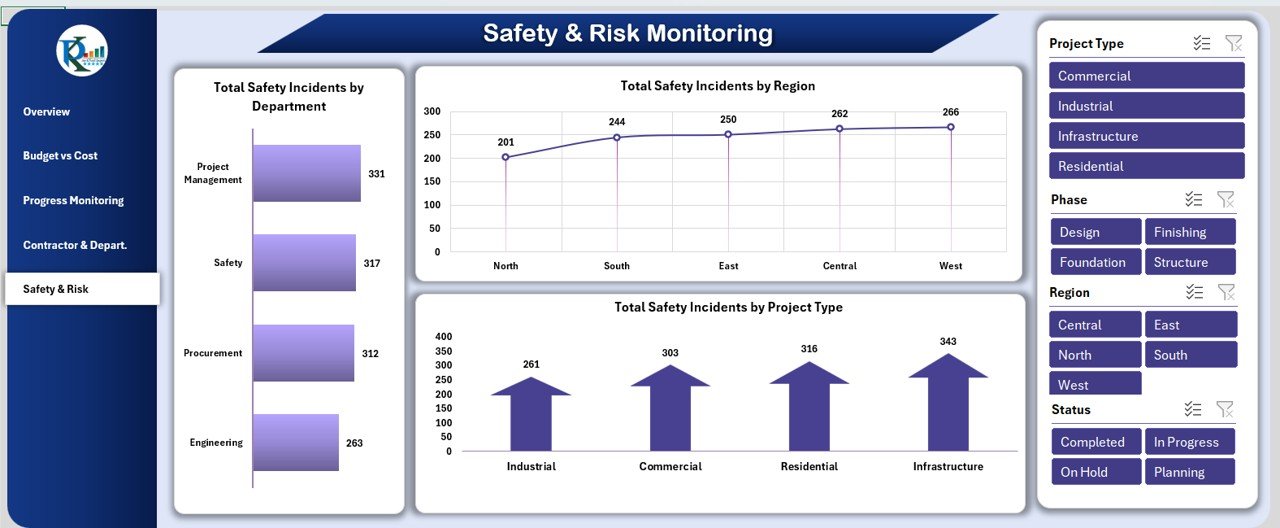
⚠️ Safety & Risk Sheet – Prioritize Safety First
Track safety incidents by:
-
Department
-
Region
-
Project Type
Maintain compliance, reduce risk, and create safer work environments with transparent safety performance metrics.
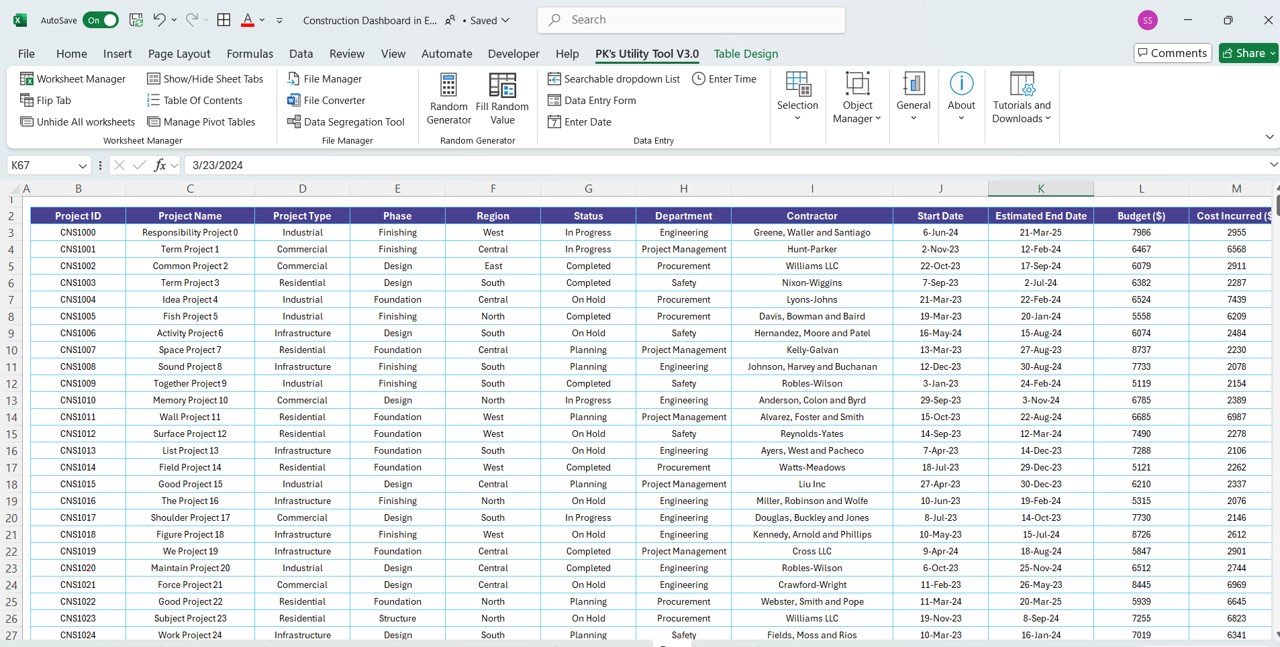
🧾 Data Sheet – Your Input Hub
One tab to rule them all! Simply:
-
Enter your project name, type, budget, cost, region, phase, and status
-
Watch every dashboard tab update dynamically
-
Designed for easy collaboration and accurate tracking
📦 What’s Inside the Excel File?
-
🏠 Overview Sheet
-
💸 Budget vs Cost Sheet
-
📈 Progress Monitoring Sheet
-
🧱 Contractor & Department Sheet
-
⚠️ Safety & Risk Sheet
-
🧾 Data Entry Sheet (dynamic backend)
Includes slicers, pivot charts, and clean formatting for fast navigation and deep insights.
🧠 How to Use the Construction Dashboard
-
📥 Download and open the Excel file
-
🧾 Input project details in the Data Sheet tab
-
🔁 Review live updates on every dashboard tab
-
🏗️ Track progress, budget, and safety in real-time
-
🔧 Customize for departments, phases, contractors, or KPIs
No coding. No formulas. Just plug-and-play.
👥 Who Can Benefit from This Dashboard?
-
👷♂️ Construction Project Managers – Oversee multi-site operations
-
🧑💼 Contractors & Engineers – Monitor performance & costs
-
🏢 Company Executives – View high-level insights in one place
-
🏗️ Infrastructure & Civil Firms – Manage timelines & resources
-
🧰 Department Heads – Track safety and project allocations
Whether you’re building bridges, offices, or homes—this tool is your construction control room.
🔗 Click here to read the Detailed blog post
📺 Visit our YouTube channel to learn step-by-step video tutorials


Reviews
There are no reviews yet.