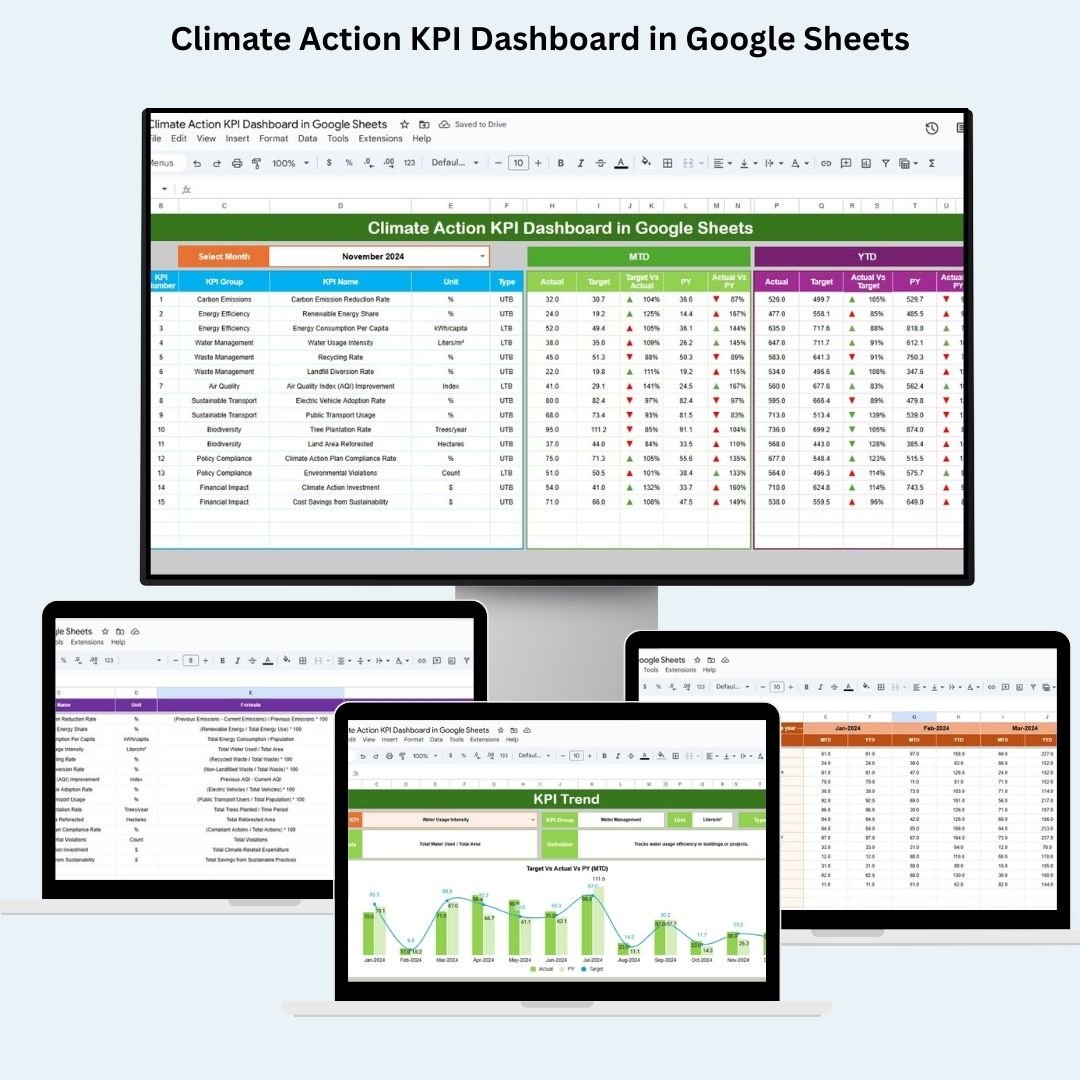
The Climate Action KPI Dashboard in Google Sheets is an essential tool designed to help organizations effectively track their climate action goals. With the growing importance of addressing climate change, this dashboard serves as a centralized platform for monitoring key performance indicators (KPIs) that align with climate-related objectives. 🌍🌱
Some of the key features include:
-
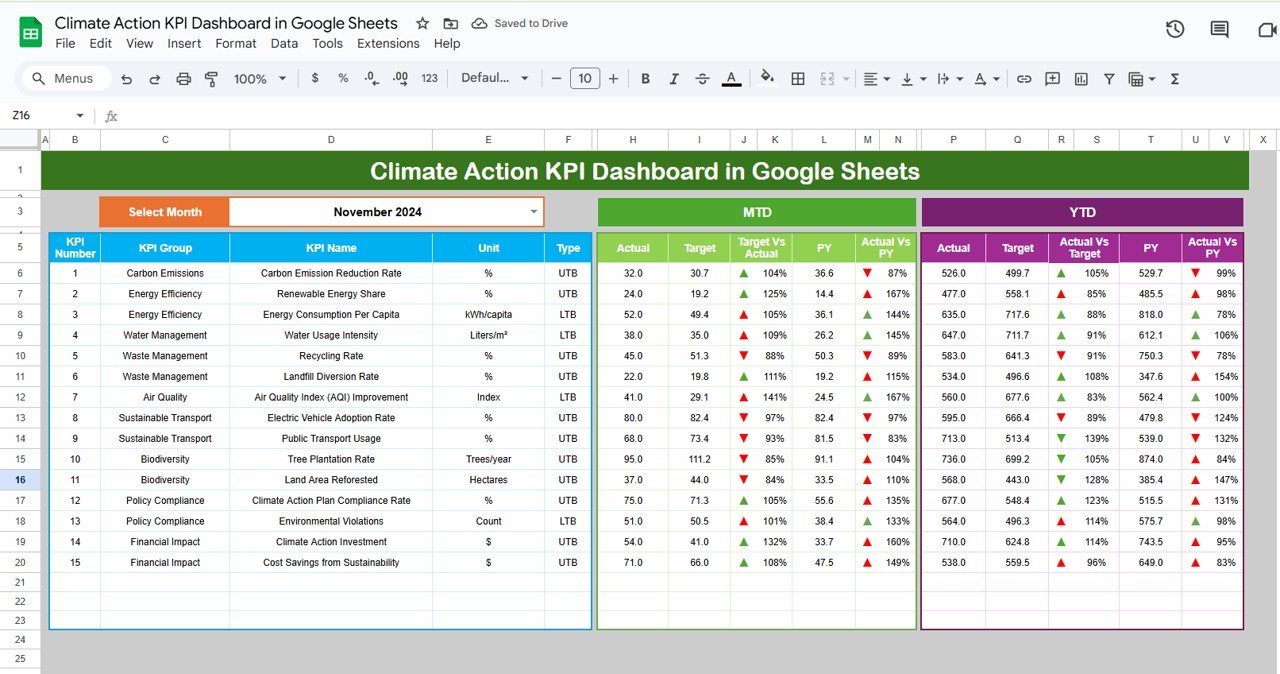
Dashboard Sheet Tab: This sheet serves as the main interface where users can view the overall performance of various KPIs. It enables users to compare actual performance against targets and historical data. 📊
-
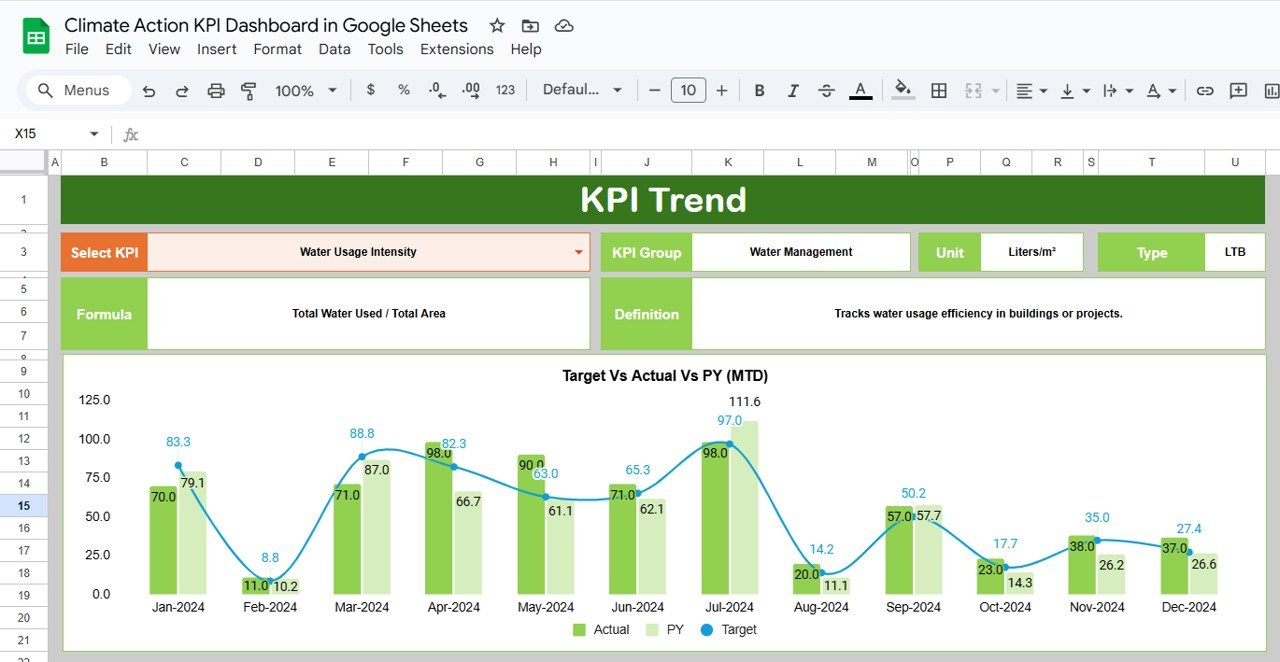
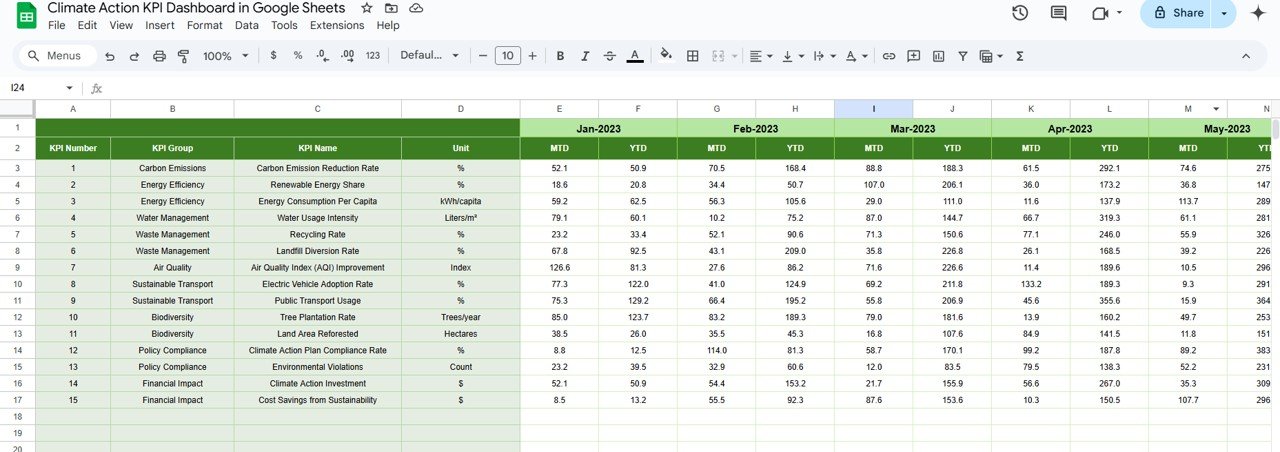
KPI Trend Sheet Tab: This sheet allows users to track the performance of each KPI over time. Users can select specific KPIs from a dropdown, and the sheet displays detailed information on the KPI’s performance, group, formula, and type. 📈
-
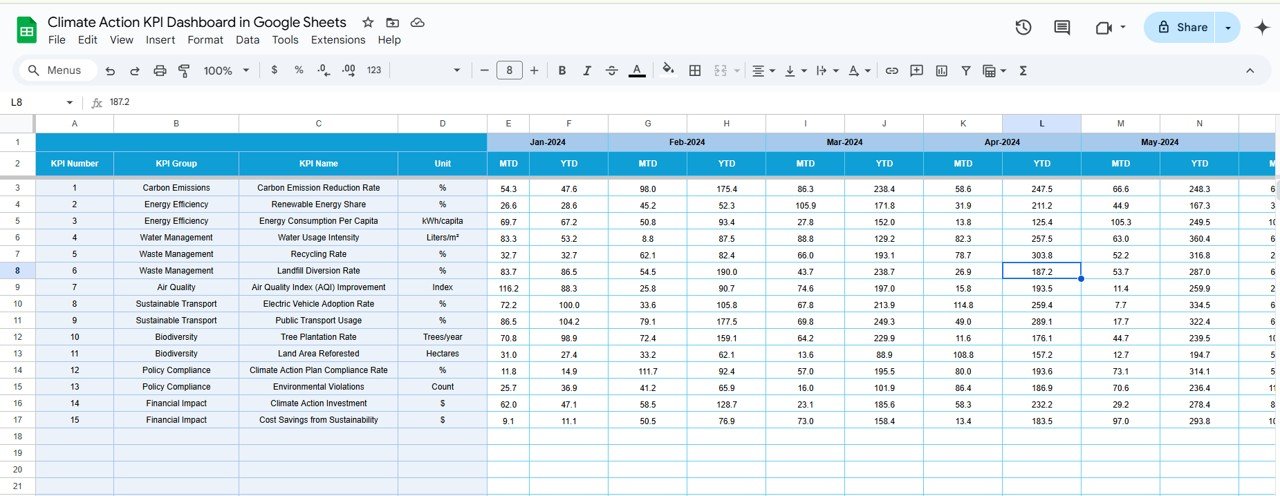
Actual Numbers Sheet Tab: Here, users can input the actual data for each KPI. The sheet automatically calculates the differences from the targets and previous years, ensuring that you always have up-to-date data. 🗓️
-
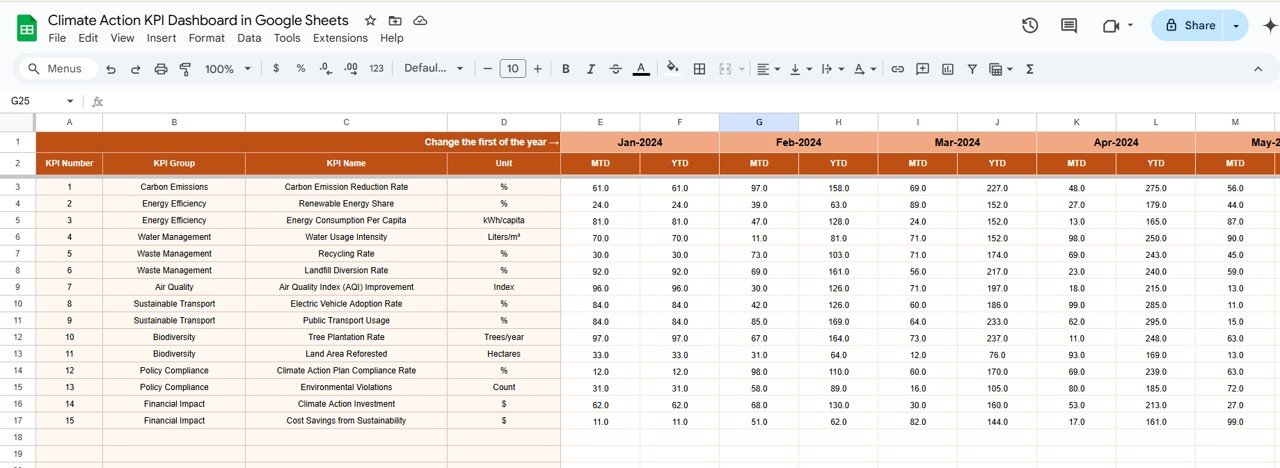
Target Sheet Tab: This sheet allows you to input target values for each KPI, both for the month and the year. It helps ensure that you can track whether your organization is meeting its climate action goals. 🎯
-
Previous Year Numbers Sheet Tab: Users can compare the current year’s performance with data from the previous year. This sheet enables you to track progress and identify any trends over time. 📅
-
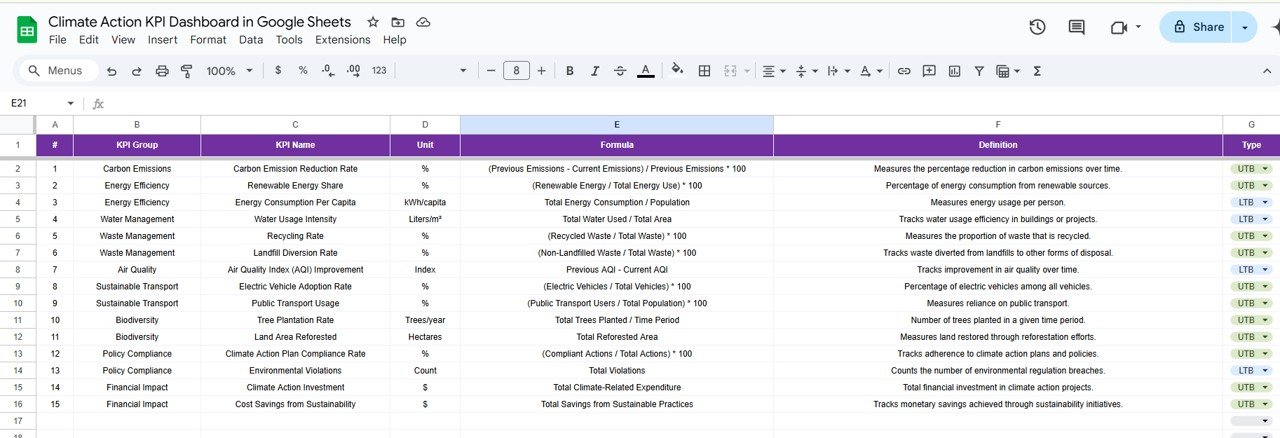
KPI Definition Sheet Tab: This sheet offers clear definitions for each KPI, ensuring that every user understands the purpose of each metric and how it’s calculated. 📚
What’s Inside the Climate Action KPI Dashboard
The Climate Action KPI Dashboard comes packed with several features that make tracking climate data straightforward and insightful:
-
Interactive Data Selection: With a dropdown feature to select specific months and KPIs, the dashboard enables real-time updates and customized views. 🌍
-
Real-Time Monitoring: By tracking both Month-to-Date (MTD) and Year-to-Date (YTD) performance, users can immediately assess their climate action progress and make timely adjustments. 🕰️
-
Visual Data Presentation: The dashboard uses color-coded arrows and charts to visually highlight trends, performance gaps, and areas that require attention. 📊🔴🟢
-
Customization: The dashboard is highly customizable to fit different organizations’ climate goals. Whether it’s tracking energy efficiency, carbon emissions, or sustainable sourcing, you can adapt the dashboard to suit your needs. ✏️
-
Collaborative Access: Since it’s built on Google Sheets, multiple team members can access and edit the dashboard simultaneously, improving collaboration and transparency. 🌐
How to Use the Climate Action KPI Dashboard
Using the Climate Action KPI Dashboard in Google Sheets is easy and efficient:
-
Input Your Data: Begin by entering the actual performance data for each KPI in the Actual Numbers Sheet. This will automatically update the rest of the dashboard with your performance metrics. 🔢
-
Set Your Targets: In the Target Sheet, input your desired goals for each KPI. The dashboard will compare these targets against your actual performance to highlight any areas of improvement. 🎯
-
Track Trends: Use the KPI Trend Sheet to monitor how each KPI evolves over time. This helps you identify patterns, whether positive or negative, and make informed decisions. 📅
-
Analyze Year-on-Year Performance: The Previous Year Numbers Sheet allows for historical comparisons, giving you insights into how your efforts are progressing over multiple years. 📉
-
Collaborate with Your Team: Share the dashboard with your team using Google Sheets’ cloud-based features. Collaborate seamlessly to track climate action goals together. 🤝
Who Can Benefit from This Climate Action KPI Dashboard
The Climate Action KPI Dashboard is ideal for:
-
Environmental NGOs: Track and monitor your environmental sustainability efforts, from energy use to waste reduction. 🌍
-
Corporations with Sustainability Goals: Large companies can use this dashboard to align their business strategies with climate action targets, ensuring compliance with sustainability initiatives. 💼
-
Government and Public Sector Organizations: Monitor climate action policies and their effectiveness across various departments or regions. 🏛️
-
Climate Action Researchers and Consultants: Provide actionable insights to clients or stakeholders by utilizing data visualization and performance trends. 📊
This dashboard is also valuable for policy makers, activists, and consultants focused on achieving measurable climate outcomes. 🌱
Click here to read the Detailed Blog Post
Watch the step-by-step video Demo:


Reviews
There are no reviews yet.