
In the fast-evolving automotive industry, data-driven decisions are no longer optional—they’re essential. The Automotive Dashboard in Power BI is a professional, ready-to-use analytical tool designed to help organizations monitor, analyze, and optimize vehicle performance and operational efficiency.
From tracking fleet utilization and maintenance costs to monitoring regional fuel efficiency, this Power BI dashboard gives you a 360° view of your automotive operations. Built with clean data models, interactive visuals, and intuitive navigation, it empowers managers, executives, and analysts to make faster, smarter, and more strategic decisions.
Instead of relying on static reports or spreadsheets, this dashboard automates data analysis and visualization—turning complex automotive data into actionable insights at your fingertips.
⚙️ Key Features of the Automotive Dashboard in Power BI
📊 Five Analytical Pages – Complete Operational Visibility
This dashboard includes Overview, Department Analysis, Region Analysis, Vehicle Analysis, and Monthly Trends pages—each designed for targeted insights and visual storytelling.
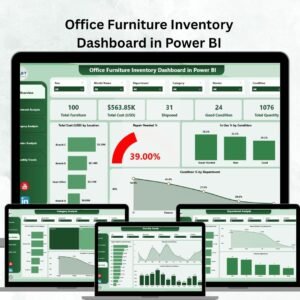
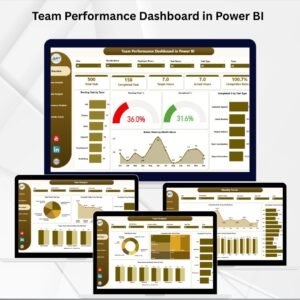
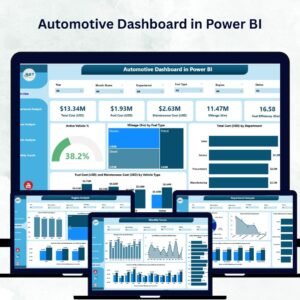
🔍 Overview Page – The Command Center
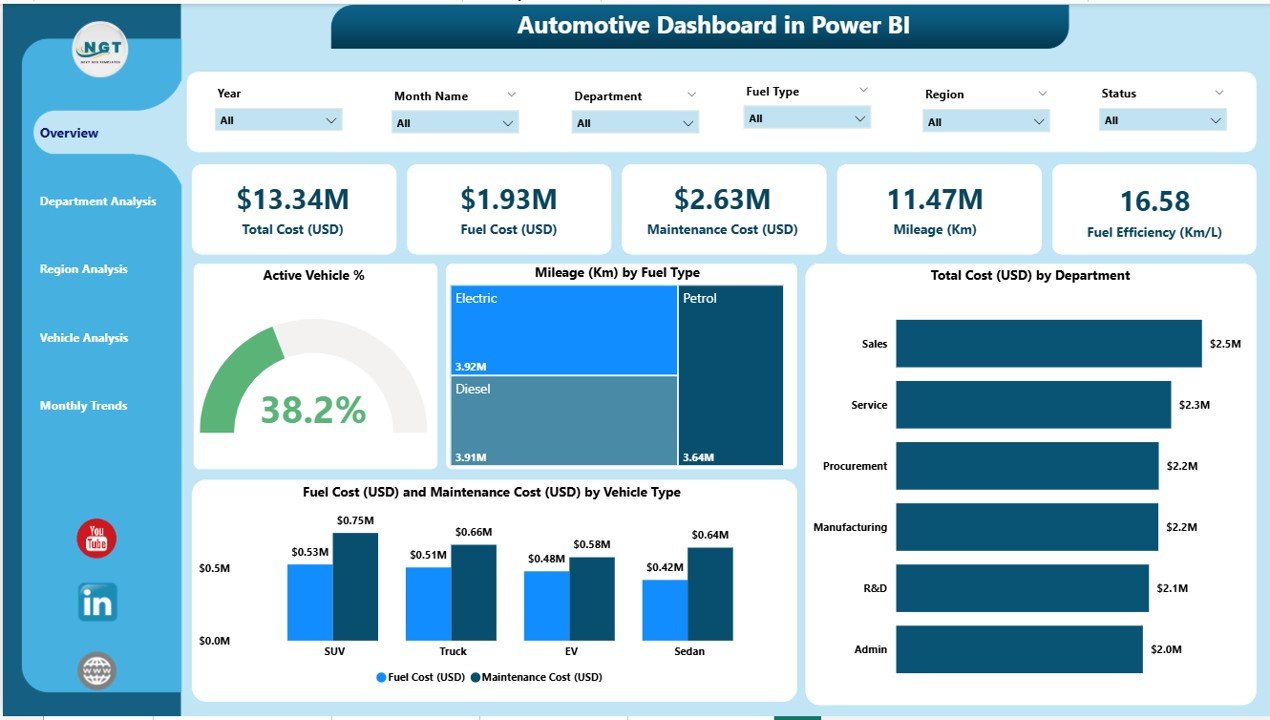
Your high-level snapshot of key metrics:
-
5 KPI Cards: Total Active Vehicles, Total Mileage, Fuel Cost, Maintenance Cost, and Operational Cost.
-
Interactive Filters: View data by Department, Region, or Vehicle Type.
-
Charts Include:
-
Active Vehicle %
-
Mileage (Km) by Fuel Type
-
Total Cost (USD) by Department
-
Fuel & Maintenance Cost by Vehicle Type
-
This page instantly summarizes performance for leadership teams and management reviews.
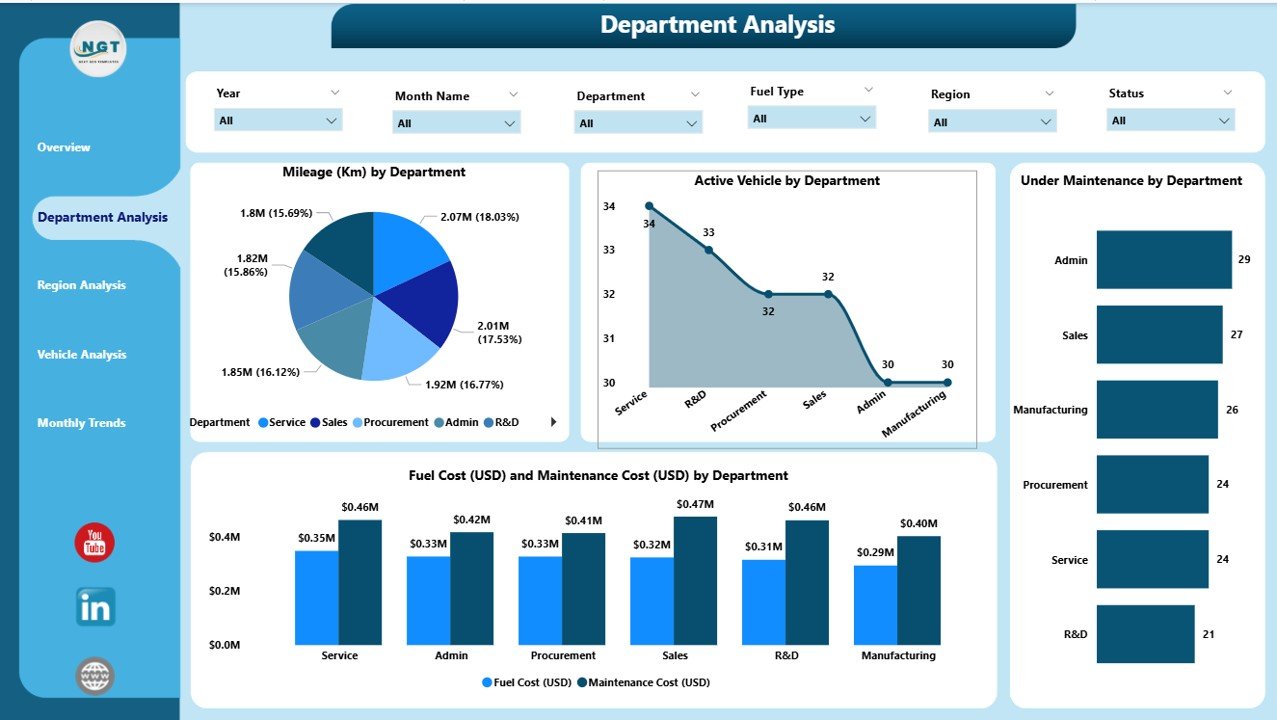
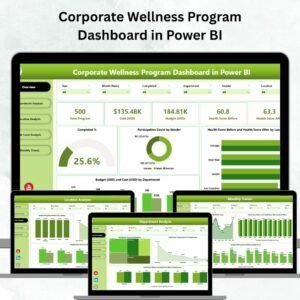
🏢 Department Analysis Page – Track Departmental Efficiency
Analyze cost and performance at the department level:
-
Mileage (Km) by Department
-
Active Vehicles & Under Maintenance %
-
Fuel & Maintenance Cost (USD) by Department
Identify over-budget teams and optimize departmental efficiency with precision.
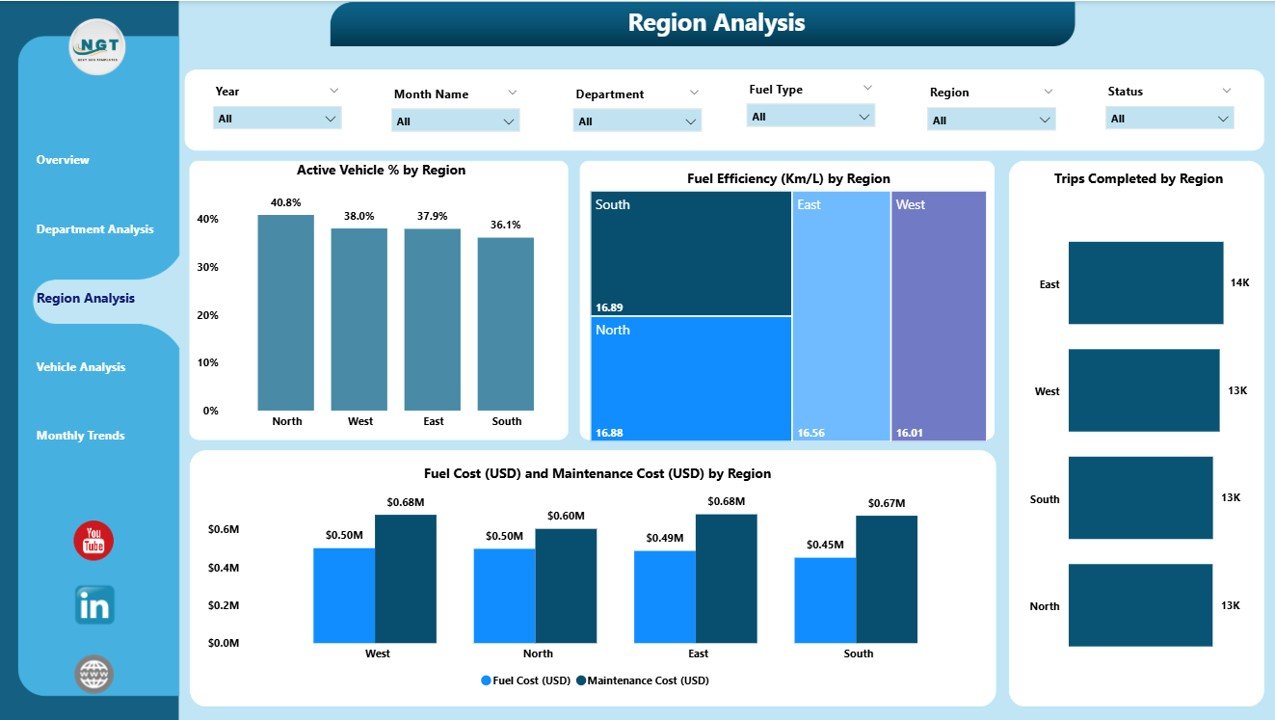
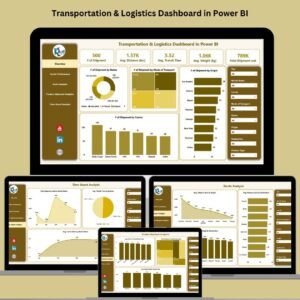
🌍 Region Analysis Page – Compare Regional Performance
Understand performance variations across regions:
-
Active Vehicle % by Region
-
Fuel Efficiency (Km/L) by Region
-
Trips Completed by Region
-
Fuel & Maintenance Cost (USD) by Region
Perfect for benchmarking and resource allocation decisions.
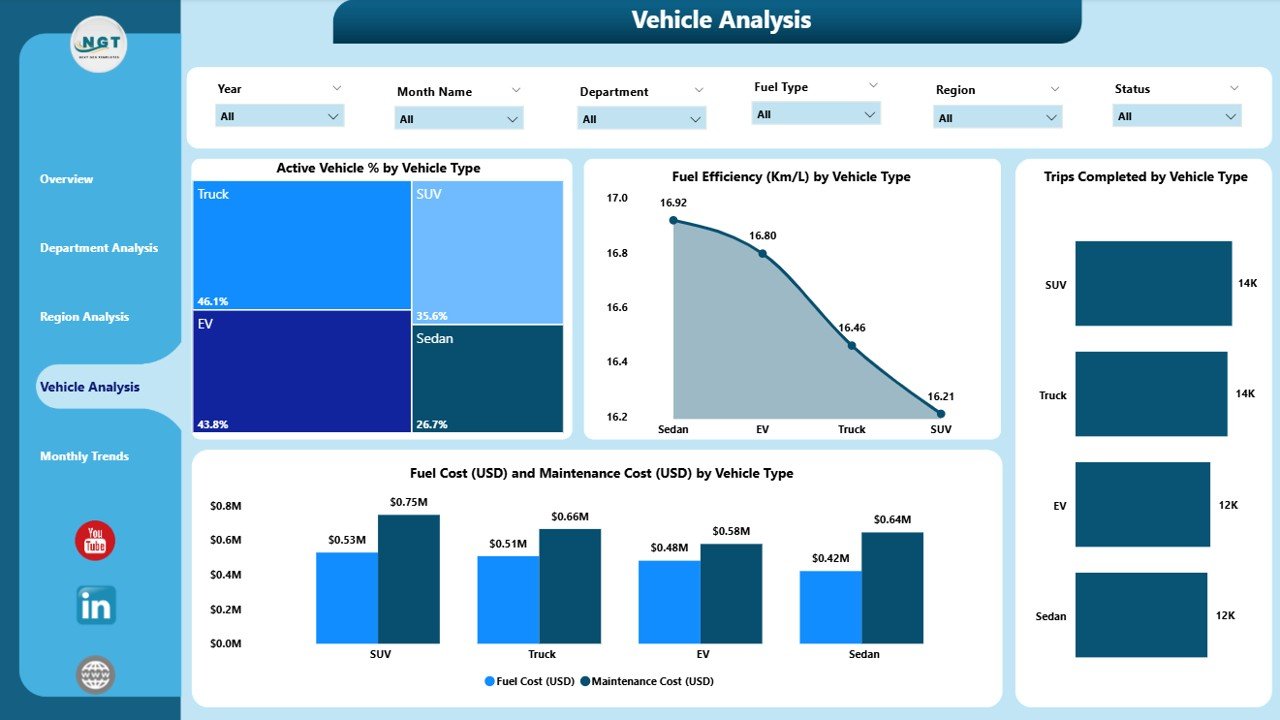
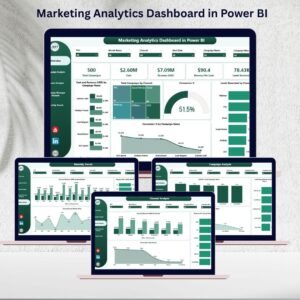
🚗 Vehicle Analysis Page – Evaluate Asset Utilization
Dive into performance by vehicle category:
-
Active Vehicle % by Vehicle Type
-
Fuel Efficiency (Km/L) by Vehicle Type
-
Trips Completed by Vehicle Type
-
Fuel & Maintenance Cost (USD) by Vehicle Type
Quickly identify underperforming vehicles and optimize fleet renewal or rotation plans.
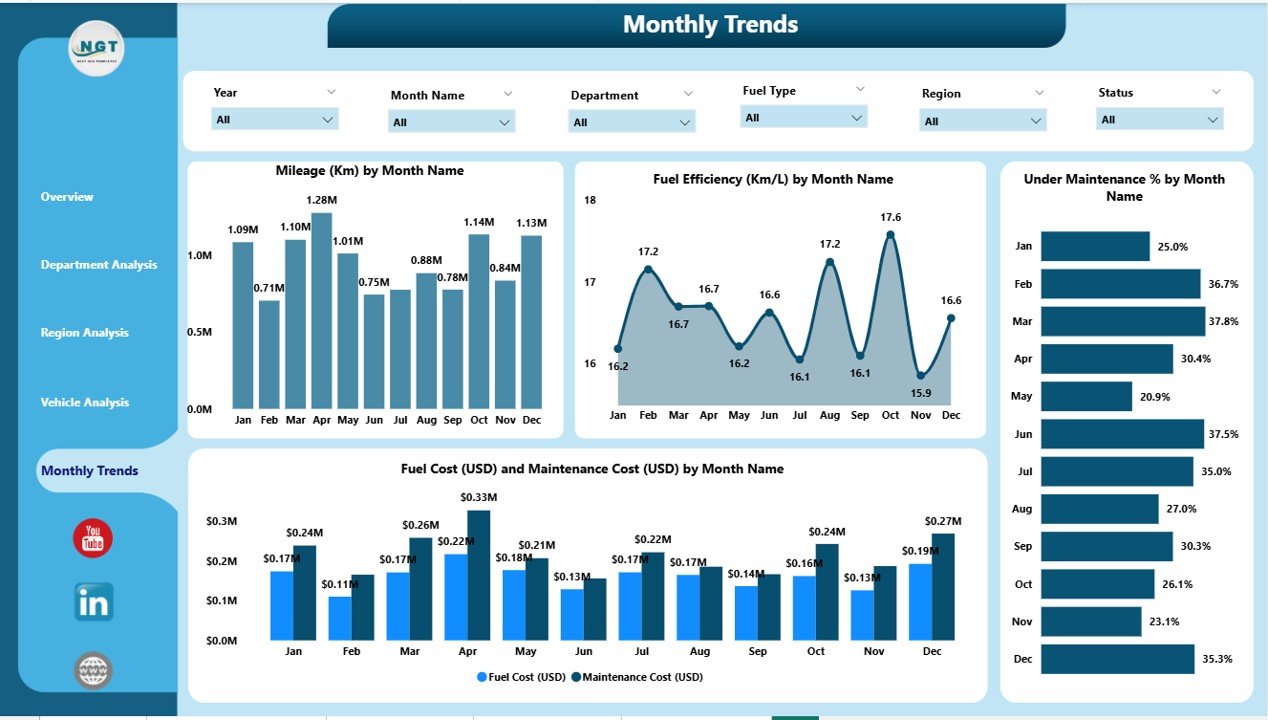
📅 Monthly Trends Page – Monitor Performance Over Time
Discover patterns, seasonality, and cost fluctuations:
-
Mileage (Km) by Month
-
Fuel Efficiency (Km/L) by Month
-
Under Maintenance % by Month
-
Fuel & Maintenance Cost (USD) by Month
Ideal for monthly reviews and forecasting sessions.
📊 What’s Inside the Automotive Dashboard in Power BI
1️⃣ Overview Page: A real-time snapshot of KPIs and costs.
2️⃣ Department Analysis Page: Budget and performance insights by department.
3️⃣ Region Analysis Page: Compare metrics across geographies.
4️⃣ Vehicle Analysis Page: Assess utilization and cost per vehicle type.
5️⃣ Monthly Trends Page: Visualize long-term trends for smarter forecasting.
Each page uses slicers, DAX formulas, and modern visuals—ensuring accuracy and interactivity.
🧭 How to Use the Automotive Dashboard in Power BI
✅ Step 1: Connect your Excel or SQL data source (mileage, fuel, maintenance, etc.).
✅ Step 2: Open the .pbix file in Power BI Desktop.
✅ Step 3: Refresh your data to see updated results instantly.
✅ Step 4: Use slicers to filter by Department, Region, or Vehicle Type.
✅ Step 5: Analyze visuals, KPIs, and trends to make data-backed decisions.
In minutes, you’ll have a live, interactive performance dashboard ready to present to management.
👥 Who Can Benefit from This Dashboard
🚛 Fleet Managers: Monitor vehicle usage, downtime, and fuel consumption.
🏭 Logistics Companies: Track operational costs and optimize routes.
🏢 Corporate Travel Teams: Manage internal fleet performance.
🏗️ Automotive Manufacturers: Analyze model-level performance and maintenance costs.
🏢 Government Transport Departments: Ensure compliance and budget control.
🌟 Advantages of the Automotive Dashboard in Power BI
✅ Centralized Vehicle Data: Bring all performance metrics into one dashboard.
✅ Real-Time Visibility: Track costs and performance as data updates automatically.
✅ Predictive Maintenance: Use trends to prevent breakdowns before they occur.
✅ Enhanced Cost Control: Identify high-cost regions or vehicles and act fast.
✅ Operational Transparency: Compare departments and regions with complete accountability.
✅ Scalable Design: Handle small or large fleets effortlessly.
✅ Automation: Schedule refreshes to eliminate manual reporting.
🔗 Click here to read the Detailed Blog Post
🎥 Visit our YouTube channel for step-by-step tutorials
🔗 YouTube.com/@PKAnExcelExpert


Reviews
There are no reviews yet.