


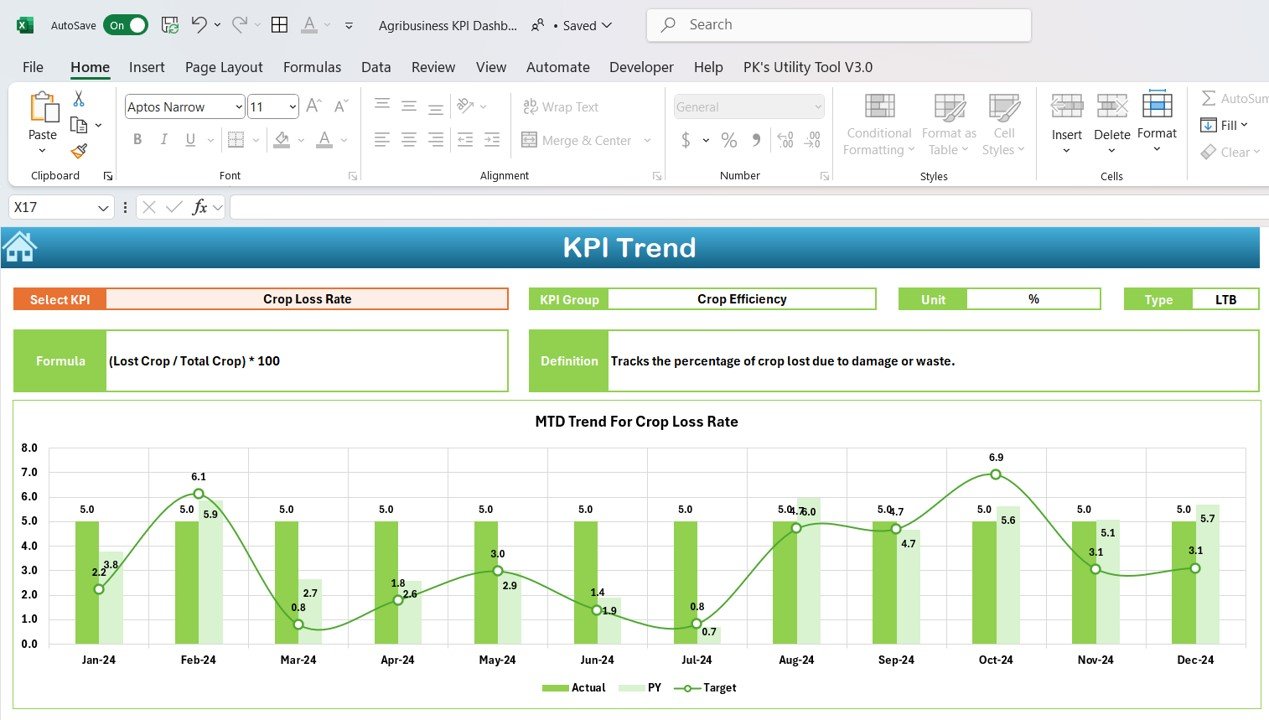


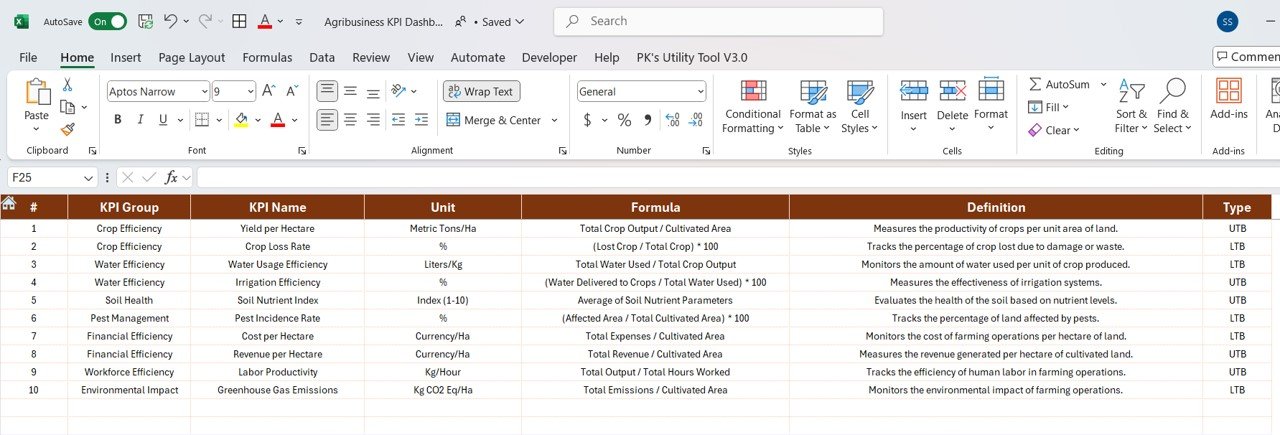

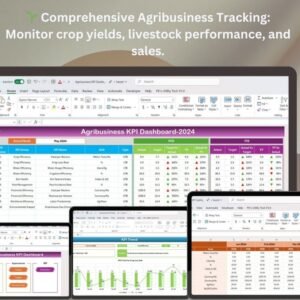
The Agribusiness KPI Dashboard in Excel is a comprehensive and customizable tool designed for agribusiness owners, managers, and stakeholders in the agriculture industry. This dashboard helps track, monitor, and analyze key performance indicators (KPIs) related to crop production, inventory management, supply chain performance, financial health, and resource utilization. By centralizing data and offering real-time insights, this Excel-based dashboard enables informed decision-making and helps optimize agribusiness operations for improved productivity and profitability.
Whether you’re managing crop cycles, monitoring sales performance, or tracking inventory and labor costs, the Agribusiness KPI Dashboard in Excel provides a holistic view of your operations. With the ability to track farm performance and analyze growth trends, this tool is essential for streamlining processes and achieving long-term success in the agribusiness sector.
Key Features of the Agribusiness KPI Dashboard in Excel
🌱 Comprehensive Agribusiness Performance Tracking
Track a wide range of KPIs including crop yields, inventory levels, sales performance, and resource usage. Get an overview of your farm’s operational efficiency and financial health.
⚡ Real-Time Monitoring of Key Metrics
Monitor real-time data on crop performance, sales, expenses, and labor productivity. Stay ahead of potential issues and make timely adjustments to ensure optimum business performance.
📈 Financial & Operational Insights
Analyze financial metrics such as revenue, operating costs, and profits to assess the overall financial health of your agribusiness. Track labor costs and input expenses to manage your budget effectively.
📅 Customizable KPIs for Agribusiness Operations
Easily adjust the dashboard to track KPIs specific to your agribusiness, whether it’s crop yield per acre, livestock production, sales by region, or inventory turnover rates.
🖥️ Interactive & User-Friendly Interface
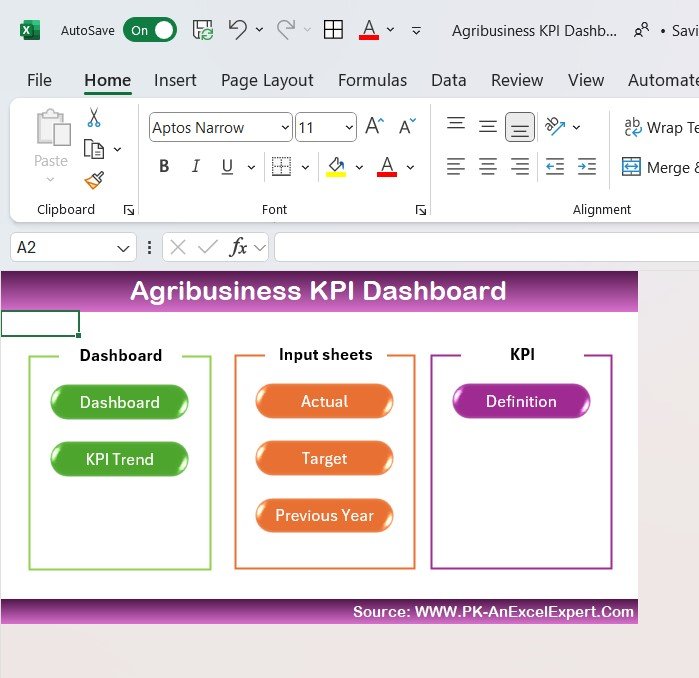
The Excel dashboard is designed with simplicity in mind, offering interactive charts, filters, and slicers that make it easy to explore data and track performance across multiple agribusiness metrics.
Why You’ll Love the Agribusiness KPI Dashboard in Excel
✅ Track Crop & Livestock Performance
Monitor key metrics such as crop yield per acre, livestock growth rates, and harvest performance, ensuring that your farm operates efficiently and meets production targets.
✅ Optimize Financial Management
Track revenue, expenses, and profit margins to keep your agribusiness on solid financial footing. Monitor key financial indicators to ensure that you’re staying within budget and achieving profitability.
✅ Enhance Inventory Management
Track inventory levels of raw materials finished products, and equipment to ensure that resources are allocated efficiently, reducing waste and improving resource utilization.
✅ Streamline Supply Chain Operations
Monitor and track supply chain performance, including logistics, shipping times, and vendor reliability, to ensure that your farm’s operations run smoothly and that products reach the market on time.
✅ Make Data-Driven Agribusiness Decisions
Leverage insights from real-time data to make informed decisions about crop cycles, sales strategies, resource allocation, and operational improvements to increase profitability and sustainability.
What’s Inside the Agribusiness KPI Dashboard Template?
- Crop & Livestock Tracking: Monitor crop yields, livestock performance, and harvest progress.
- Sales & Revenue Analysis: Track sales performance, revenue generation, and profit margins.
- Inventory & Resource Management: Monitor inventory levels, raw material usage, and resource allocation.
- Financial Health Monitoring: Track operating costs, revenues, profits, and budget adherence.
- Customizable KPIs: Adjust the dashboard to track agribusiness-specific metrics, such as labor costs, input expenses, or regional sales performance.
- Interactive Reporting: Use dynamic charts and filters to gain deeper insights into agribusiness operations and make data-driven decisions.
How to Use the Agribusiness KPI Dashboard in Excel
1️⃣ Download the Template: Instantly access your Agribusiness KPI Dashboard in Excel.
2️⃣ Enter Agribusiness Data: Input data such as crop yields, inventory levels, labor costs, and revenue figures.
3️⃣ Track & Monitor KPIs: Use the dashboard to monitor real-time performance and financial health across all aspects of your agribusiness operations.
4️⃣ Analyze & Optimize: Leverage insights to optimize production, improve resource allocation, and make informed financial decisions.
Who Can Benefit from the Agribusiness KPI Dashboard in Excel?
🔹 Agribusiness Owners & Managers
🔹 Farm & Livestock Managers
🔹 Supply Chain & Inventory Managers
🔹 Agricultural Consultants & Analysts
🔹 Sales & Marketing Teams in Agribusiness
🔹 Anyone Involved in Managing Agricultural Operations
Track, analyze, and optimize your agribusiness performance with the Agribusiness KPI Dashboard in Excel. Monitor crop yields, financial health, resource allocation, and inventory management to ensure success in your agribusiness operations.
Click here to read the Detailed blog post
Visit our YouTube channel to learn step-by-step video tutorials
Youtube.com/@PKAnExcelExpert






















Reviews
There are no reviews yet.