

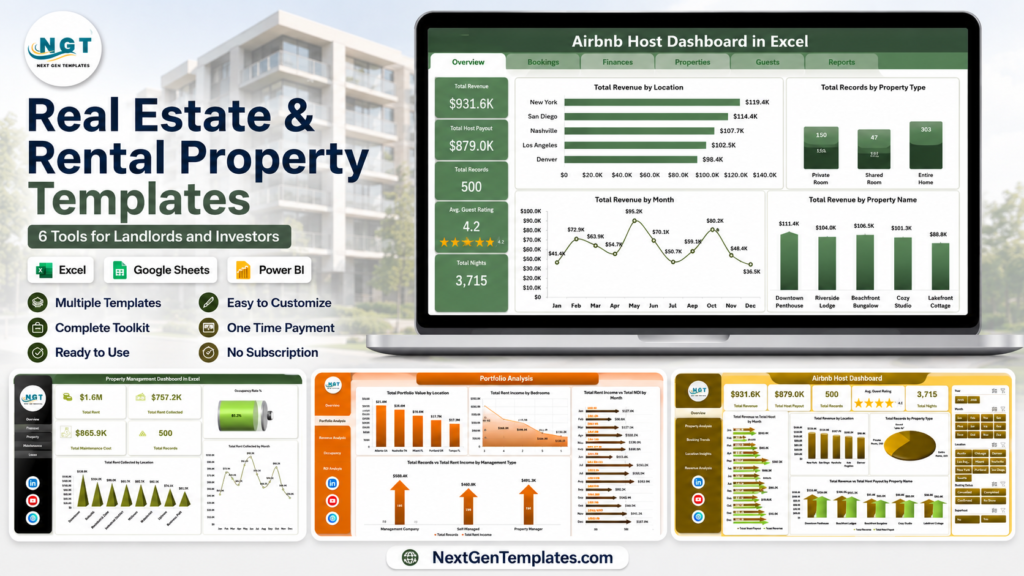
Real estate and rental property templates help landlords and investors see rent, occupancy, maintenance, ROI, guest ratings, and portfolio performance without paying for a full property management platform. That matters because the U.S. rental vacancy rate was 7.3% in Q1 2026, so vacancy control matters. For short-term rentals, competition is also data-heavy: AirDNA tracks 10M+ Airbnb and Vrbo rentals across 120K markets, which shows why hosts need cleaner booking and revenue reporting.
This guide compares six paid NextGenTemplates tools for landlords, Airbnb hosts, property managers, and real estate investors. The short answer: use the Property Management Dashboard in Excel for rent and maintenance operations, the Airbnb Host dashboards for short-term rental performance, the Rental Property Investment Dashboard in Excel for ROI and NOI tracking, and the Real Estate Property Tracker in Google Sheets when you want shared portfolio tracking with a built-in investment calculator.
Key Features of These Real Estate and Rental Property Templates
The best real estate rental property templates do more than store rows of property data. They turn recurring landlord questions into ready-made dashboards: which units are vacant, which tenants are behind, which locations have high maintenance spend, which short-term rental channels produce the most revenue, and which properties are worth holding or improving.
- Portfolio KPIs: rent collected, maintenance spend, occupancy rate, total revenue, guest rating, NOI, ROI, portfolio value, and total records.
- Interactive filtering: slicers and dropdowns for property type, location, payment status, booking source, property name, month, year, and occupancy status.
- Platform choice: Excel for offline spreadsheet control, Google Sheets for browser-based collaboration, and Power BI for interactive analytics and larger reporting workflows.
- Ready-to-use structure: sample data, input sheets, support sheets, visual pages, and search pages so users can start by replacing sample records.
 Launch offer
SUMIFS, XLOOKUP, FILTER, LAMBDA and checking AI-written formulas, with real business projects. 11h 47m of video by PK, with practice files, quizzes and a capstone.
Dashboard Pages and Tracker Workflows Explained
Across the six templates, the common workflow is simple: enter or replace sample data, refresh or let formulas update, then review KPI cards and charts. Excel versions use pivot-powered pages and Refresh All. Google Sheets versions use browser-based sheets, formulas, slicers, and shareable links. Power BI versions use .pbix reports with slicers, DAX-style measures, and report pages built for deeper visual exploration. Microsoft documents the broader Power BI workflow in its Power BI documentation, while Google highlights the collaboration strength of Sheets through real-time editing.
Real Estate Templates vs Spreadsheet Alternatives vs Paid Property Management SaaS – Feature Comparison
| Feature | These templates | Manual spreadsheet alternative | Paid property management SaaS |
|---|---|---|---|
| Cost | One-time template purchase | Free, but time-heavy | Recurring monthly fee |
| Platform | Excel, Google Sheets, or Power BI | Usually Excel or Sheets | Vendor cloud platform |
| Setup time | Minutes after download | Hours to design properly | Days or weeks for onboarding |
| Real-time team collaboration | Best in Google Sheets, possible with shared Excel files | Depends on file sharing setup | Usually included, often per user |
| Mobile access | Strongest in Google Sheets and browser-based workflows | Limited unless designed for mobile | Usually included |
| Customizable fields | Editable spreadsheet or report structure | Fully editable but manual | Controlled by vendor settings |
| Share with link | Easy in Google Sheets and web-based files | Possible, but messy with versions | Usually requires user access |
| Year-1 cost at 5 users | Usually under the price of one SaaS month | Low cash cost, high build time | Often hundreds or thousands per year |
| Investor analysis | ROI, NOI, portfolio value, income vs expenses | Must be built from scratch | May require higher-tier plan |
| Short-term rental tracking | Revenue, bookings, guest ratings, channels, nights | Manual formulas and charts | Often platform-specific |
Who Should Use This Template Collection
Use these templates if you manage residential rentals, commercial units, Airbnb-style listings, vacation rentals, or a small real estate investment portfolio and want fast reporting without committing to a subscription. They are especially useful for independent landlords, property managers, real estate analysts, Airbnb hosts, hospitality consultants, and investors who already keep operational data in spreadsheets.
They are not a full replacement for tenant portals, rent payment processing, automated screening, accounting integrations, or compliance workflows. If those are mission-critical, a SaaS property management platform may still be the right system of record. These templates are best for the reporting layer: analysis, comparison, monitoring, and owner-ready summaries.
Run a sales office rather than a rental portfolio? Our roundup of the 8 best real estate brokerage templates, from agent dashboards to a real estate dashboard for listings covers commission, leads and open houses.
Real-World Use Cases
A landlord with 12 long-term rentals can use a property management dashboard to track rent collected, maintenance cost, payment status, and occupancy each month. Instead of reviewing separate tenant notes, bank exports, and repair logs, the landlord can update one data sheet and review the dashboard.
An Airbnb host with multiple listings can use the Airbnb Host Dashboard in Excel, Google Sheets, or Power BI to compare revenue by property, guest rating by location, booking channel, nightly rate, and nights stayed. This helps hosts identify where pricing, cleaning, or listing quality needs attention.
A real estate investor comparing deals can use the rental investment and property tracker templates to evaluate ROI, NOI, portfolio value, monthly rental income, operating expenses, vacancy reserve, and maintenance trends before deciding where to reinvest.
Advantages of Using Ready-Made Rental Property Templates
The biggest advantage is speed. A landlord can avoid rebuilding dashboards from scratch and focus on entering accurate data. The second advantage is consistency: every monthly review uses the same KPI definitions, charts, and filters. The third advantage is buyer control. With Excel and Google Sheets templates, users are not locked into a software vendor layout, user limits, or reporting assumptions.
Opportunities for Improvement
Templates still depend on clean data entry. If rent payments, maintenance logs, guest ratings, or occupancy status are not updated consistently, the dashboard will not tell the full story. Larger teams may also need role permissions, automated imports, accounting sync, or tenant-facing portals. A good path is to start with these templates for reporting discipline, then graduate to SaaS only when automation and integrations justify the recurring cost.
Best Practices
- Keep one source of truth for property IDs, tenant names, locations, and booking channels.
- Update rent, occupancy, maintenance, and booking data on a fixed weekly or monthly schedule.
- Review both revenue and expense metrics so high rent does not hide high repair cost.
- For Airbnb dashboards, compare revenue with guest rating and nights booked, not revenue alone.
- For investment dashboards, track NOI, ROI, vacancy days, and property appreciation together.
Explore Relevant Templates
Before you buy, make sure you are tracking the right numbers — our guide to the 12 real estate KPIs (occupancy, NOI) to track in 2026 gives the formula and benchmark for each metric these templates calculate.
1. Property Management Dashboard in Excel
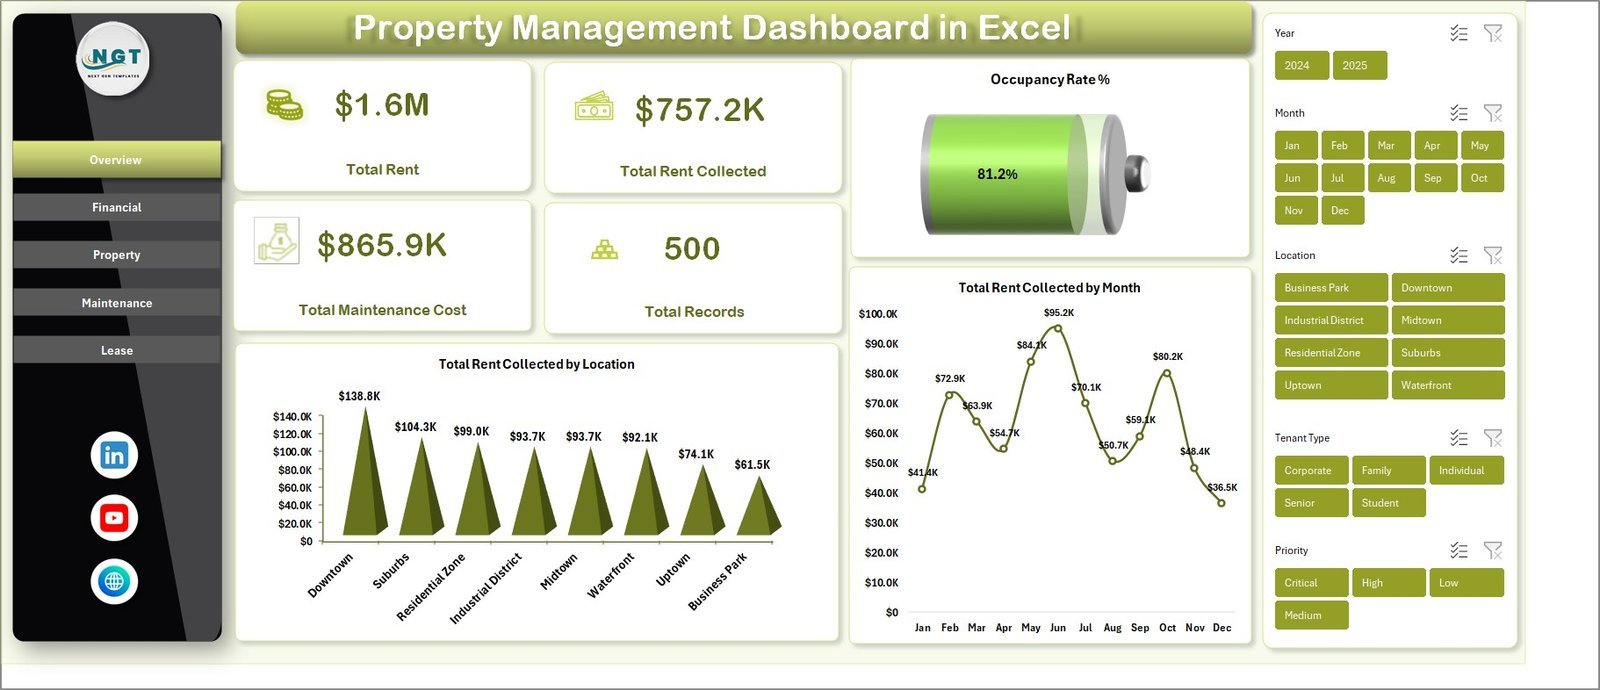
Property Management Dashboard in Excel – Overview Page
Property Management Dashboard in Excel is the strongest starting point for landlords and property managers who want rent collection, occupancy, maintenance, lease, and tenant satisfaction analysis in Microsoft Excel. It includes 5 interactive dashboard pages plus data and support sheets, with KPI cards for Total Rent, Total Rent Collected, Total Maintenance Cost, and Total Records.
View Property Management Dashboard in Excel
2. Airbnb Host Dashboard in Google Sheets
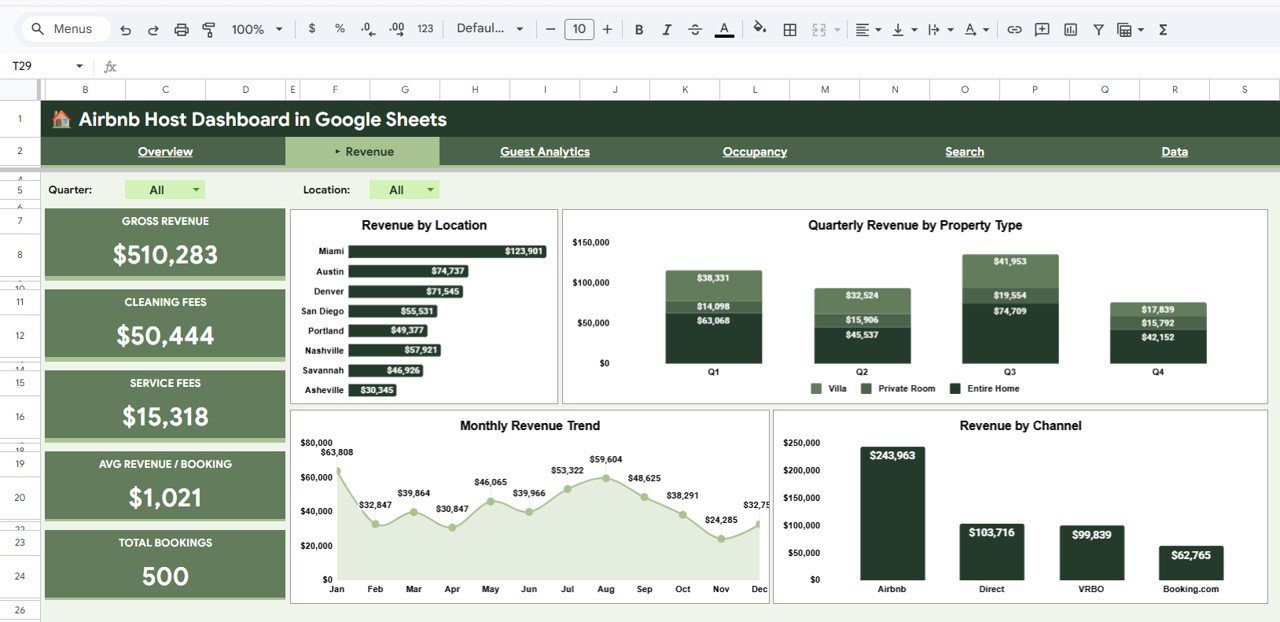
Airbnb Host Dashboard in Google Sheets – Revenue Page
Airbnb Host Dashboard in Google Sheets is ideal for hosts who want cloud access and shared editing. It tracks Total Bookings, Total Revenue, Avg Nightly Rate, Avg Nights Stayed, and Avg Guest Rating across overview, revenue, guest analytics, occupancy, booking search, and data sheets.
View Airbnb Host Dashboard in Google Sheets
3. Airbnb Host Dashboard in Power BI
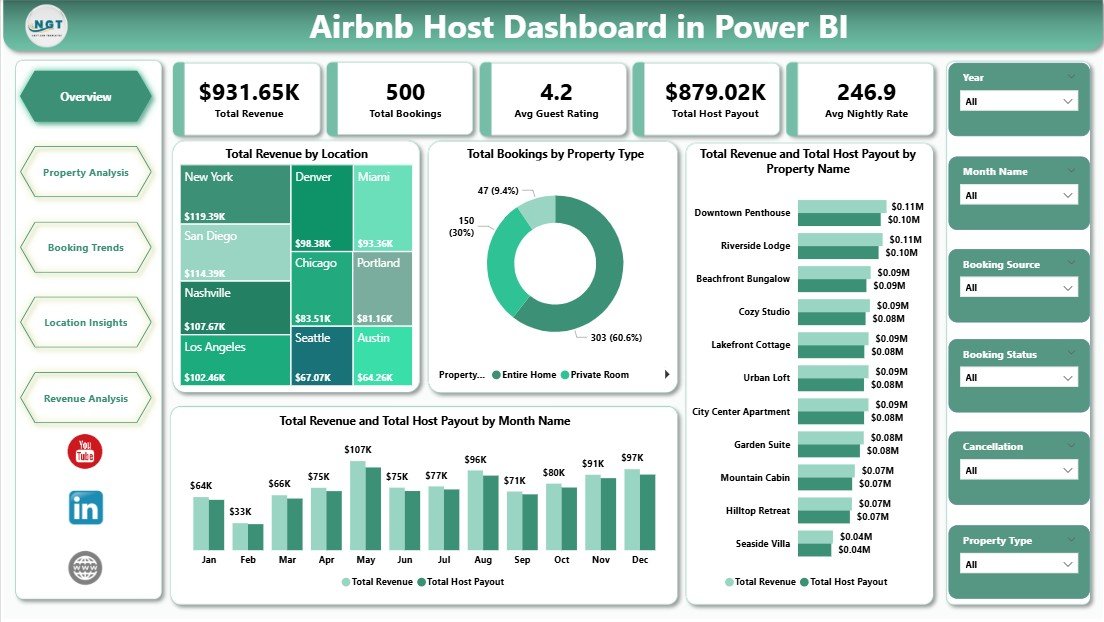
Airbnb Host Dashboard in Power BI – Overview Page
Airbnb Host Dashboard in Power BI is best for hosts and analysts who want interactive Power BI visuals. It includes 5 report pages for overview, property analysis, booking trends, location insights, and revenue analysis, with slicers for property type, location, booking source, year, month, and booking status.
View Airbnb Host Dashboard in Power BI
4. Airbnb Host Dashboard in Excel
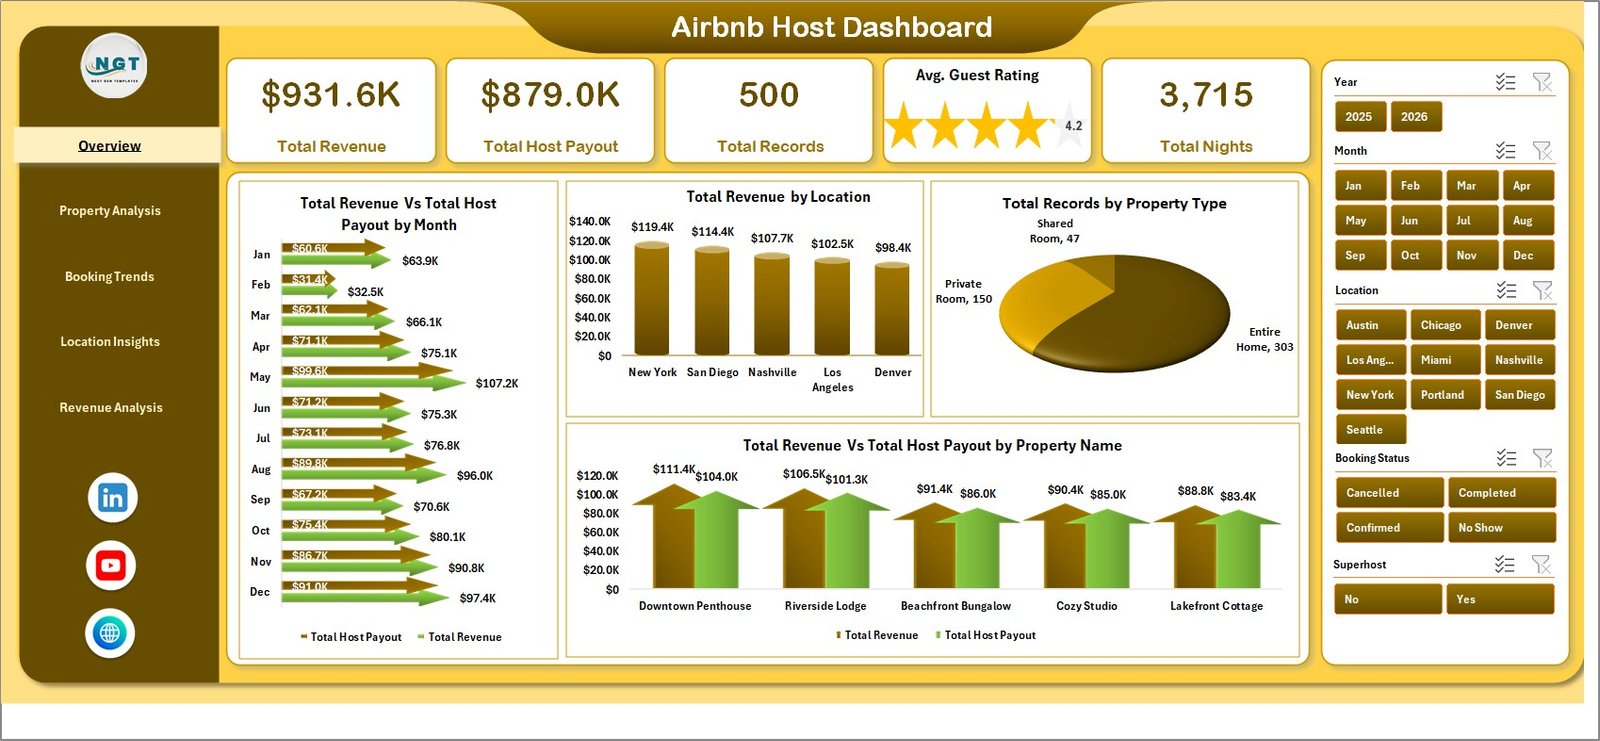
Airbnb Host Dashboard in Excel – Overview Page
Airbnb Host Dashboard in Excel is the best choice for hosts who prefer offline Excel reporting. It tracks Total Revenue, Total Host Payout, Total Records, Avg Guest Rating, and Total Nights, with pages for property analysis, booking trends, location insights, and revenue analysis.
View Airbnb Host Dashboard in Excel
5. Rental Property Investment Dashboard in Excel
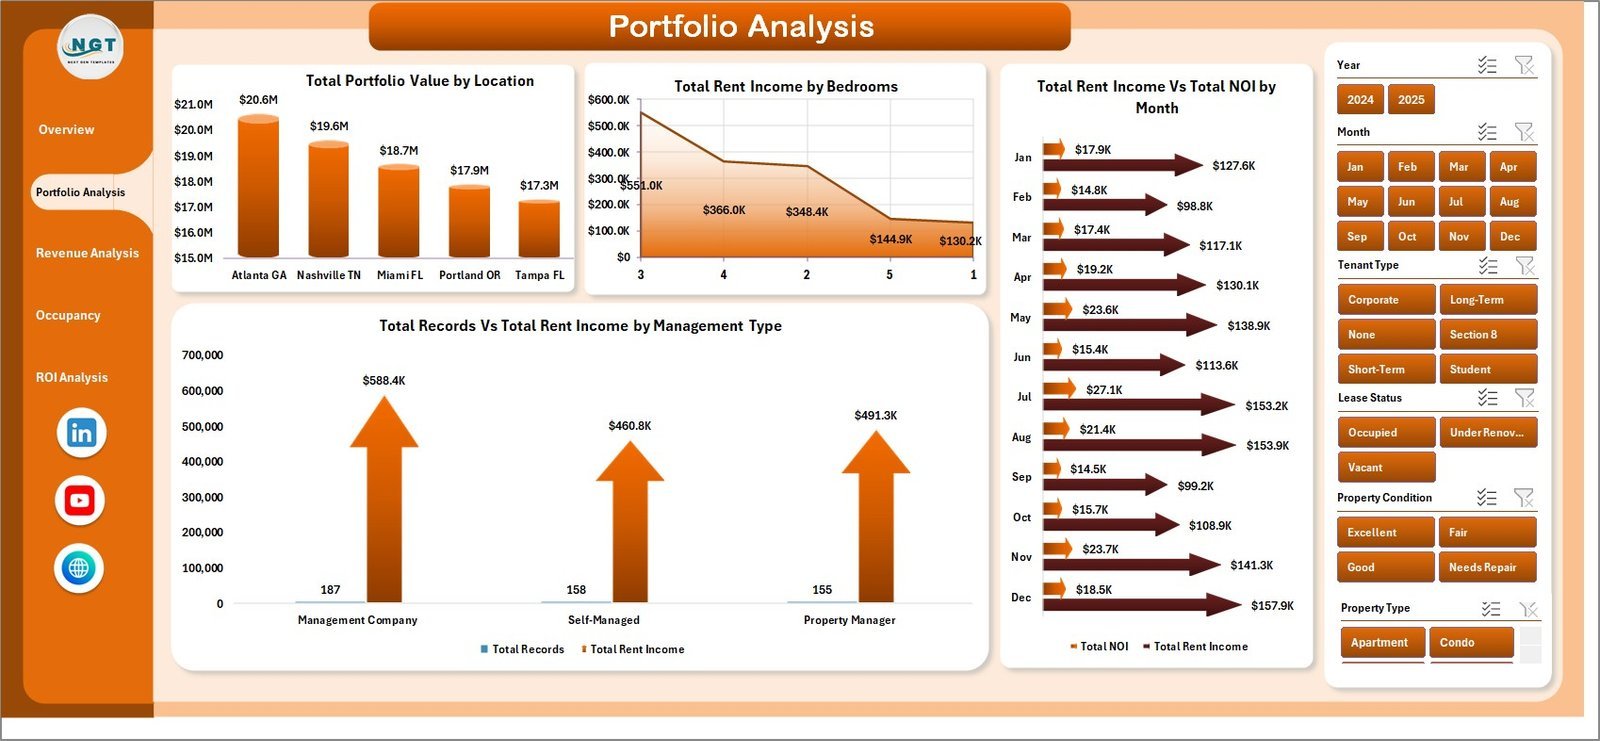
Rental Property Investment Dashboard in Excel – Portfolio Analysis
Rental Property Investment Dashboard in Excel is built for investors who care about rent income, NOI, portfolio value, occupancy, vacancy days, ROI, and appreciation. It includes 5 dashboard pages: Overview, Portfolio Analysis, Revenue Analysis, Occupancy Tracker, and ROI Analysis.
View Rental Property Investment Dashboard in Excel
6. Real Estate Property Tracker in Google Sheets
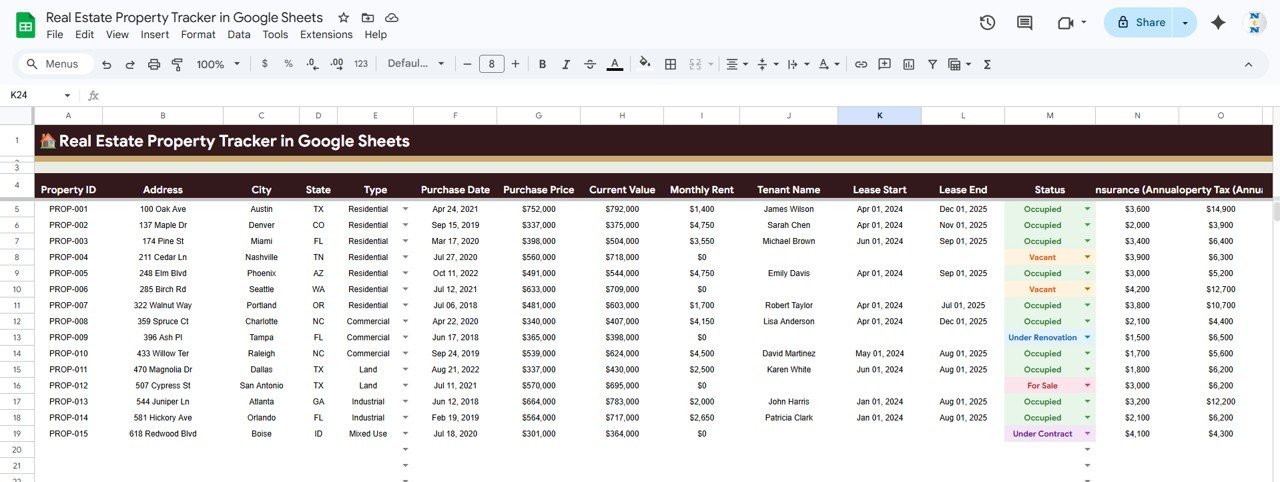
Real Estate Property Tracker in Google Sheets – Properties Tracker
Real Estate Property Tracker in Google Sheets is a practical portfolio tracker for landlords and investors who want shared tracking for properties, tenants, income, expenses, maintenance, and investment calculations. It includes 7 pages, 5 KPI cards, 14+ charts, a property search page, and a built-in investment calculator.
View Real Estate Property Tracker in Google Sheets
Managing larger buildings or commercial space? Our guide to the best facility management templates adds facilities, work order, lease and maintenance dashboards for property managers.
Frequently Asked Questions
What is the best template for landlords who manage long-term rentals?
The Property Management Dashboard in Excel is the best first choice for long-term rental operations because it focuses on rent collection, occupancy, maintenance costs, lease status, tenant satisfaction, and property-level reporting.
Which template is best for Airbnb hosts?
Airbnb hosts should choose based on platform preference. Use the Excel version for offline pivot reporting, the Google Sheets version for cloud collaboration, and the Power BI version for more interactive report pages and visual exploration.
Which template helps real estate investors analyze ROI?
The Rental Property Investment Dashboard in Excel is the best fit for ROI-focused analysis because it tracks rent income, NOI, portfolio value, occupancy, vacancy days, ROI, and property appreciation. The Real Estate Property Tracker in Google Sheets is also useful when you want a built-in investment calculator.
Are these templates a replacement for Buildium, AppFolio, or other property management software?
They can replace the reporting layer for many small landlords and investors, but they are not full tenant portals or rent payment systems. Use them when you need dashboards and analysis. Use SaaS when you need automated payments, screening, maintenance portals, and accounting integrations.
Can these templates work for both residential and short-term rentals?
Yes, but choose the template around the job. Property management and rental investment templates fit long-term rental portfolios, while the Airbnb Host dashboards fit short-term rental metrics such as bookings, revenue, guest ratings, nightly rate, nights stayed, and booking channel performance.
About the Author
Built by PK – Microsoft Certified Professional with 15+ years of Excel, Google Sheets, and Power BI experience. Founder of NextGenTemplates, reaching 300K+ subscribers across YouTube channels. Every template is hand-built and tested before release.
Conclusion
The right real estate rental property template depends on the decision you need to make. Choose Property Management Dashboard in Excel for day-to-day rental operations, Airbnb Host dashboards for short-term rental performance, Rental Property Investment Dashboard in Excel for ROI and NOI analysis, and Real Estate Property Tracker in Google Sheets for collaborative portfolio tracking. For step-by-step tutorials and more dashboard examples, visit the NextGenTemplates YouTube channel.
Last updated: July 7, 2026.