


The 12 cybersecurity KPIs worth tracking in 2026 are mean time to detect, respond, contain and recover, patching SLA compliance, vulnerability remediation rate, open critical vulnerabilities, phishing click rate, phishing reporting rate, training completion, incident volume and alert false-positive rate. Track them in a ready-made dashboard rather than a hand-built spreadsheet.
Last updated: September 2026
Related guide: For the wider IT operations picture, see our 12 IT KPIs (MTTR, SLA, uptime) to track in 2026.
Key takeaways
- The global mean time to identify a breach is still roughly 200 days according to IBM’s Cost of a Data Breach report, so mean time to detect (MTTD) is the single cybersecurity KPI most worth cutting.
- Every KPI below ships with a formula and a realistic benchmark range, so you can score your own security programme this week rather than guessing.
- All 8 cybersecurity KPI dashboard templates in this guide are one-time purchases between $9.99 and $12.99 — no per-seat GRC subscription, no annual renewal.
- Best overall is the Cybersecurity Risk Assessment KPI Dashboard in Power BI ($11.99); best value is the Cybersecurity Incident KPI Dashboard in Google Sheets ($9.99).
- Coverage spans Excel, Google Sheets and Power BI, each calculating MTD and YTD against target so you can match the tool your security team already uses.
The 8 cybersecurity KPI dashboard templates compared
Every template in this guide, side by side. Each one already calculates the cybersecurity KPIs defined below against monthly and yearly targets. Two rows are flagged: one best overall and one best value.
| Template | Format | Best for | Price |
|---|---|---|---|
| Cybersecurity Risk Assessment KPI Dashboard (Best overall) | Power BI | CISO-grade MTD/YTD scorecard with drill-through KPI definitions | $11.99 |
| Cybersecurity Incident KPI Dashboard (Best value) | Google Sheets | Free-to-run cloud incident tracking | $9.99 |
| Cybersecurity Incident KPI Dashboard | Excel | Offline incident response & severity tracking | $12.99 |
| Cybersecurity Incident KPI Dashboard | Power BI | Interactive incident MTD/YTD trend analysis | $11.99 |
| Cybersecurity Risk Assessment KPI Dashboard | Excel | 7-sheet risk & compliance workbook | $12.99 |
| Cybersecurity KPI Scorecard | Google Sheets | Lightweight traffic-light monthly scorecard | $9.99 |
| Sales & Marketing Cybersecurity KPI Dashboard | Excel | Data-protection metrics for marketing teams | $12.99 |
| Project Management Cybersecurity KPI Dashboard | Excel | Tracking security-project delivery & risk | $12.99 |
How we picked these
We searched the NextGenTemplates catalogue for paid cybersecurity, incident-response and risk-assessment templates in Excel, Google Sheets and Power BI, then filtered to the ones that actually calculate KPIs against a target rather than just listing incidents. We kept templates with a visible KPI Definition sheet — the formula and unit for every metric — because a scorecard you cannot audit is a scorecard nobody trusts. We excluded single-tool SIEM exports, anything without an Actual-vs-Target model, and free files too shallow to run a monthly board report. Every template below is a paid, one-time product with editable formulas, and every one maps onto the 12 cybersecurity KPIs in this guide.
What are the most important cybersecurity KPIs to track?
The most important cybersecurity KPIs measure four things: how fast you find an attack, how fast you shut it down, how exposed you are before it starts, and how well your people behave. The 12 metrics below cover all four. Each has a one-line definition, the exact formula, a realistic benchmark range, and the mistake teams make when they report it. Where you see each one live is the KPI dashboard column — every template in this guide computes these automatically.
| # | Metric | Formula | Benchmark range | Where to see it |
|---|---|---|---|---|
| 1 | Mean Time to Detect (MTTD) | Σ(detection time − compromise time) ÷ incidents | <24 hrs (mature) vs ~200 days industry mean | Incident dashboard, Summary page |
| 2 | Mean Time to Respond (MTTR-Respond) | Σ(response start − detection) ÷ incidents | <1 hr for critical severity | Incident dashboard, Trend page |
| 3 | Mean Time to Contain (MTTC) | Σ(containment − detection) ÷ incidents | Minutes–hours (critical); ~62 days industry mean | Incident dashboard |
| 4 | Mean Time to Recover (MTTR-Recover) | Σ(full resolution − detection) ÷ incidents | <72 hrs for critical incidents | Incident dashboard, Summary page |
| 5 | Patching SLA Compliance Rate | (patches applied within SLA ÷ patches due) × 100 | ≥95% within 30 days; KEV within 15 days | Risk assessment dashboard |
| 6 | Vulnerability Remediation Rate | (vulns remediated within SLA ÷ total vulns) × 100 | Critical <15 days, high <30, medium <90 | Risk assessment dashboard |
| 7 | Open Critical Vulnerabilities | count of critical vulns past their SLA window | Trending to zero; none past SLA | Risk assessment / scorecard |
| 8 | Phishing Simulation Click Rate | (clicks ÷ simulated emails delivered) × 100 | <5% (mature) vs 25–30% untrained | Scorecard, Summary page |
| 9 | Phishing Reporting Rate | (reported emails ÷ simulated emails) × 100 | ≥20% and rising toward 70% | Scorecard |
| 10 | Security Awareness Training Completion | (completed ÷ assigned) × 100 | ≥95% on-time completion | Scorecard / risk dashboard |
| 11 | Number of Security Incidents | count by severity per period | Context-dependent; watch the trend | Incident dashboard, Summary page |
| 12 | Alert False-Positive Rate | (false positives ÷ total alerts) × 100 | <20–30% for a well-tuned SOC | Incident dashboard, Trend page |
1. Mean Time to Detect (MTTD)
Definition: the average time between an attacker compromising your environment and your team detecting it. Formula: sum of (detection time − compromise time) across incidents, divided by the number of incidents. Benchmark: a mature SOC targets under 24 hours, yet IBM’s Cost of a Data Breach report still puts the global mean time to identify a breach near 200 days. The mistake teams make: measuring MTTD from the first alert instead of from the actual compromise, which hides dwell time — the days or months an attacker sat undetected before any alert fired.
2. Mean Time to Respond (MTTR-Respond)
Definition: the average time from detection to the first real response action. Formula: sum of (response start − detection time) ÷ incidents. Benchmark: for critical-severity incidents, aim for under one hour; a runbook and on-call rotation are what make that achievable. The mistake: conflating “responded” with “resolved”. Acknowledging an alert is not the same as containing the threat, and blending the two makes the number look better than your security posture actually is.
3. Mean Time to Contain (MTTC)
Definition: the average time to isolate an incident so it can spread no further — quarantining a host, disabling an account, blocking an IP. Formula: sum of (containment time − detection time) ÷ incidents. Benchmark: minutes to hours for critical incidents; the industry mean to contain still runs to roughly two months. The mistake: reporting a single “resolution” number and never separating containment from full recovery — containment stops the bleeding, recovery rebuilds, and a board wants to see both.
4. Mean Time to Recover (MTTR-Recover)
Definition: the average time from detection to full remediation, when systems are clean and back in normal service. Formula: sum of (full resolution time − detection time) ÷ incidents. Benchmark: under 72 hours for critical incidents is a strong target; complex breaches legitimately run longer. The mistake: closing tickets the moment service is restored, before eradication is confirmed — which is how the same attacker walks back in through the same hole a fortnight later.
5. Patching SLA Compliance Rate
Definition: the percentage of due patches applied inside your defined SLA window. Formula: (patches applied within SLA ÷ total patches due) × 100. Benchmark: at least 95% within 30 days for critical patches; for anything on the CISA Known Exploited Vulnerabilities catalog, treat 15 days as the ceiling. The mistake: counting a patch as “applied” when it was pushed but the host never rebooted, so the fix is not actually live.
6. Vulnerability Remediation Rate
Definition: the percentage of discovered vulnerabilities remediated within their severity-based SLA. Formula: (vulnerabilities remediated within SLA ÷ total vulnerabilities) × 100. Benchmark: critical inside 15 days, high inside 30, medium inside 90. The mistake: reporting scan coverage (“we scanned 100% of assets”) as if it were remediation — finding a vulnerability and fixing it are different jobs, and only the second one reduces risk.
7. Open Critical Vulnerabilities
Definition: the count of critical-severity vulnerabilities still open past their remediation SLA. Formula: a running count of critical vulnerabilities beyond their due date. Benchmark: trend toward zero; none should sit past SLA for long. The mistake: reporting a raw vulnerability count with no severity or asset context, so a critical flaw on an internet-facing server reads the same as a low-risk one on an isolated test box.
8. Phishing Simulation Click Rate
Definition: the percentage of staff who click a link in a simulated phishing test. Formula: (clicks ÷ simulated emails delivered) × 100. Benchmark: untrained baselines commonly sit at 25–30%; a sustained programme drives this under 5%. The mistake: chasing the click rate in isolation while ignoring whether people actually report the suspicious email — a low click rate with zero reporting is a false comfort.
9. Phishing Reporting Rate
Definition: the percentage of a phishing simulation that recipients reported to security. Formula: (reported emails ÷ simulated emails delivered) × 100. Benchmark: above 20% is a healthy start; mature programmes push toward 70%. The mistake: not tracking it at all — reporting rate is the metric that turns your workforce into a distributed detection sensor, and it is the leading indicator that click rate is about to fall.
10. Security Awareness Training Completion
Definition: the percentage of assigned staff who complete required security training on time. Formula: (completed ÷ assigned) × 100. Benchmark: 95% or higher on-time completion. The mistake: treating completion as the outcome. Finishing a module is an input; the real outcome is a falling click rate and a rising reporting rate, so pair this KPI with numbers 8 and 9.
11. Number of Security Incidents
Definition: the count of confirmed security incidents in a period, broken out by severity. Formula: a simple count per period, segmented by severity band. Benchmark: highly context-dependent — what matters is the trend and the severity mix, not an absolute target. The mistake: celebrating a drop in incident volume as unqualified good news, when a falling count can just as easily mean your detection got worse, not your defences better.
12. Alert False-Positive Rate
Definition: the share of security alerts that turn out to be benign. Formula: (false positives ÷ total alerts) × 100. Benchmark: under 20–30% for a well-tuned SOC; anything higher and analysts start ignoring the console. The mistake: tuning so aggressively to kill false positives that you introduce false negatives — silencing the very alert that would have caught the real intrusion.
Which cybersecurity KPI dashboard should you buy?
Knowing the 12 cybersecurity KPIs is half the job; the other half is a place to calculate and report them every month. Each template below already models these metrics with an Actual-vs-Target input, MTD and YTD comparison, and a KPI Definition sheet that stores the formula and unit for every metric — so your numbers stay consistent from one board pack to the next. They are ranked from the most complete to the most specialised.
1. Cybersecurity Risk Assessment KPI Dashboard in Power BI — best overall
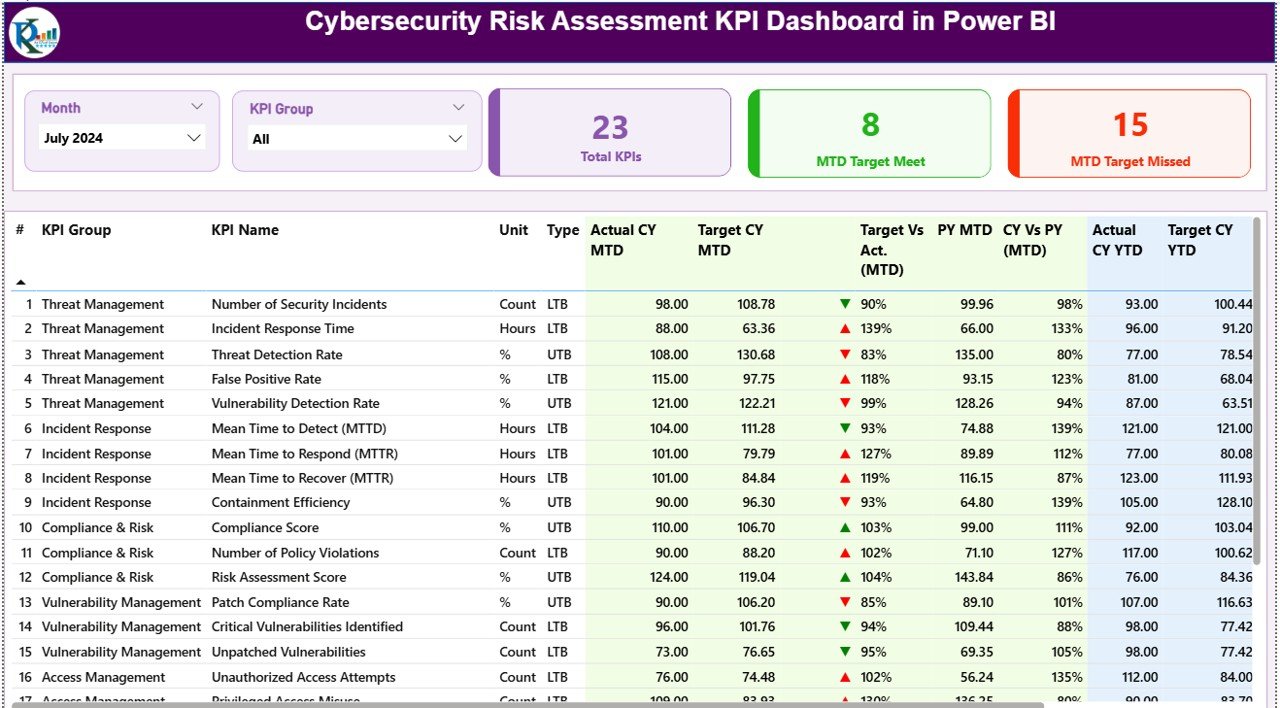
This is the closest thing to a CISO-grade scorecard without a GRC subscription. It tracks the exact metrics in this guide — vulnerability remediation rate, MTTD, MTTR, patching SLA compliance, phishing click-through and training completion — across a Summary, Trend and drill-through KPI Definition page.
Who it is for: a security manager or vCISO who reports monthly cyber-risk KPIs to an audit committee and wants interactive slicers, not a static PDF.
What is inside:
- Summary page with three cards — total KPIs, MTD target met, MTD target missed — and a full KPI table
- Actual CY vs Target CY for both MTD and YTD, plus prior-year (PY) comparison columns
- Red ▼ / green ▲ status icons with automatic LTB / UTB logic per KPI
- Hidden drill-through KPI Definition page: right-click any KPI to see its formula and unit
- Excel-driven data source — fill three tabs, click Refresh, no DAX editing
Setup runs under 10 minutes: replace the sample data in three Excel tabs and every visual updates. A team preparing for SOC 2, ISO 27001 or NIST CSF gets a defensible month-over-month trend line for a one-time $11.99, versus $8,000–$80,000 a year for GRC SaaS. It pairs naturally with our IT KPI dashboard covering MTTR, SLA and uptime when security and operations report side by side.
Best for: the most complete cybersecurity KPI scorecard. $11.99 — view the template.
2. Cybersecurity Incident KPI Dashboard in Google Sheets — best value
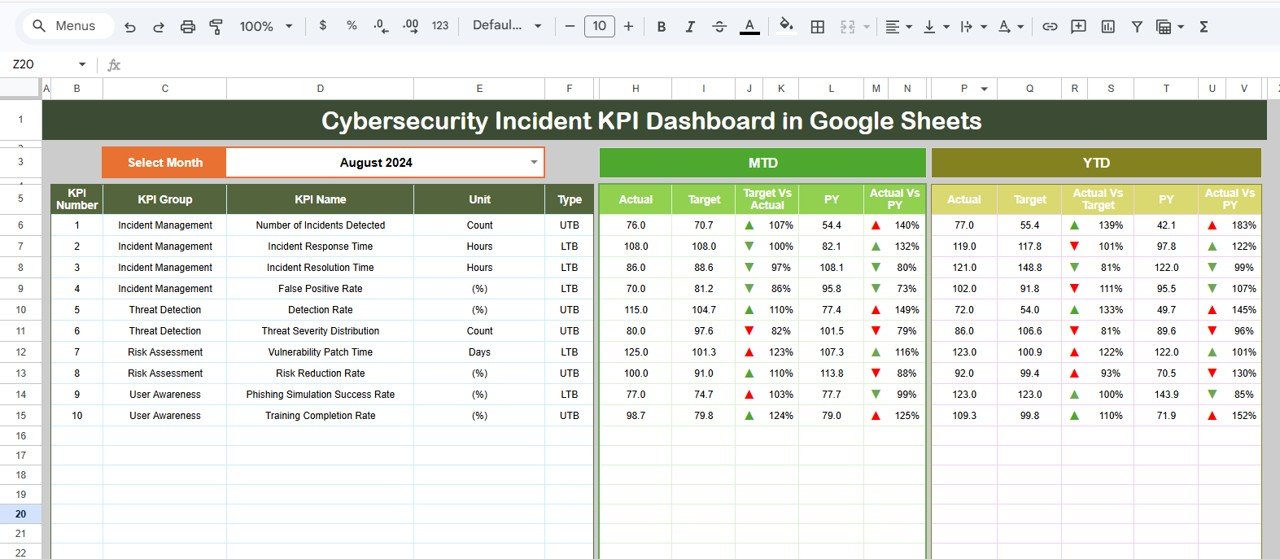
The lowest-friction way to start tracking incident cybersecurity KPIs. It reproduces the full incident scorecard — detection, response, resolution and trend — in Google Sheets, so the whole security team edits one live copy with no software to install.
Who it is for: a distributed or cloud-first security team that wants a shared, live scorecard link without paying for either Power BI Pro or a GRC platform.
What is inside:
- Dashboard sheet with a month dropdown that updates every KPI at once
- MTD and YTD tracking with actual-vs-target and prior-year comparison
- Green-up / red-down trend arrows on every metric
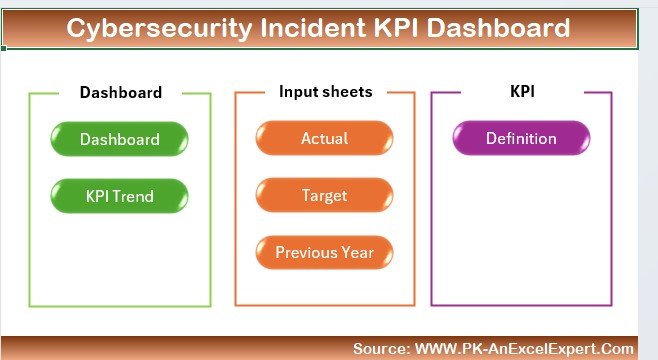
- KPI Trend sheet and a documented KPI Definition sheet
At $9.99 once it is the cheapest full incident scorecard here and the fastest to roll out — share the link, done. Give analysts edit access and managers view-only. A good companion to our customer service KPI dashboards when a SOC and a support desk share a workspace.
Best for: cloud teams and the tightest budgets. $9.99 — view the template.
3. Cybersecurity Incident KPI Dashboard in Excel
The offline workhorse for incident tracking. It classifies incidents by severity, monitors response and resolution time, and runs the frequency and trend analysis that tells you whether the same threat keeps recurring — all in a single Excel file.
Who it is for: IT security teams and SOCs that live in Excel and want incident KPIs without a cloud dependency.
What is inside:
- Incident tracking with severity classification and resolution status
- Response-time monitoring from detection to resolution
- Incident frequency and trend analysis to surface recurring threats
- Customisable KPIs so you can add your own metrics and reporting periods
It is the most-purchased template in this guide for a reason: it is the fastest offline route to MTTD, MTTR and severity reporting. Use it for a weekly SOC review or a monthly incident report. Teams tracking delivery risk alongside it often add our project management KPI dashboard covering CPI, SPI and EVM.
Best for: offline incident response and severity tracking. $12.99 — view the template.
4. Cybersecurity Incident KPI Dashboard in Power BI
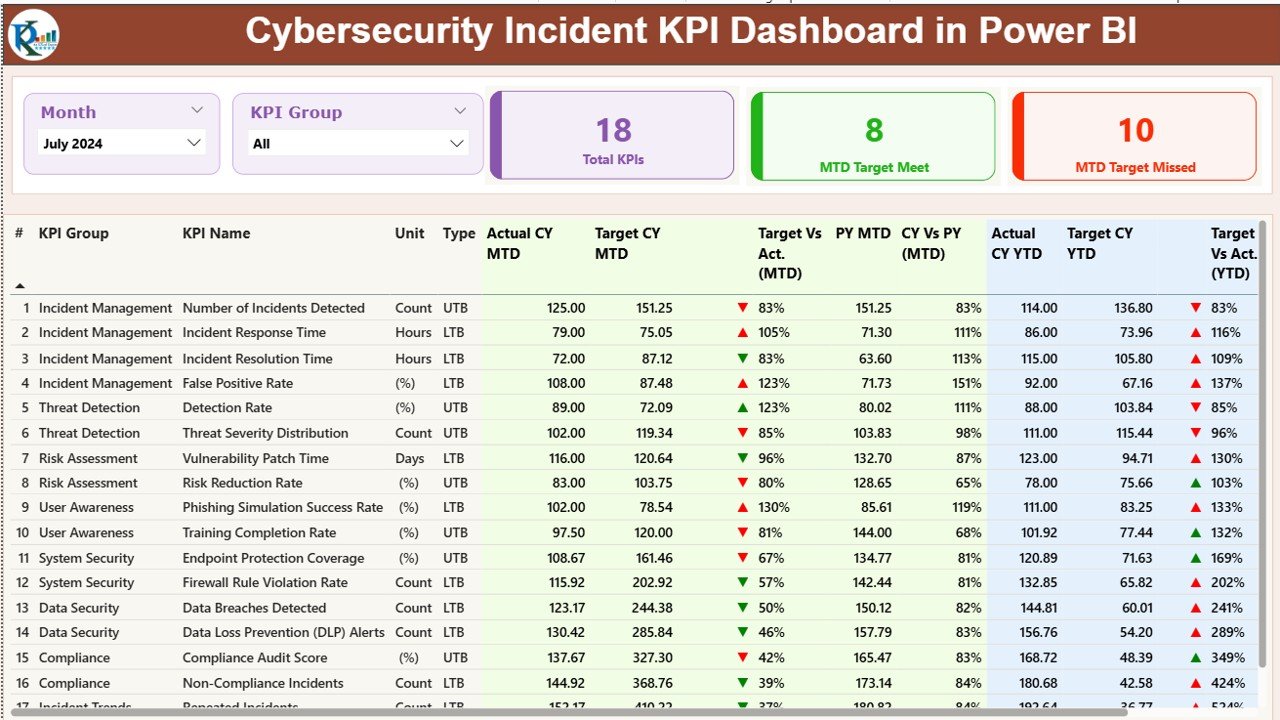
The interactive version of the incident scorecard. Where the Excel file is perfect offline, this Power BI report turns incident KPIs into a filterable, drillable model with Month and KPI-Group slicers and combo charts for MTD and YTD.
Who it is for: SOC managers and CISOs who want to slice incident performance by month and KPI group and drill through to any metric’s definition.
What is inside:
- Summary page with total-KPI, MTD-met and MTD-missed cards
- KPI Trend page: current year vs previous year vs target for MTD and YTD
- Drill-through KPI Definition page reached by right-clicking any KPI
- Excel-based data source and a one-click Power BI refresh
Load a monthly export, refresh, and every stakeholder can explore it without a per-seat charge inside your organisation. It is a strong fit if you already publish to the Power BI Service. Explore the wider library of KPI dashboards by function if other teams want the same treatment.
Best for: interactive incident MTD/YTD trend analysis. $11.99 — view the template.
5. Cybersecurity Risk Assessment KPI Dashboard in Excel
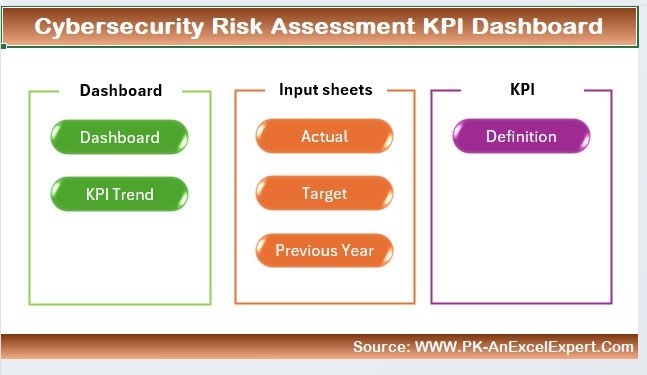
A seven-sheet risk and compliance workbook for teams that want the full Actual / Target / Previous-Year model in Excel. It tracks security incidents, response times, compliance scores and risk assessment with conditional-formatting indicators and a month selector.
Who it is for: CISOs, IT risk managers and compliance officers who need a defensible, offline cybersecurity scorecard with a documented KPI methodology.
What is inside:
- Home sheet with quick-access navigation to every module
- Automated KPI dashboard with MTD/YTD and green/red conditional formatting
- Separate input sheets for Actuals, Targets and Previous-Year numbers
- KPI Trend sheet and a full KPI Definition sheet with formulas and units
It is the deepest Excel option here, built for benchmarking current security performance against both target and last year. Use it when an auditor wants to see the methodology, not just the headline. It sits well beside our procurement KPI dashboards when third-party and supply-chain risk is in scope.
Best for: a deep, offline risk-and-compliance workbook. $12.99 — view the template.
6. Cybersecurity KPI Scorecard in Google Sheets
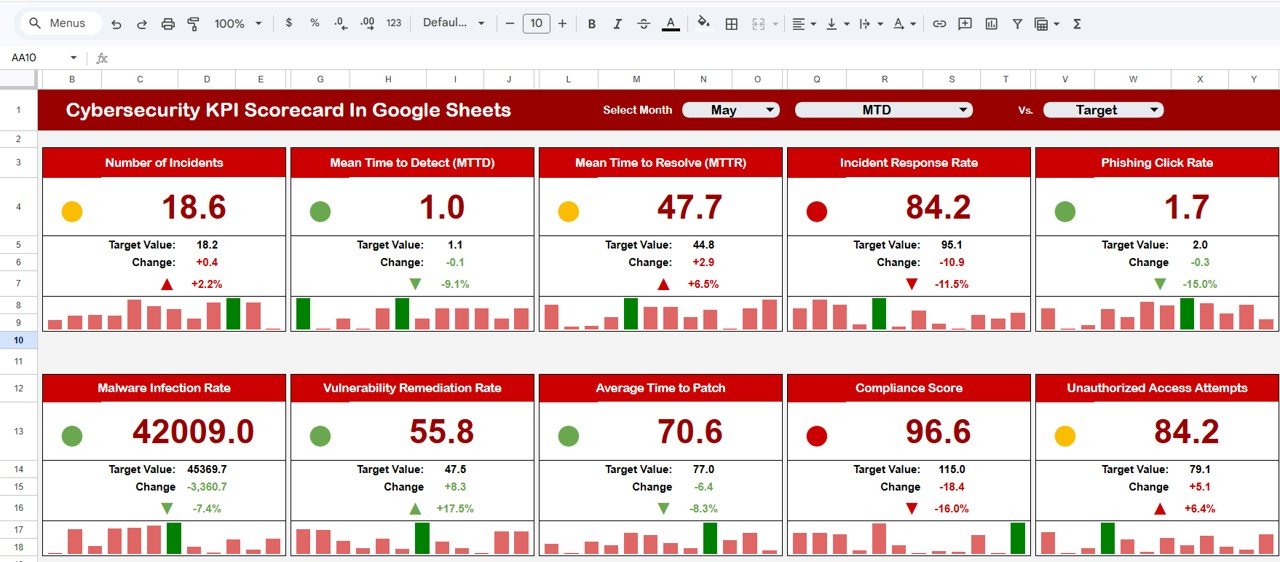
The lightweight monthly scorecard. It presents 10 cybersecurity KPIs on one screen with traffic-light indicators — green for on-target, yellow for moderate, red for action needed — so leadership reads the security posture in five seconds.
Who it is for: teams that want a fast, at-a-glance security scorecard rather than a deep analytics model, shared live in Google Sheets.
What is inside:
- Scorecard sheet with actual-vs-target and percentage-change analysis
- Traffic-light performance indicators with configurable colour thresholds
- Trend sheet for any single KPI, plus a KPI Definition sheet
- Simple data-input sheet — month, KPI name, actual and target
At $9.99 it is the quickest way to give executives a monthly cybersecurity KPI readout without teaching anyone Power BI. Colour thresholds are editable, so you decide what “green” means for each metric. Pair it with the incident Google Sheets dashboard above for a cloud-native, two-file security stack.
Best for: a fast traffic-light monthly scorecard. $9.99 — view the template.
7. Sales & Marketing Cybersecurity KPI Dashboard in Excel
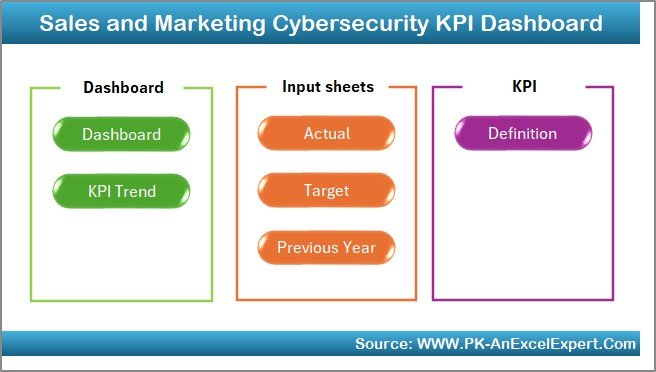
Cybersecurity KPIs framed for the teams that handle the most customer data. This Excel dashboard tracks threats, breaches and incidents against marketing systems and customer-data channels, plus compliance with GDPR and CCPA.
Who it is for: marketing, sales-ops and data-protection leads who need to show that campaign platforms and customer data are secured and compliant.
What is inside:
- Cybersecurity monitoring of threats, incidents and breaches by channel
- Data-security metrics for customer data and marketing campaigns
- Risk-assessment and threat-detection tracking across channels
- Security-compliance tracking against GDPR, CCPA and similar rules
It is the specialised pick for a data-heavy commercial team that owns real privacy risk but sits outside the core SOC. Run it beside your revenue reporting so security and growth are reviewed together. It complements our operational KPI dashboards for teams standardising metrics across departments.
Best for: data-protection metrics for marketing teams. $12.99 — view the template.
8. Project Management Cybersecurity KPI Dashboard in Excel
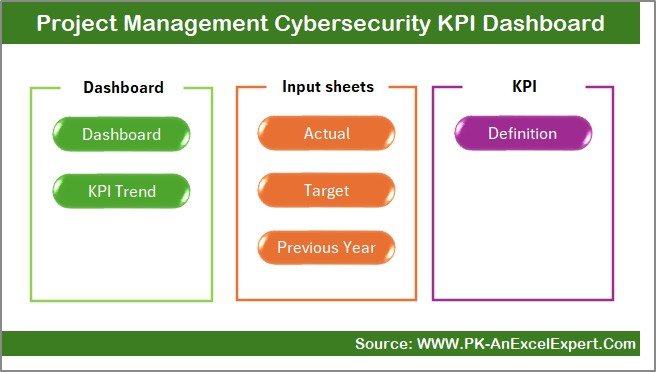
For the teams delivering security work as projects. This Excel dashboard pairs cybersecurity KPIs — risk mitigation, incident response, system vulnerabilities — with project milestones, deadlines and completion status, so a security programme is tracked like the project it is.
Who it is for: cybersecurity project managers and PMOs running remediation programmes, rollouts or compliance projects against a schedule and budget.
What is inside:
- Comprehensive KPI tracking for risk mitigation, incidents and vulnerabilities
- Project progress monitoring with milestones and completion status
- Security incident tracking by severity, status and resolution time
- Time-based analysis of security performance across periods
It is the right pick when your cybersecurity work is milestone-driven — a SOC 2 readiness push, a zero-trust rollout, a patch-debt burn-down — rather than steady-state monitoring. It maps cleanly onto our other project and operations KPI dashboards if your PMO wants one reporting style across every programme.
Best for: tracking security-project delivery and risk. $12.99 — view the template.
Watch a cybersecurity KPI dashboard being built
See how the incident scorecard comes together, page by page, in this walk-through:
How to choose between them
Match the template to how your security team already works and how deep a report you need:
| If you… | Buy this | Price |
|---|---|---|
| Report cyber-risk KPIs to a board and want interactivity | Cybersecurity Risk Assessment KPI Dashboard (Power BI) | $11.99 |
| Are cloud-first and want the cheapest shared link | Cybersecurity Incident KPI Dashboard (Google Sheets) | $9.99 |
| Live in Excel and track incidents offline | Cybersecurity Incident KPI Dashboard (Excel) | $12.99 |
| Need a deep, auditable risk workbook | Cybersecurity Risk Assessment KPI Dashboard (Excel) | $12.99 |
| Just want a five-second traffic-light readout | Cybersecurity KPI Scorecard (Google Sheets) | $9.99 |
Still unsure? Start with the $9.99 Google Sheets incident dashboard. It is the cheapest way to prove a KPI scorecard fits your team, and you can add the Power BI depth later for the price of a couple of coffees.
When a cybersecurity KPI dashboard is NOT the right answer
We would rather keep a customer than sell the wrong thing, so here is the honest version. A spreadsheet or Power BI KPI dashboard is a reporting layer, not a security control. Buy dedicated software instead when any of these is true:
- You need continuous, automated monitoring. If you want live control checks wired into AWS, Okta or Jira with evidence collected automatically, that is a GRC platform such as Vanta or Drata, not a monthly template.
- You need real-time threat detection. These dashboards report on incidents after your tools find them. Detecting the intrusion in the first place is the job of a SIEM or EDR, and no spreadsheet replaces one.
- Nobody can own a monthly data update. The templates are template-driven, not zero-touch. If no one can spend an hour a month entering actuals, even the best scorecard goes stale.
- You have a formal audit that mandates a specific tool. Some certifications expect evidence from a named platform. Use the template to prepare, but confirm what the auditor will accept.
The sweet spot is a security team that already has monitoring tools and needs a clean, consistent way to report performance to leadership every month. If that is you, a one-time file wins on both cost and control. If you need automation and live detection, keep the platform and use a template only for the board-level summary.
Frequently asked questions
What are the most important cybersecurity KPIs to track?
The most important cybersecurity KPIs are mean time to detect (MTTD), mean time to respond, mean time to contain and mean time to recover, patching SLA compliance, vulnerability remediation rate, open critical vulnerabilities, phishing click and reporting rates, training completion, incident volume and alert false-positive rate. Together they measure detection speed, response speed, exposure and human behaviour.
What is a good mean time to detect (MTTD)?
A mature security team targets an MTTD under 24 hours for serious incidents, yet IBM’s Cost of a Data Breach report still puts the global mean time to identify a breach near 200 days. Measure MTTD from the actual compromise, not the first alert, so the number reflects true attacker dwell time.
How do you calculate patching SLA compliance rate?
Divide the number of patches applied inside your SLA window by the total number of patches due, then multiply by 100. Aim for at least 95% within 30 days for critical patches, and treat 15 days as the ceiling for anything on CISA’s Known Exploited Vulnerabilities catalog. Only count a patch once the host has actually rebooted.
What is a good phishing click rate benchmark?
Untrained workforces commonly click 25–30% of simulated phishing emails, and a sustained awareness programme drives that under 5%. Do not read click rate alone: track the phishing reporting rate too, because a low click rate with no reporting means people are ignoring suspicious mail rather than flagging it.
How many cybersecurity KPIs should a small team track?
Start with five to eight, not all twelve. Pick MTTD, mean time to respond, patching SLA compliance, open critical vulnerabilities and phishing click rate first — they cover detection, response, exposure and behaviour. Add the rest as your programme matures. Tracking too many metrics badly is worse than tracking a few well.
What is the difference between MTTR-respond, contain and recover?
Mean time to respond measures how fast you start acting after detection; mean time to contain measures how fast you isolate the threat so it spreads no further; mean time to recover measures how fast systems are clean and back in normal service. Reporting one blended number hides where your process is actually slow.
Can I track cybersecurity KPIs in Excel or Google Sheets instead of a SIEM?
Yes, for reporting. A KPI dashboard in Excel, Google Sheets or Power BI is where you record and present metrics against target each month. It does not replace a SIEM or EDR, which detect the incidents in the first place. Use your security tools to detect, and a template to report to leadership.
Which cybersecurity KPI dashboard is best value?
The Cybersecurity Incident KPI Dashboard in Google Sheets at $9.99 is the best value in this guide. It reproduces the full incident scorecard — MTD and YTD, actual vs target, trend arrows — as a shared cloud link with no software to install and no per-seat fee, making it the fastest low-cost way to start reporting.
How often should I update my cybersecurity KPI dashboard?
Monthly for board and management reporting, which is what these templates are built for with their MTD and YTD views. Operational metrics like alert false-positive rate and open critical vulnerabilities are worth a weekly glance inside the SOC. Enter actuals on a fixed cadence so the trend line stays honest and comparable.
Get more cybersecurity KPI templates
Tracking cybersecurity KPIs well does not require a five-figure GRC subscription — it requires a consistent scorecard you own. For under the price of one month of most security tools you can run every metric in this guide against target. Start with the Cybersecurity Risk Assessment KPI Dashboard in Power BI ($11.99) if you report to a board, or the Cybersecurity Incident KPI Dashboard in Google Sheets ($9.99) if you want the cheapest cloud start. Browse the full range of KPI dashboard templates across every function to standardise reporting company-wide.
Prefer to see the dashboards built first? Watch step-by-step tutorials on our YouTube channel: youtube.com/@NextGenTemplates.