

Project management KPIs are the measurable indicators that tell you whether a project is on budget, on schedule, and on track to finish as planned. The 12 that matter most in 2026 are the earned-value metrics: PV, EV, AC, CV, SV, CPI, SPI, EAC, ETC, VAC, TCPI, and milestone completion rate. Together they turn a status meeting into math.
Last updated: September 2026
Key takeaways
- The core project management KPIs are earned-value metrics: CPI = EV / AC and SPI = EV / PV are the two numbers every steering committee should see first.
- A healthy project holds CPI and SPI between 0.95 and 1.05; below 0.90 on either index signals a recovery plan is needed.
- SV and SPI become unreliable in the final third of a project because they always drift back to zero and 1.0 near completion, so track on-time milestone rate instead.
- You do not need enterprise software to run earned value; the Project Performance and Cost Control Dashboard in Google Sheets calculates the full EVM set for $9.99.
- This guide maps all 12 project management KPIs to 8 ready-made NGT dashboard templates priced from $4.99 to $17.99.
The 12 project management KPIs compared
| KPI | Formula | Healthy benchmark | Where to see it |
|---|---|---|---|
| Planned Value (PV / BCWS) | Planned % complete × BAC | Cumulative PV = BAC at end | Cost control dashboard |
| Earned Value (EV / BCWP) | Actual % complete × BAC | Within 5–10% of PV | Cost control dashboard |
| Actual Cost (AC / ACWP) | Sum of costs incurred | AC ≤ EV | Cost dashboard |
| Cost Variance (CV) | EV − AC | ≥ 0 (within ±5% of BAC) | Cost dashboard |
| Schedule Variance (SV) | EV − PV | ≥ 0 (within ±5% of PV) | Cost control dashboard |
| Cost Performance Index (CPI) | EV / AC | 0.95–1.05 | Cost dashboard |
| Schedule Performance Index (SPI) | EV / PV | 0.95–1.05 | Cost control dashboard |
| Estimate at Completion (EAC) | BAC / CPI | Within ±10% of BAC | Cost dashboard |
| Estimate to Complete (ETC) | EAC − AC | ≤ (BAC − AC) | Cost dashboard |
| Variance at Completion (VAC) | BAC − EAC | ≥ 0 | Cost dashboard |
| To-Complete Performance Index (TCPI) | (BAC − EV) / (BAC − AC) | ≤ 1.10 | Cost dashboard |
| Milestone completion rate | On-time milestones ÷ due milestones | ≥ 90% | Milestone tracker |
The rest of this guide defines each of these project management KPIs in one sentence, gives the exact formula, a realistic benchmark range, and the mistake teams make — then shows you the eight NGT dashboard templates that already calculate them. Earned value management (EVM) is the framework that ties them together, and it is endorsed as a project controls standard by the Project Management Institute.
The 12 project management KPIs, defined
1. Planned Value (PV / BCWS)
Planned Value is the budgeted cost of the work you scheduled to have finished by a given date.
Formula: PV = Planned % complete × Budget at Completion (BAC).
Benchmark: PV is your baseline, so there is no “good” or “bad” figure — but cumulative PV must equal BAC at the planned finish date. If it does not, your baseline is broken.
The mistake teams make: setting PV once and never re-baselining after approved change orders, so every downstream variance is measured against a plan that no longer exists.
2. Earned Value (EV / BCWP)
Earned Value is the budgeted cost of the work you have actually completed — what your progress is “worth” in budget terms.
Formula: EV = Actual % complete × BAC.
Benchmark: EV should track within 5–10% of PV on a healthy project.
The mistake teams make: measuring EV by effort or hours burned (“we’ve used half the budget so we’re 50% done”) instead of deliverables completed. EV must reflect output, not input.
3. Actual Cost (AC / ACWP)
Actual Cost is the total money genuinely spent on the work performed to date.
Formula: AC = sum of all costs incurred for completed work.
Benchmark: AC ≤ EV means you are earning more value than you are spending — a project under budget.
The mistake teams make: excluding committed-but-uninvoiced costs such as purchase orders and accruals, which makes AC look artificially low and inflates CPI until the invoices land.
4. Cost Variance (CV)
Cost Variance is the dollar gap between the value earned and the money spent.
Formula: CV = EV − AC.
Benchmark: zero or positive is good; a CV between 0 and −5% of BAC is a yellow flag; below −10% of BAC needs a documented recovery plan.
The mistake teams make: reading CV in isolation. A −$10,000 CV is trivial on a $2M project and catastrophic on a $50,000 one — always pair it with CPI.
5. Schedule Variance (SV)
Schedule Variance expresses whether you are ahead of or behind plan, measured in budget dollars rather than days.
Formula: SV = EV − PV.
Benchmark: zero or positive means on or ahead of schedule; keep SV within ±5% of PV.
The mistake teams make: trusting SV late in a project. Because EV and PV both converge on BAC at completion, SV mathematically returns to zero even on a project that finished months late. Switch to milestone tracking in the final third.
6. Cost Performance Index (CPI)
The Cost Performance Index is the efficiency ratio of value earned per dollar spent — the single most-cited project management KPI.
Formula: CPI = EV / AC.
Benchmark: 1.0 is exactly on budget; 0.95–1.05 is healthy; sustained readings below 0.90 indicate a serious overrun.
The mistake teams make: gaming CPI above 1.0 by deferring supplier payments to a later period, which simply pushes the overrun downstream and hides it from this month’s report.
7. Schedule Performance Index (SPI)
The Schedule Performance Index is the efficiency ratio of work accomplished against work planned.
Formula: SPI = EV / PV.
Benchmark: 1.0 is on schedule; 0.95–1.05 is healthy; below 0.90 means the schedule is slipping.
The mistake teams make: relying on SPI near the finish line. Like SV, SPI drifts back to 1.0 as the project completes, so a late project can show a reassuring 0.98 in month 11 of 12. Cross-check with the milestone completion rate.
8. Estimate at Completion (EAC)
Estimate at Completion is the forecast of what the whole project will ultimately cost, given performance so far.
Formula: EAC = BAC / CPI (the performance-adjusted method).
Benchmark: an EAC within ±10% of BAC is controllable; a widening gap between EAC and BAC month over month is the earliest reliable overrun signal.
The mistake teams make: using the naïve EAC = AC + (BAC − EV), which assumes all remaining work will run at the planned rate even when CPI already proves otherwise.
9. Estimate to Complete (ETC)
Estimate to Complete is the forecast cost of the work still remaining from today to finish.
Formula: ETC = EAC − AC.
Benchmark: compare ETC against your remaining budget (BAC − AC); when ETC exceeds it, you are forecasting an overrun.
The mistake teams make: re-estimating ETC bottom-up every cycle without reconciling it to the CPI-based EAC, which buries the performance trend under fresh optimism.
10. Variance at Completion (VAC)
Variance at Completion is the projected surplus or overrun for the entire project.
Formula: VAC = BAC − EAC.
Benchmark: zero or positive is good; a negative VAC is a forecast overrun of exactly that size.
The mistake teams make: treating a small positive VAC as safe while CPI is trending downward — the VAC you report today is only as good as the CPI trend behind it.
11. To-Complete Performance Index (TCPI)
The To-Complete Performance Index is the cost efficiency you must achieve on all remaining work to still hit the original budget.
Formula: TCPI = (BAC − EV) / (BAC − AC).
Benchmark: a TCPI of 1.0 or below is achievable; above 1.10 means recovery to the original budget is unrealistic.
The mistake teams make: ignoring TCPI when it exceeds current CPI by more than about 0.10 — the clearest quantitative sign that the plan is no longer credible and the budget should be re-baselined.
12. Milestone completion rate
The milestone completion rate is the share of scheduled milestones delivered on or before their due date.
Formula: Milestone completion rate = on-time milestones ÷ milestones due in period.
Benchmark: 90% or higher is healthy; a rate that falls while SPI still reads near 1.0 confirms the late-project blind spot in schedule variance.
The mistake teams make: reporting percent complete by gut feel rather than a rules-based method (0/50/100 or weighted milestones). Because EV depends on percent complete, a sloppy estimate corrupts every metric downstream.
How we picked these dashboard templates
We searched the full NextGenTemplates catalog of 1,000+ paid templates for tools that actually calculate the earned-value metrics above rather than just charting task lists. We prioritized templates that expose CPI, SPI, cost variance and milestone data on a single screen, that ship in more than one format (Excel, Google Sheets, Power BI and HTML), and that are priced for a working project manager rather than an enterprise PMO. We excluded generic to-do trackers and any template that could not produce at least a cost or schedule variance.
The 8 best project management KPI dashboard templates for 2026
1. Construction Project Cost Dashboard in Excel — best overall
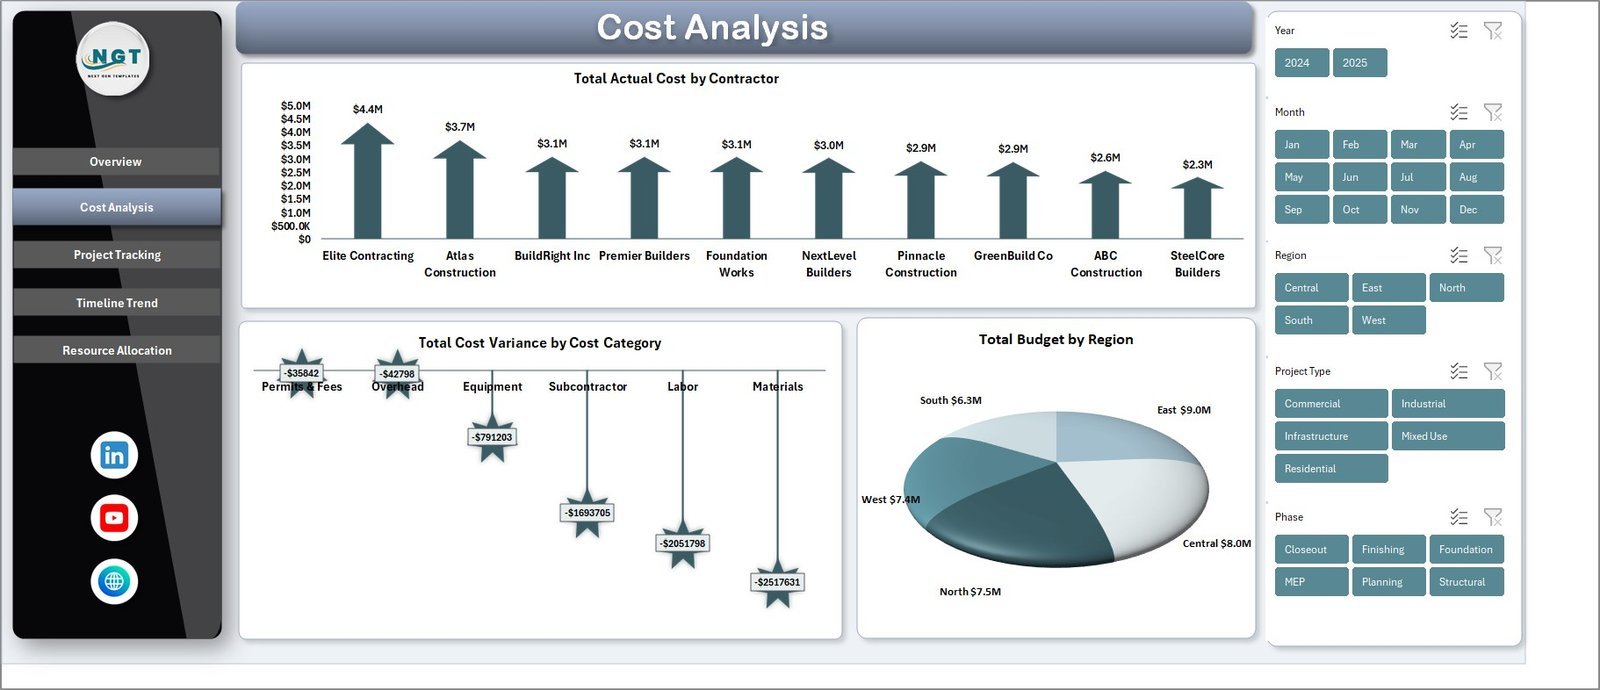
This is the most complete single-file view of the cost-side project management KPIs. It tracks actual cost by contractor and category against budget and surfaces variance, so CPI, CV and EAC read straight off the summary.
Who it is for: project and cost managers who live in Excel and need a self-contained EVM view with no add-ins.
What is inside:
- Budget vs actual cost by contractor, phase and category
- Cost variance and total budget rollups
- Region and category cost breakdown charts
- Fully editable, offline, no macros required
Use it to spot a contractor running at CPI 0.88 before the next draw, to feed a monthly EAC forecast, or to defend a change order with hard variance numbers. Price: $17.99. Get the Construction Project Cost Dashboard in Excel →
Best for: the manager who wants one authoritative cost file per project.
2. Project Performance and Cost Control Dashboard in Google Sheets — best value
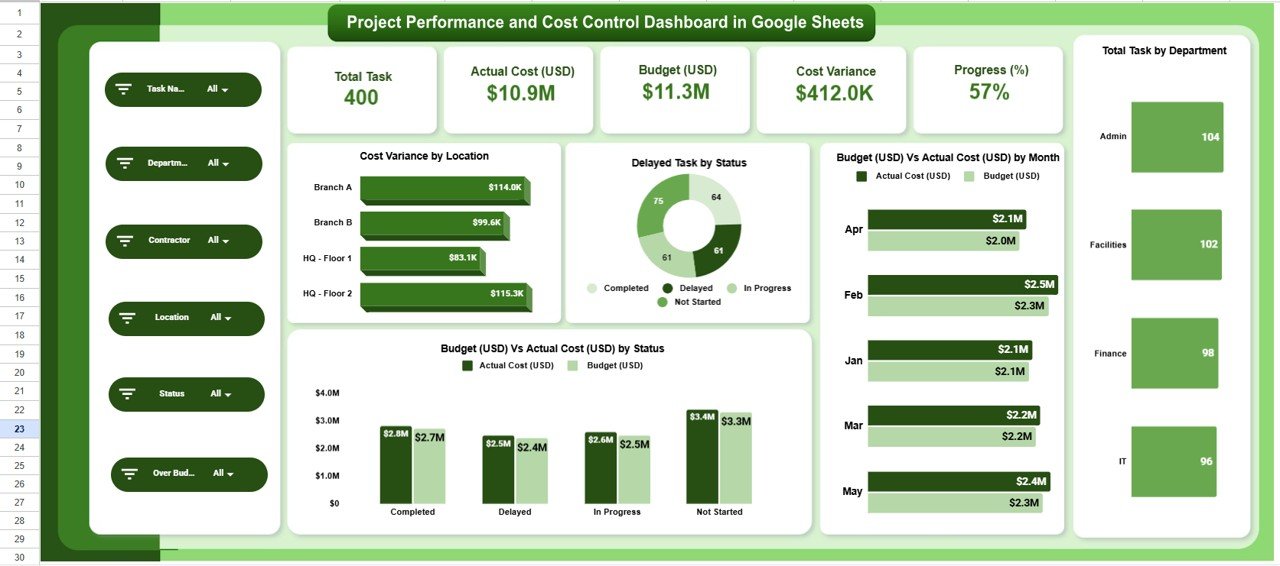
At $9.99 this Google Sheets template calculates the widest slice of the EVM set — earned value, planned value, actual cost, cost and schedule variance — and shares live with a whole team.
Who it is for: distributed teams that need real-time cost control without an Excel licence.
What is inside:
- EV, PV and AC tracked by task and month
- Budget-vs-actual and cost-variance-by-status charts
- Progress-percent and departmental rollups
- Live multi-user editing in Google Sheets
It is the cheapest way to run true earned value across a team, ideal for agencies billing against a fixed fee or a PMO standardizing on Sheets. Price: $9.99. Get the Cost Control Dashboard in Google Sheets →
Best for: the best full-EVM value at any price on this list.
3. Project Milestone Tracking Dashboard in Power BI
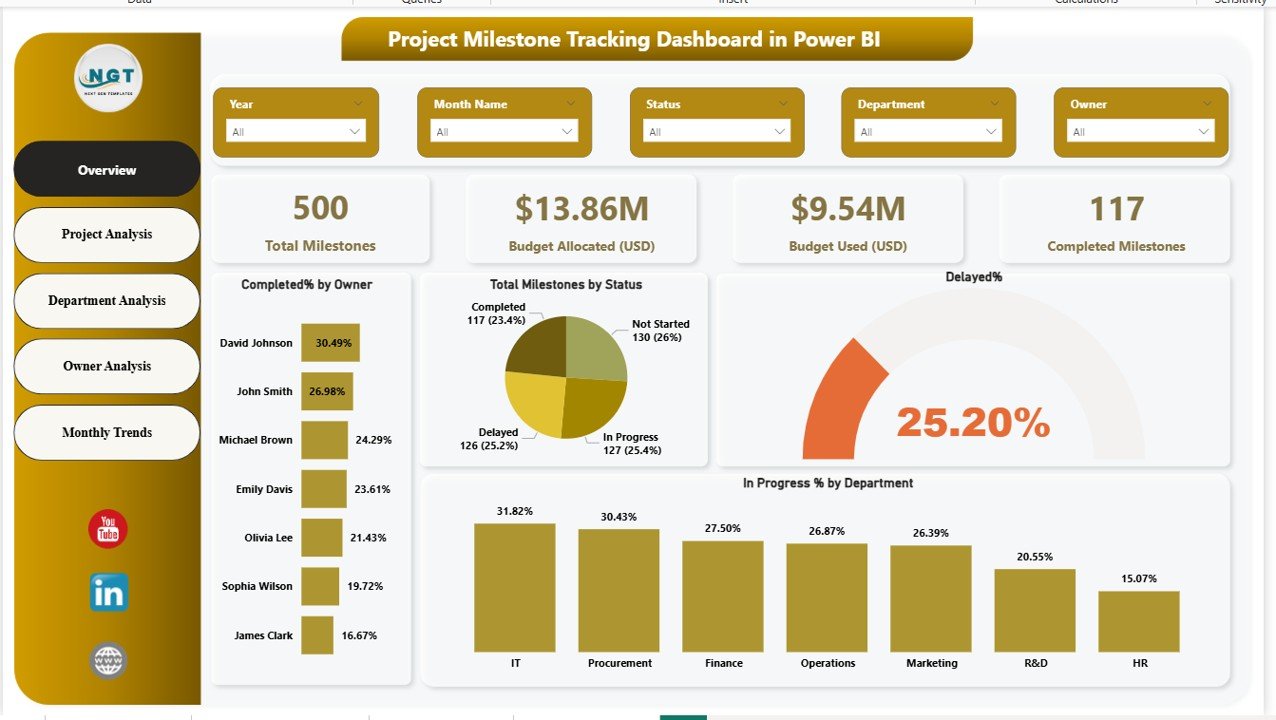
This Power BI report is built for the schedule-side project management KPIs that SV and SPI miss late in a project: total milestones, completed milestones, and on-time completion percentage by owner and department.
Who it is for: PMOs and program managers reporting milestone health to executives.
What is inside:
- Milestone completion rate with a headline percentage gauge
- Completed vs not-started vs in-progress breakdowns
- Owner, department and status slicers
- Interactive drill-through on any milestone
Pair it with a cost dashboard so your steering deck shows CPI on one page and milestone completion on the next — the two views that never lie together. Price: $17.99. Get the Milestone Tracking Dashboard in Power BI →
Best for: executive-grade schedule reporting.
4. Project Management Service Delivery KPI Dashboard in Excel
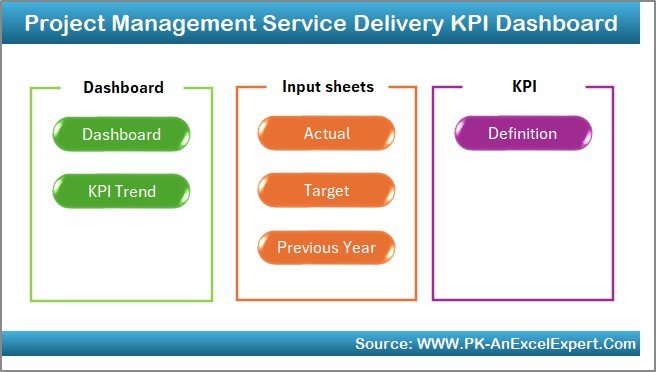
This template widens the lens from pure EVM to service-delivery performance — SLA adherence, delivery timeliness and resource utilization alongside cost and schedule.
Who it is for: managed-service and delivery teams whose KPIs include client SLAs, not just budget.
What is inside:
- Service-delivery and SLA KPI cards
- On-time delivery and utilization tracking
- Trend charts across delivery periods
- Editable KPI targets
Use it when your accountability is measured in delivered outcomes and response times rather than concrete and steel. Price: $14.99. Get the Service Delivery KPI Dashboard →
Best for: service and delivery organizations.
5. Construction Project Cost Dashboard in HTML
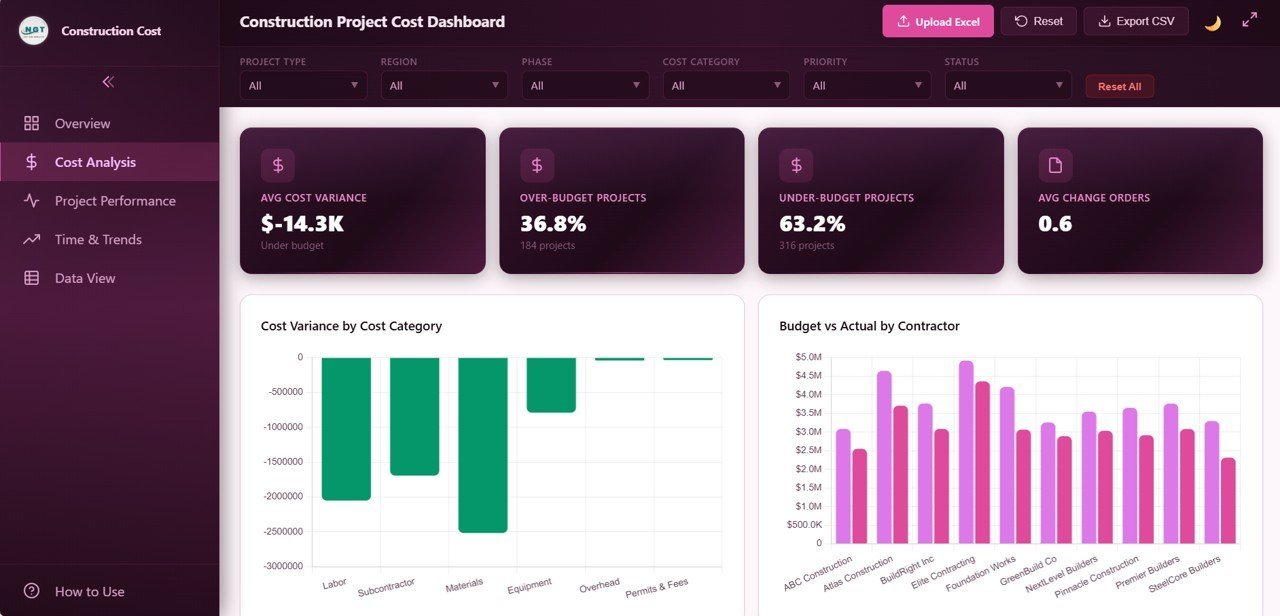
The same cost-control view as our top pick, delivered as a self-contained HTML dashboard that opens in any browser — no Excel, no login, no server.
Who it is for: teams that want to publish a read-only cost dashboard to stakeholders on any device.
What is inside:
- Interactive cost-variance and budget charts in the browser
- Contractor and category breakdowns
- Works offline from a single file
- Clean, presentation-ready layout
Price: $12.99. Get the Cost Dashboard in HTML →
Best for: browser-based stakeholder reporting.
6. Construction Project Cost Dashboard in Google Sheets

A collaborative version of the cost dashboard for teams standardized on Google Workspace, with the same CPI and cost-variance outputs updated live.
Who it is for: field and office teams that co-edit one cost file across locations.
What is inside:
- Live budget-vs-actual by contractor and phase
- Cost variance and total-cost summaries
- Shareable with view or edit permissions
- Mobile-friendly in the Sheets app
Price: $9.99. Get the Cost Dashboard in Google Sheets →
Best for: Google Workspace project teams.
7. Construction Project Schedule Calendar in Excel

Every earned-value calculation starts with a credible schedule, and this calendar builds the time-phased plan that feeds your Planned Value baseline.
Who it is for: managers who need a clean scheduling layer before layering on EVM.
What is inside:
- Phase and task scheduling by date
- Visual calendar and timeline views
- Editable durations and dependencies
- Feeds PV into any cost dashboard above
Price: $4.99. Get the Schedule Calendar in Excel →
Best for: building the schedule baseline behind PV.
8. Supplier Delivery Schedule Calendar in Excel
Late supplier deliveries are the hidden driver of schedule variance; this calendar tracks promised versus actual delivery dates so slippage shows up before it hits SPI.
Who it is for: procurement-heavy projects where materials drive the critical path.
What is inside:
- Supplier delivery dates, promised vs actual
- Delay flags and lead-time views
- Editable supplier and item lists
- Feeds schedule-variance analysis
Price: $4.99. Get the Supplier Delivery Calendar in Excel →
Best for: procurement-driven schedule control.
Run full earned value this week for under $10. The Project Performance and Cost Control Dashboard in Google Sheets gives you EV, PV, AC, CV, SV, CPI and SPI on one shareable screen for $9.99. Watch it in action on the NextGenTemplates YouTube channel.
How to choose between them
Match the template to the KPI question you are being asked, and to the tool your team already uses:
- Need cost KPIs (CPI, CV, EAC) in Excel? Construction Project Cost Dashboard in Excel — $17.99.
- Need the full EVM set on a budget? Project Performance and Cost Control Dashboard in Google Sheets — $9.99.
- Reporting milestones to executives? Project Milestone Tracking Dashboard in Power BI — $17.99.
- Measured on SLAs, not just budget? Service Delivery KPI Dashboard in Excel — $14.99.
- Just need a scheduling baseline? Construction Project Schedule Calendar in Excel — $4.99.
For a broader view of the category, compare these against our full project management dashboard templates roundup, and if you are leaving a SaaS tool, our Asana alternatives and ClickUp alternatives guides show the same templates in a migration context.
When a KPI template is NOT the right answer
Earned value only works when three things are true: you have a baselined budget and schedule, you can measure percent complete objectively, and you update the numbers at least monthly. If your project is genuinely agile with a fluid scope, EVM’s fixed BAC fights the way you work — track velocity, cycle time and burndown instead.
If you manage dozens of concurrent projects with shared resources and need real-time portfolio roll-ups, a spreadsheet will eventually creak; that is the point to evaluate dedicated PPM software. And if nobody on the team will commit to a disciplined monthly update, no template will save you — the KPIs will simply be wrong faster. For teams tracking KPIs in other functions, our marketing KPIs, HR KPIs and payroll KPIs guides follow the same formula-plus-benchmark approach.
Frequently asked questions
What are the most important project management KPIs?
The two most important project management KPIs are the Cost Performance Index (CPI = EV / AC) and the Schedule Performance Index (SPI = EV / PV). Together they tell you, in a single glance, whether a project is over budget and whether it is behind schedule, both normalized so you can compare across projects.
How do you calculate CPI and SPI?
CPI equals Earned Value divided by Actual Cost (EV / AC), and SPI equals Earned Value divided by Planned Value (EV / PV). A value of 1.0 means you are exactly on budget or on schedule; above 1.0 is favorable, and below 1.0 signals a cost overrun or a schedule slip that needs attention.
What is a good CPI or SPI value?
A healthy project keeps both CPI and SPI between 0.95 and 1.05. Readings from 0.90 to 0.95 are a caution zone worth watching, while anything below 0.90 on either index usually justifies a formal recovery plan. Values far above 1.05 can indicate an unrealistic baseline rather than great performance.
What is EVM in project management?
Earned Value Management (EVM) is a project-controls method that integrates scope, schedule and cost into a single set of metrics. It compares planned value, earned value and actual cost to produce variances and performance indices such as CV, SV, CPI and SPI, giving an objective, math-based picture of project health.
What is the difference between PV, EV and AC?
Planned Value (PV) is the budgeted cost of work you scheduled to finish by now. Earned Value (EV) is the budgeted cost of work you actually finished. Actual Cost (AC) is the money you truly spent on that finished work. Every other earned-value KPI is derived from these three numbers.
Why do SV and SPI become unreliable late in a project?
Schedule Variance and the Schedule Performance Index both use Earned Value, which converges on the Budget at Completion as the project finishes. This forces SV toward zero and SPI toward 1.0 regardless of how late the project actually is, so in the final third you should track on-time milestone completion instead.
Can I track project management KPIs in Excel or Google Sheets?
Yes. A well-built spreadsheet calculates the full earned-value set from three inputs — PV, EV and AC — using simple division. The Project Performance and Cost Control Dashboard in Google Sheets ($9.99) and the Construction Project Cost Dashboard in Excel ($17.99) both do this out of the box with charts included.
What is the difference between EAC and ETC?
Estimate at Completion (EAC) forecasts the total cost of the entire project, most reliably calculated as BAC / CPI. Estimate to Complete (ETC) forecasts only the cost of the work still remaining, calculated as EAC − AC. EAC answers “what will it all cost”; ETC answers “what is left to spend”.
What is TCPI and when should I use it?
The To-Complete Performance Index (TCPI = (BAC − EV) / (BAC − AC)) is the cost efficiency you must sustain on remaining work to still hit the original budget. Use it as a reality check: when TCPI exceeds your current CPI by more than about 0.10, hitting the original budget is no longer realistic.
How often should project KPIs be updated?
Earned-value KPIs should be updated at least monthly, and weekly on fast-moving projects. The value comes from the trend, not a single reading — a CPI of 0.97 is reassuring if it is stable but alarming if it has fallen from 1.03 over three cycles, which only regular updates reveal.
Get more project management KPI templates
Best value for a full team: start with the Project Performance and Cost Control Dashboard in Google Sheets at $9.99 for the complete EVM set, then add the Project Milestone Tracking Dashboard in Power BI at $17.99 for executive reporting. Explore the whole range in our project management dashboard templates collection, and subscribe to NextGenTemplates on YouTube for walkthroughs of every dashboard.