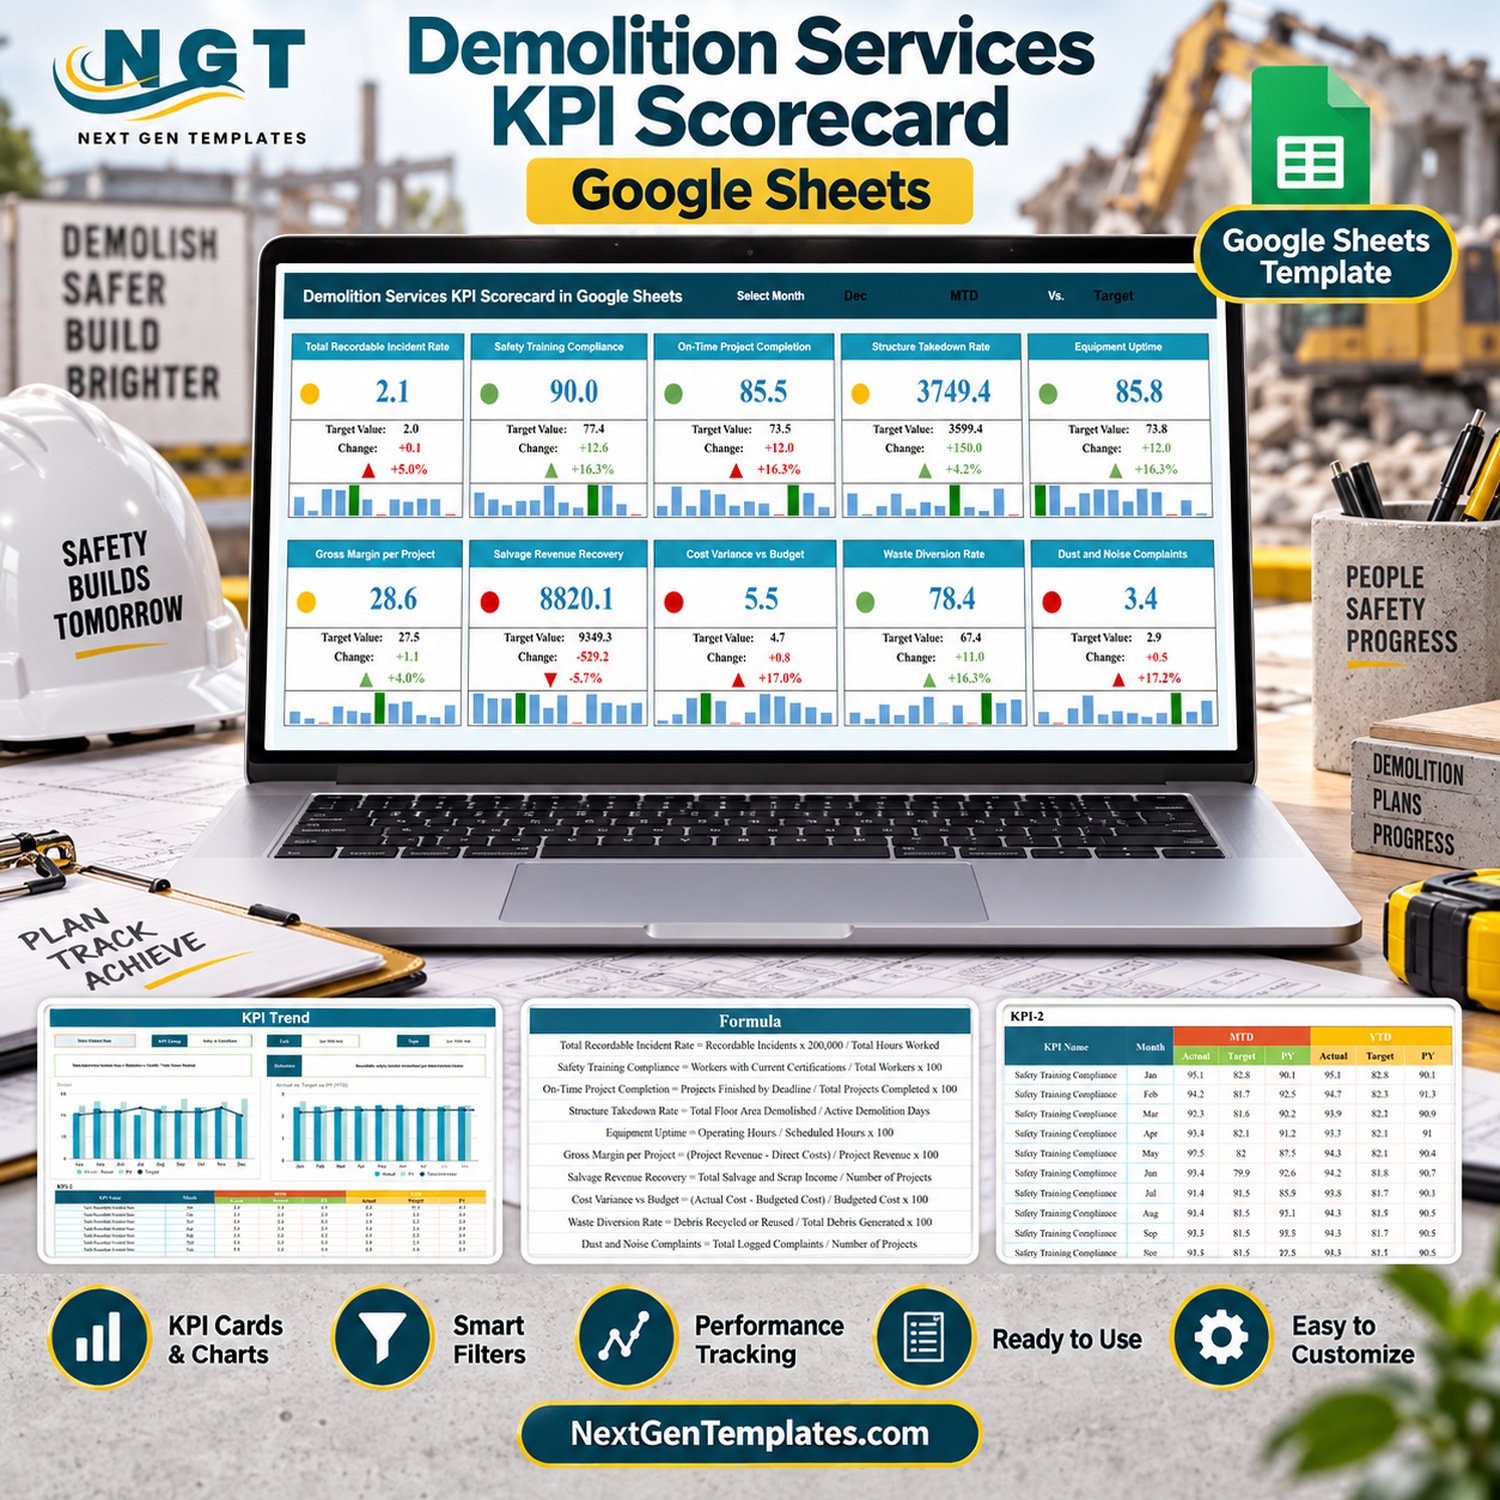
The Demolition Services KPI Scorecard in Google Sheets tracks 10 demolition KPIs in four groups (Safety & Compliance, Project Execution, Financial and Environmental) on one scorecard page of 10 traffic-light cards, each with its own 12-month mini chart. A KPI Trend page charts any single KPI for all 12 months against Target and prior year (PY), and the sample file ships with 120 monthly records (10 KPIs x 12 months).
This listing is the KPI scorecard edition: a month-picker scorecard plus a KPI Trend page. It is a different product from our analytical Google Sheets dashboards and from the KPI Dashboard line. NextGenTemplates builds one-time-purchase templates for Google Sheets, Excel, Power BI and Apps Script, so you own the file instead of renting software.
✅ Instant download · One-time payment · No subscription · No per-user fees · Lifetime access
🔑 Key Features of the Demolition Services KPI Scorecard in Google Sheets
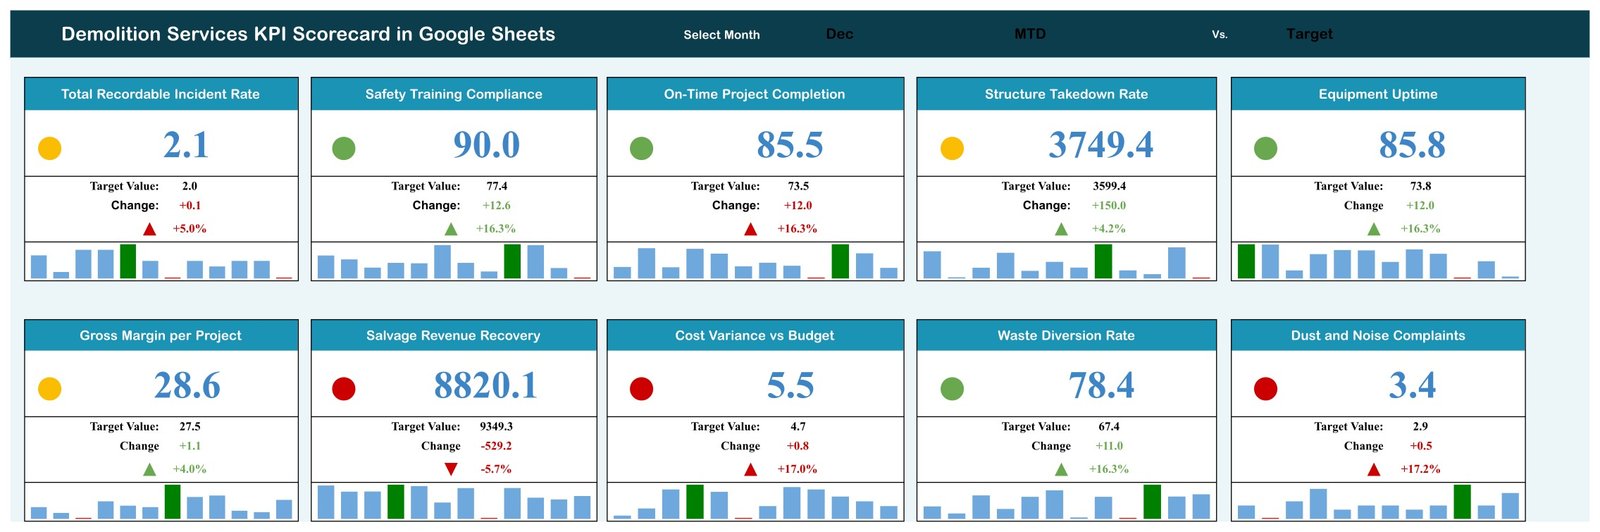
🎯 Three selectors on one page. The Scorecard has a Month drop-down (Jan to Dec), an MTD or YTD switch, and a comparison switch for Target or PY. Every card recalculates from the Input Data tab through SUMIFS lookups, with no scripts, macros or add-ons.
🚦 Direction-aware traffic lights. Seven KPIs are upper-the-better (UTB) and three are lower-the-better (LTB): Total Recordable Incident Rate, Cost Variance vs Budget and Dust and Noise Complaints. For a UTB KPI, at or below the comparison value is red, up to 10% above is amber, and more than 10% above is green. LTB KPIs use the mirror rule.
📈 Full detail on every card. Each of the 10 cards shows the current value, the Target or PY value, the absolute change, the change %, an up or down arrow and a 12-month mini column chart with the selected month highlighted in green.
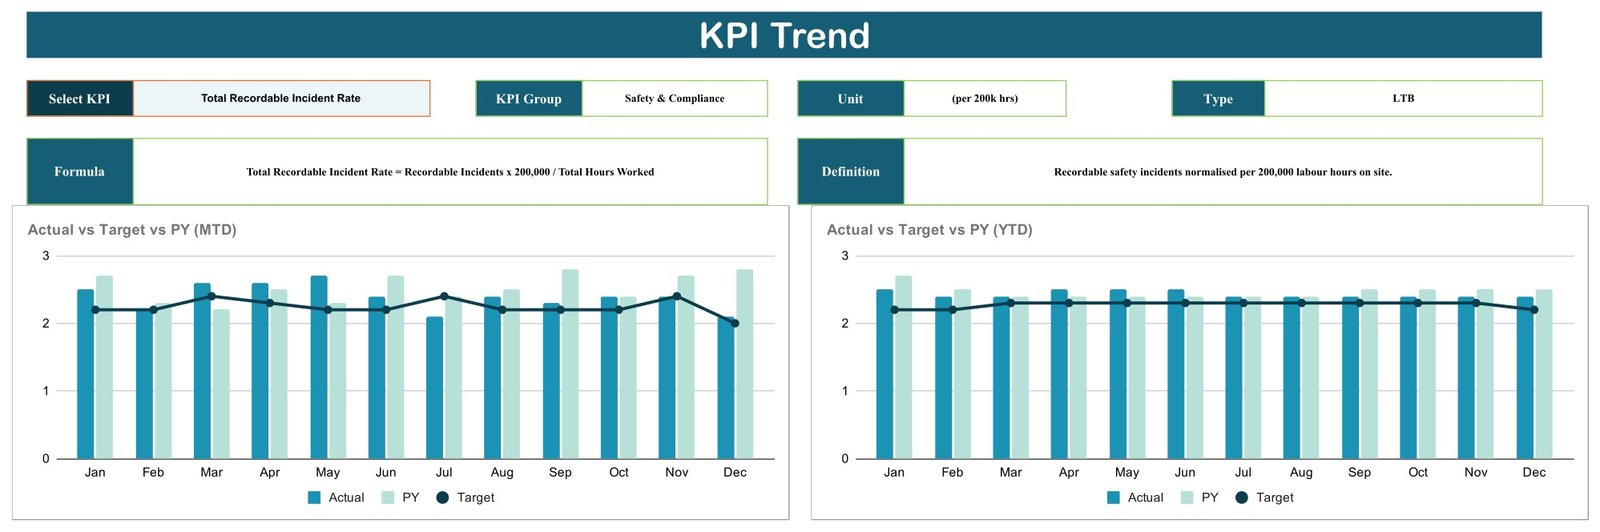
📊 KPI Trend page. Pick one KPI from a drop-down and the page fills in its group, unit, type, formula and definition, then draws two charts: Actual vs Target vs PY (MTD) by Month and Actual vs Target vs PY (YTD) by Month.
📚 Documented KPIs. The KPI Definition sheet gives every metric a group, unit, formula, plain-English definition and UTB/LTB type, for example Structure Takedown Rate = Total Floor Area Demolished / Active Demolition Days, measured in sq ft per day.
✏️ Simple monthly data entry. Input Data holds one block per KPI with MTD Actual, Target and PY plus YTD Actual, Target and PY for each month. YTD figures are typed in rather than calculated, so you control how year-to-date is defined.
📦 What’s Inside the Template
The 10 KPIs, exactly as they ship:
- 🦺 Safety & Compliance: Total Recordable Incident Rate (per 200k hrs, LTB), Safety Training Compliance (%)
- 🏗️ Project Execution: On-Time Project Completion (%), Structure Takedown Rate (sq ft/day), Equipment Uptime (%)
- 💰 Financial: Gross Margin per Project (%), Salvage Revenue Recovery ($/project), Cost Variance vs Budget (%, LTB)
- ♻️ Environmental: Waste Diversion Rate (%), Dust and Noise Complaints (count/project, LTB)
Page 1: Scorecard
Ten KPI cards in two rows of five. With December, MTD and Target selected, the sample shows 4 green, 3 amber and 3 red lights: Equipment Uptime reads 85.8 against a 73.8 target (green), while Salvage Revenue Recovery reads 8,820.1 against 9,349.3 (red, down 5.7%).
Page 2: KPI Trend
A single-KPI view with Select KPI, KPI Group, Unit, Type, Formula and Definition boxes, plus Actual vs Target vs PY charts for MTD and YTD across Jan to Dec. The sample shows Total Recordable Incident Rate.
Page 3: KPI Definition
A reference table of all 10 KPIs with columns for #, KPI Group, KPI Name, Unit, Formula, Definition and Type. Edit it to rename a metric, change its unit or switch it between UTB and LTB.

Page 4: Input Data
Ten blocks labelled KPI-1 to KPI-10, each with 12 monthly rows of MTD and YTD Actual, Target and PY. This is the only sheet you type into each month.

The file also contains a Read Me tab, a Color Settings tab and two helper tabs (Support and Trend_Support) that feed the cards and charts.
⚠️ Known issues in this build, stated up front: the Month drop-down lists “June” and “July” while Input Data stores “Jun” and “Jul”, so picking either month shows 0.0 on every card until you change those two drop-down entries to Jun and Jul (a one-minute Data validation edit, covered in the steps below). The Read Me tab is empty. The Color Settings tab is not linked to the lights; the red/amber/green bands live in the Support tab (cells Z4:AE6). On the On-Time Project Completion card, the change figures show in red even when the result is favourable.
📊 Google Sheets Scorecard vs. Excel Workbook vs. Construction SaaS: Where This Fits
| Feature | Demolition Services KPI Scorecard (Google Sheets) | Excel KPI scorecard workbook | Construction management SaaS (Procore / Buildertrend) |
|---|---|---|---|
| Cost | ✅ $8.99 one-time | One-time, plus an Excel licence | Recurring subscription |
| Platform | ✅ Browser, any OS | Desktop Excel | Vendor web and mobile apps |
| Setup time | ✅ Minutes: make a copy, enter figures | Minutes | Days to weeks of onboarding |
| Real-time team collaboration | ✅ Native Google Sheets sharing | Limited without OneDrive/SharePoint | ✅ Yes |
| Mobile access | Google Sheets app (view and edit) | Excel mobile | ✅ Dedicated apps |
| Customisable KPIs | ✅ Edit names, units, formulas, UTB/LTB | ✅ Yes | Within vendor limits |
| Share with a link | ✅ Yes | File attachment | User seats |
| Year-1 cost at 5 users | ✅ $8.99 total | Template plus licences | Per-seat or per-project fees |
| Traffic-light monthly scorecard | ✅ Built in | ✅ Built in | Usually a custom report |
| Job-level field data capture | No, monthly totals only | No | ✅ Yes |
For a demolition business that wants a one-page monthly KPI review without paying for a project platform, this Google Sheets scorecard sits in the sweet spot.
👥 Who This Template Is For, and Who It’s Not For
✅ This template is built for:
- Owners and operations managers at demolition contractors who review performance once a month
- Finance leads tracking gross margin, salvage income and cost variance against budget
- Project managers who want safety, schedule, plant and environmental figures on one shared page in Google Drive
❌ This template is NOT for:
- Teams that need job-by-job, daily or crew-level logging; the file works on monthly totals
- Anyone looking for a safety management, asbestos, permit or regulatory compliance system; this is a reporting scorecard, not a record of compliance
- Businesses that want several years of history in one file; each copy covers one Jan to Dec year
⚙️ How to Use the Scorecard
- Open the PDF in your download and click the Google Sheets link, then choose Make a copy to save your own editable version in Google Drive.
- Fix the month list once: on the Scorecard tab select cell N1, open Data > Data validation, and change “June” and “July” to “Jun” and “Jul”.
- Review the KPI Definition sheet and rename KPIs, units, formulas or UTB/LTB types to match your business.
- Keep KPI names identical in Input Data column A, because the cards look figures up by name.
- Replace the sample MTD and YTD Actual, Target and PY figures in Input Data with your own.
- On the Scorecard, pick a month, MTD or YTD, and Target or PY, then open KPI Trend and select a KPI to see its 12-month history.
💼 Real-World Use Cases
Marcus runs a 25-person demolition contractor. At each month-end review he switches the Scorecard between Target and PY to see whether Structure Takedown Rate and On-Time Project Completion are improving year on year, and he shares the link with his site supervisors instead of emailing spreadsheets.
Priya is the finance lead at a regional wrecking and salvage firm. She watches Gross Margin per Project, Salvage Revenue Recovery and Cost Variance vs Budget in YTD mode, and uses the red Salvage Revenue light as the prompt to review scrap pricing with the yard team.
Tom manages projects for an interior strip-out company. He tracks Waste Diversion Rate and Dust and Noise Complaints next to Equipment Uptime so that environmental results sit on the same page as productivity at every client update.
❓ Frequently Asked Questions
What KPIs does this demolition scorecard track?
It tracks 10 KPIs: Total Recordable Incident Rate, Safety Training Compliance, On-Time Project Completion, Structure Takedown Rate, Equipment Uptime, Gross Margin per Project, Salvage Revenue Recovery, Cost Variance vs Budget, Waste Diversion Rate and Dust and Noise Complaints. Each has a unit, formula, definition and UTB or LTB type you can edit.
Is this the KPI Scorecard or the KPI Dashboard?
This listing is the Google Sheets KPI Scorecard: 10 traffic-light cards with a month picker, MTD/YTD and Target/PY switches, plus a KPI Trend page. The KPI Dashboard and the analytical dashboards are separate products with different layouts and page counts.
How long does setup take?
Making your copy takes under a minute. Fixing the June and July drop-down entries takes about a minute more. After that, setup time is simply how long it takes to type 12 months of MTD and YTD figures for your 10 KPIs into the Input Data sheet.
Can I change the red, amber and green thresholds?
Yes, but not from the Color Settings tab, which is not linked to the cards in this build. The bands are the small RAG table in the Support tab (cells Z4:AE6): at or below 0% variance, up to 10%, and above 10%. Edit those cells and all 10 lights follow.
How does this compare to Procore or Buildertrend?
Procore and Buildertrend are subscription project platforms that capture job-level field data. This scorecard is a one-time $8.99 Google Sheets file for monthly KPI reporting only. It suits firms that already have their numbers and want a clear monthly review without per-seat fees.
Is this a safety or compliance tool?
No. It reports monthly figures that you enter, such as incident rate and training compliance. It does not record incidents, asbestos surveys, permits or inspections, and it is not evidence of regulatory compliance. The supplied figures are fictional sample data.
👤 About the Author
Built by PK, Microsoft Certified Professional with 15+ years of Excel, Google Sheets and Power BI experience. Founder of NextGenTemplates, reaching 300K+ subscribers across YouTube channels (@PKAnExcelExpert, @NextGenTemplates, @NeoTechNavigators). Every template is hand-built and tested before release.
🔗 Explore Related Templates
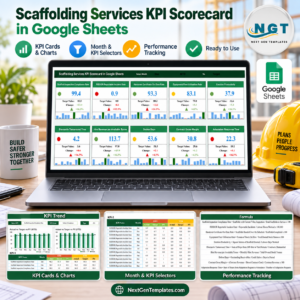
🏗️ Running a wider construction portfolio? The Scaffolding Services KPI Scorecard in Google Sheets, Crane Rental KPI Scorecard in Google Sheets and Concrete Contractor KPI Scorecard in Google Sheets use the same month-picker scorecard layout for neighbouring trades.
🧰 Need to manage the jobs themselves? The Demolition Contractor Management System Web App is a separate Apps Script product for day-to-day records, and the Construction Project Timeline in Google Sheets plans the schedule.
📂 Browse every Google Sheets KPI template in the store. Excel editions of this demolition scorecard and dashboard are in preparation.
📘 New to drop-down lists? Google’s own guide explains how to create and edit a drop-down list in Google Sheets.
📖 Click here to read the Detailed Blog Post
🎥 Visit our YouTube channel for step-by-step video tutorials
👉 YouTube.com/@NextGenTemplates
Watch the step-by-step video Demo:
📅 Last updated: September 2026