

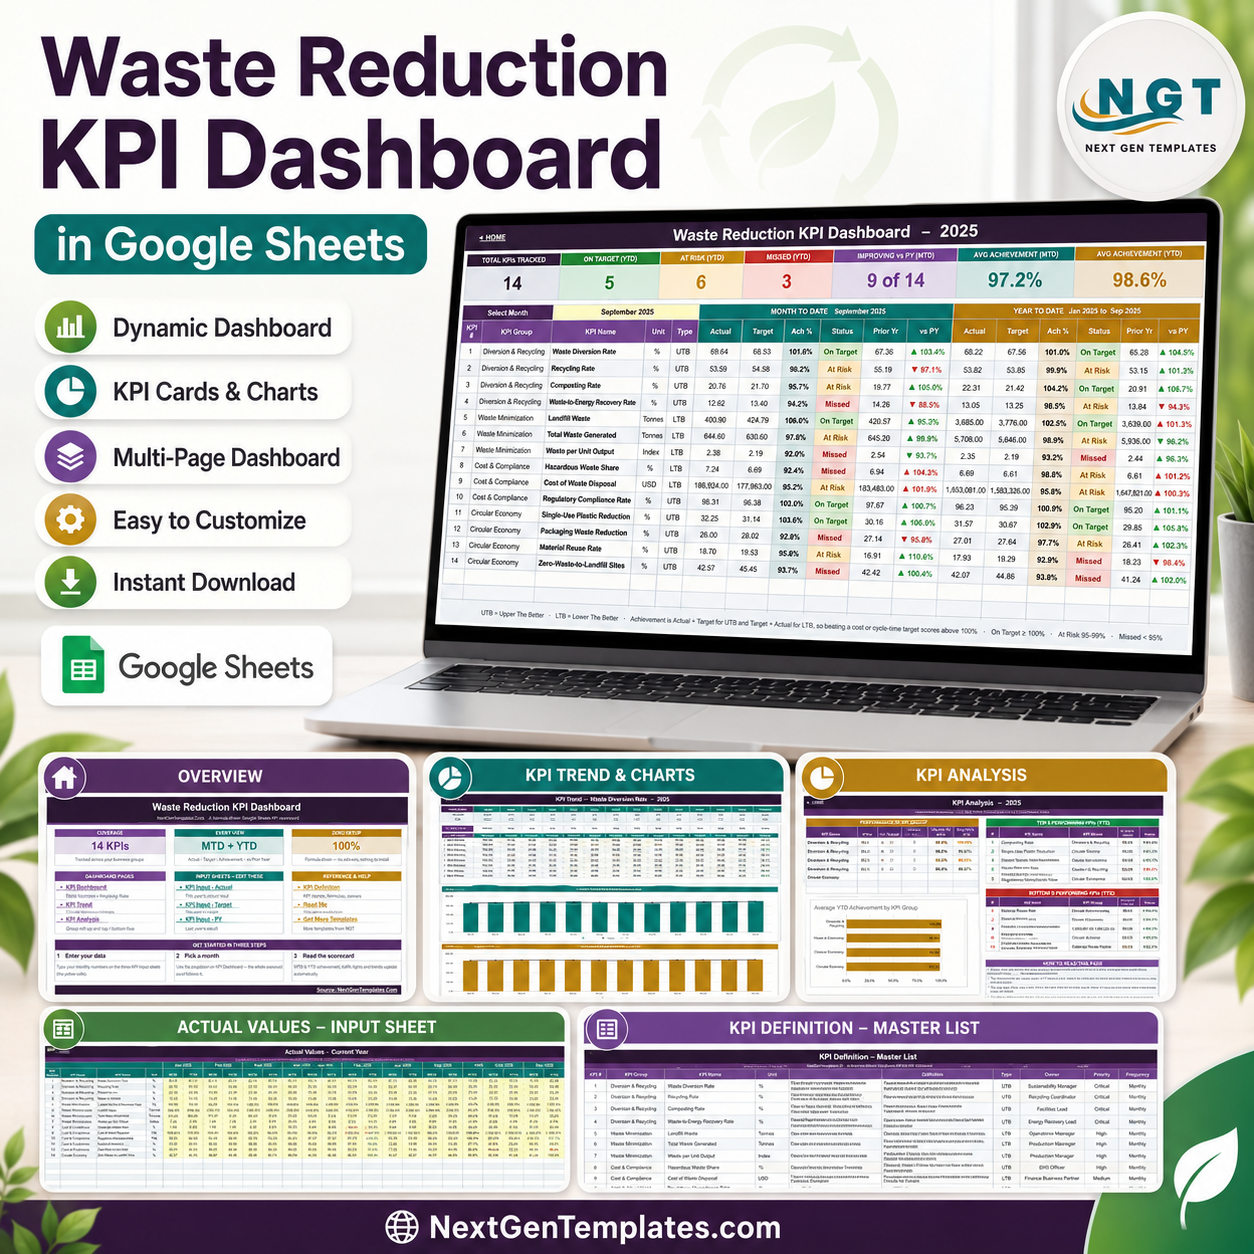
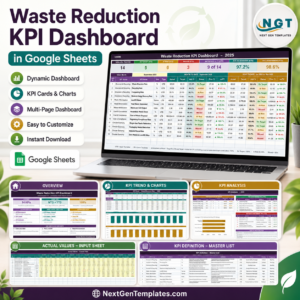
The Waste Reduction KPI Dashboard in Google Sheets tracks 14 waste and circular-economy KPIs across 4 KPI groups, month to date and year to date, on a single scorecard page. The sample file ships with a full 12-month year: pick September 2025 and it reports 97.2% average MTD achievement, 98.6% YTD, 5 KPIs On Target, 6 At Risk and 3 Missed, with 9 of 14 improving against last year. Everything is plain Google Sheets formulas – no add-ons, no Apps Script, no refresh button – so it opens on a free Google account in about a minute. One-time payment, instant download, lifetime access to your own copy, and no subscription. This is a manual tracking template for figures you type in yourself, not a reporting or certification service.Waste Reduction KPI Dashboard in Google Sheets
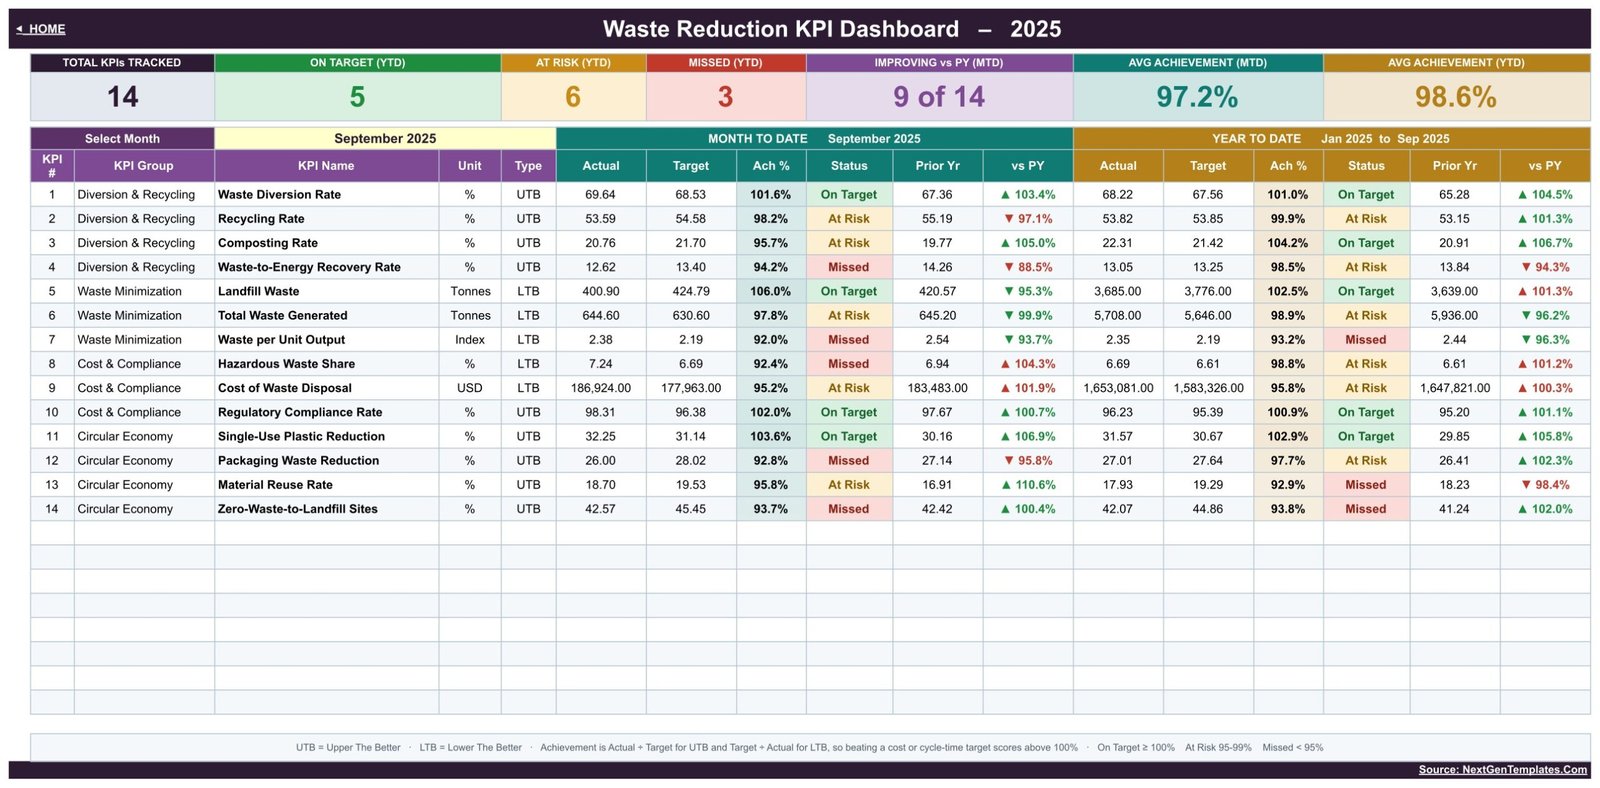
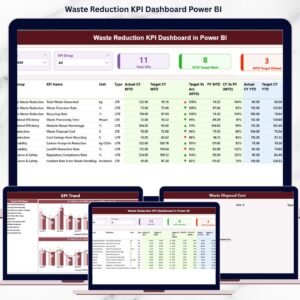
This is the KPI scorecard family – a month picker, traffic lights, a KPI Trend page and a KPI Analysis page. It is not the analytical waste dashboard with slicers and charts across the top; if you want that style instead, the Environmental Services Dashboard in Google Sheets is the analytical cousin, and the Waste Reduction KPI Dashboard in Power BI is the same subject on a different platform.Waste Reduction KPI Dashboard in Google Sheets
Key Features of the Waste Reduction KPI Dashboard in Google Sheets
- 14 KPIs, four groups. Diversion & Recycling (4), Waste Minimization (3), Cost & Compliance (3) and Circular Economy (4) – from Waste Diversion Rate and Recycling Rate through to Material Reuse Rate and Zero-Waste-to-Landfill Sites.
- MTD and YTD in one row. Each KPI shows Actual, Target, Achievement %, Status, Prior Year and vs PY for the month, then the same six columns cumulatively for the year.Waste Reduction KPI Dashboard in Google Sheets
- Seven header cards. Total KPIs Tracked, On Target, At Risk, Missed, Improving vs PY, Average Achievement MTD and Average Achievement YTD recalculate as you type.
- Correct maths for lower-is-better KPIs. Achievement is Actual divided by Target for upper-the-better KPIs and Target divided by Actual for lower-the-better ones, so beating a landfill-tonnage or disposal-cost target scores above 100% instead of below it.
- Editable thresholds. On Target starts at 100%, At Risk covers 95-99% and Missed is below 95%. Change the numbers in the Status formulas and every page follows.
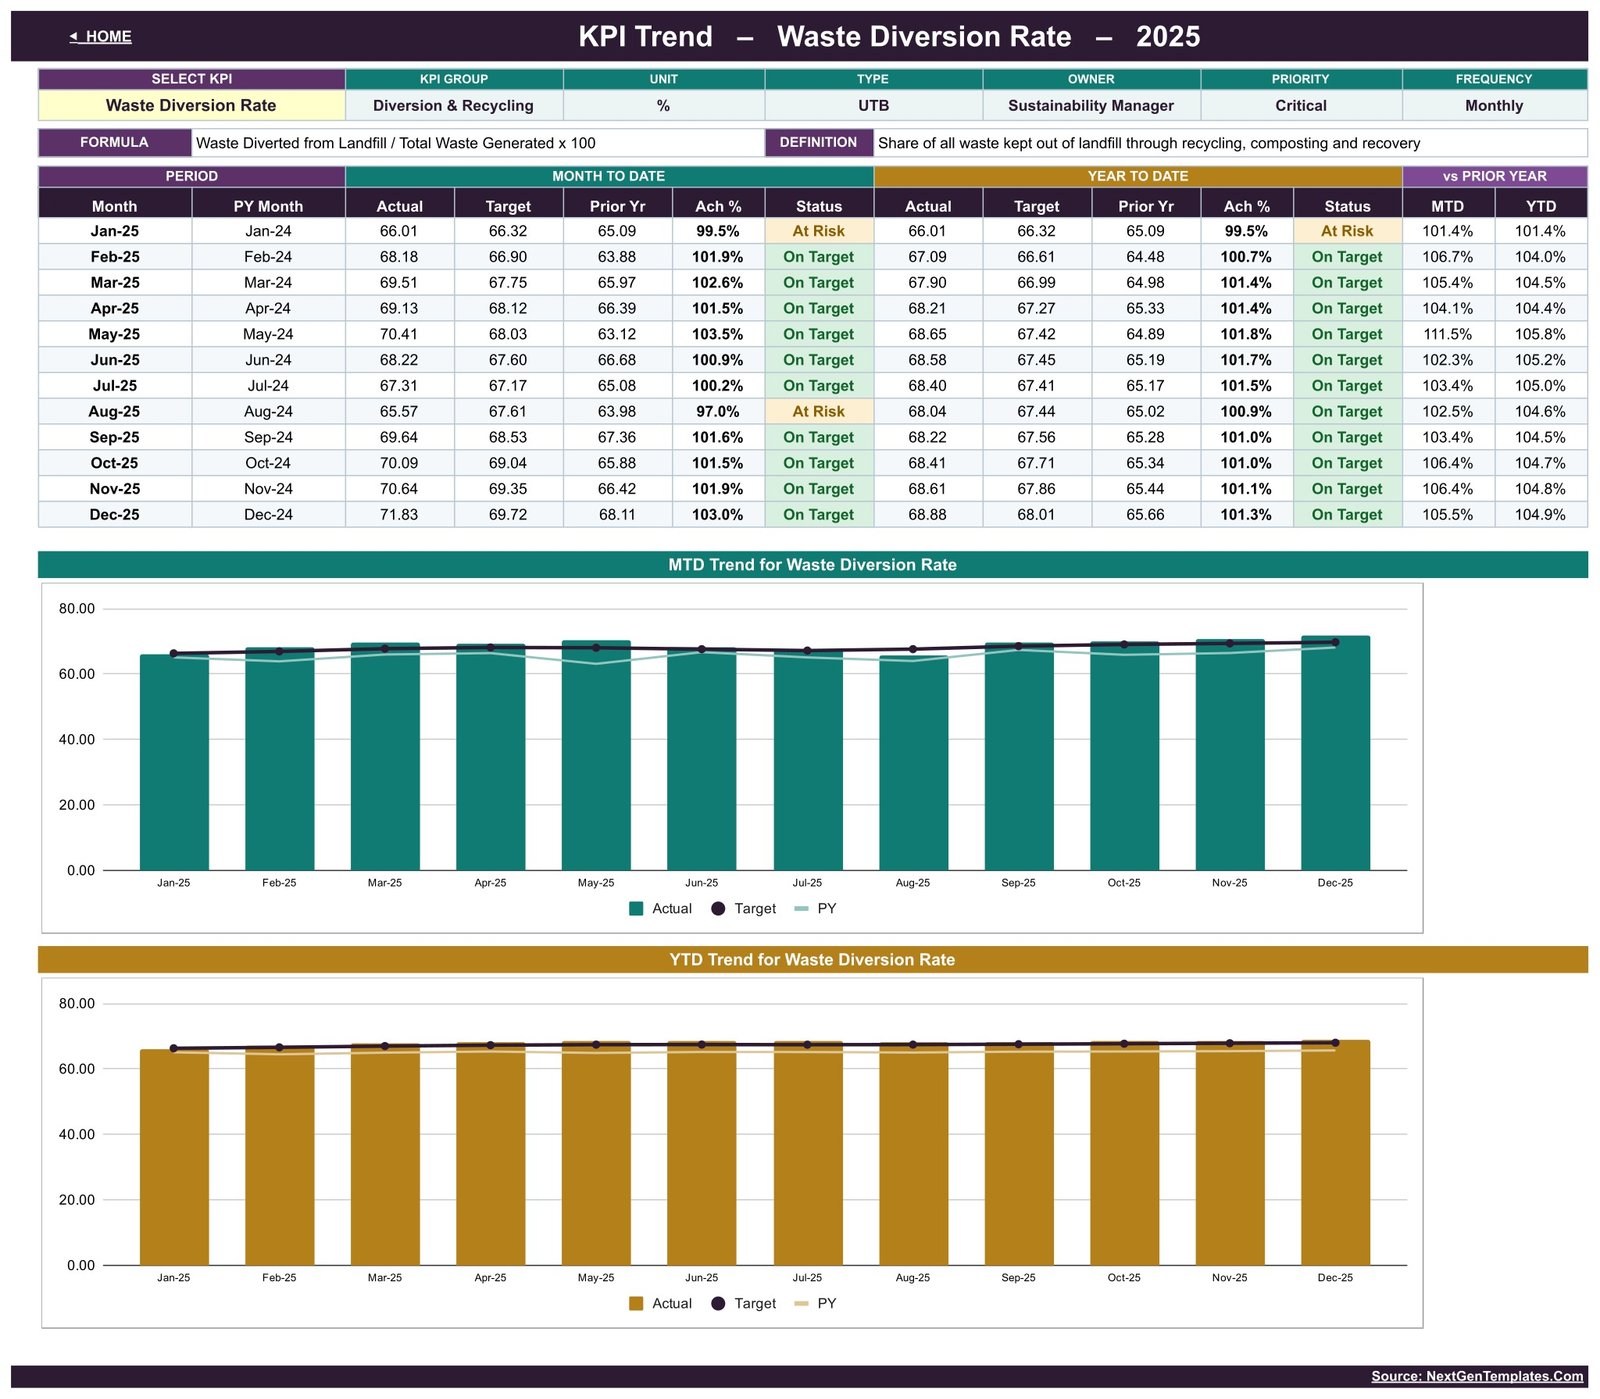
- A trend page per KPI. Choose any KPI from the dropdown and get twelve monthly rows plus two charts, each plotting Actual, Target and prior year.
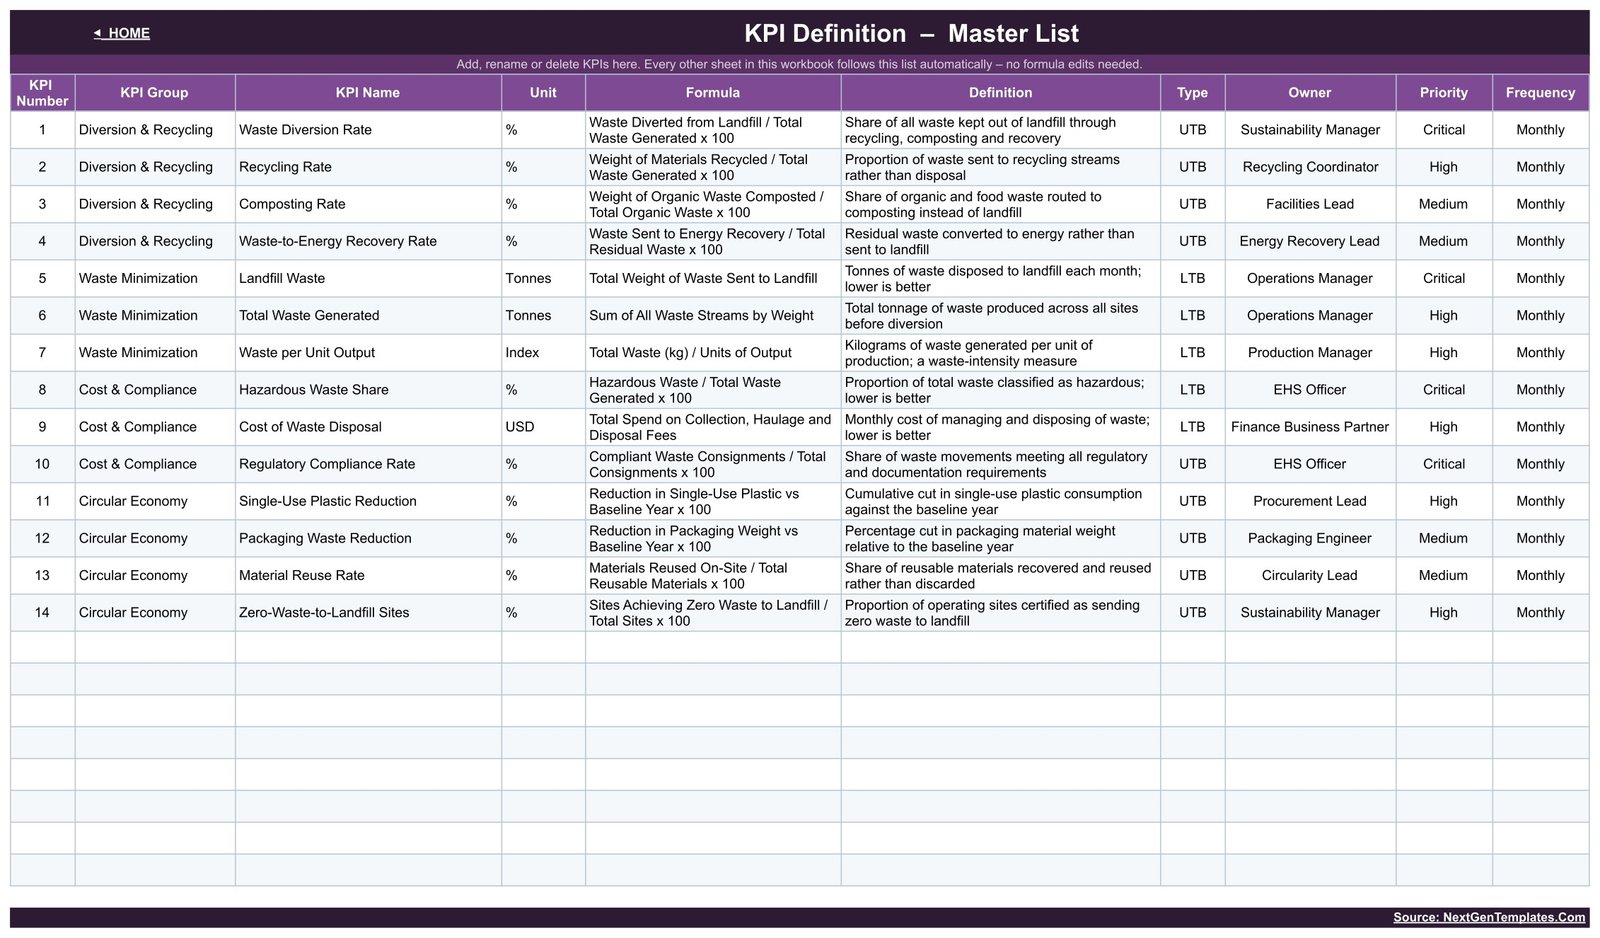
- Ownership built in. The KPI Definition sheet carries the formula, definition, owner, priority and frequency for every metric, so a review meeting has an answer for “who owns this number?”.
What’s Inside the Waste Reduction KPI Dashboard in Google Sheets
Ten tabs, four of which you actually edit.
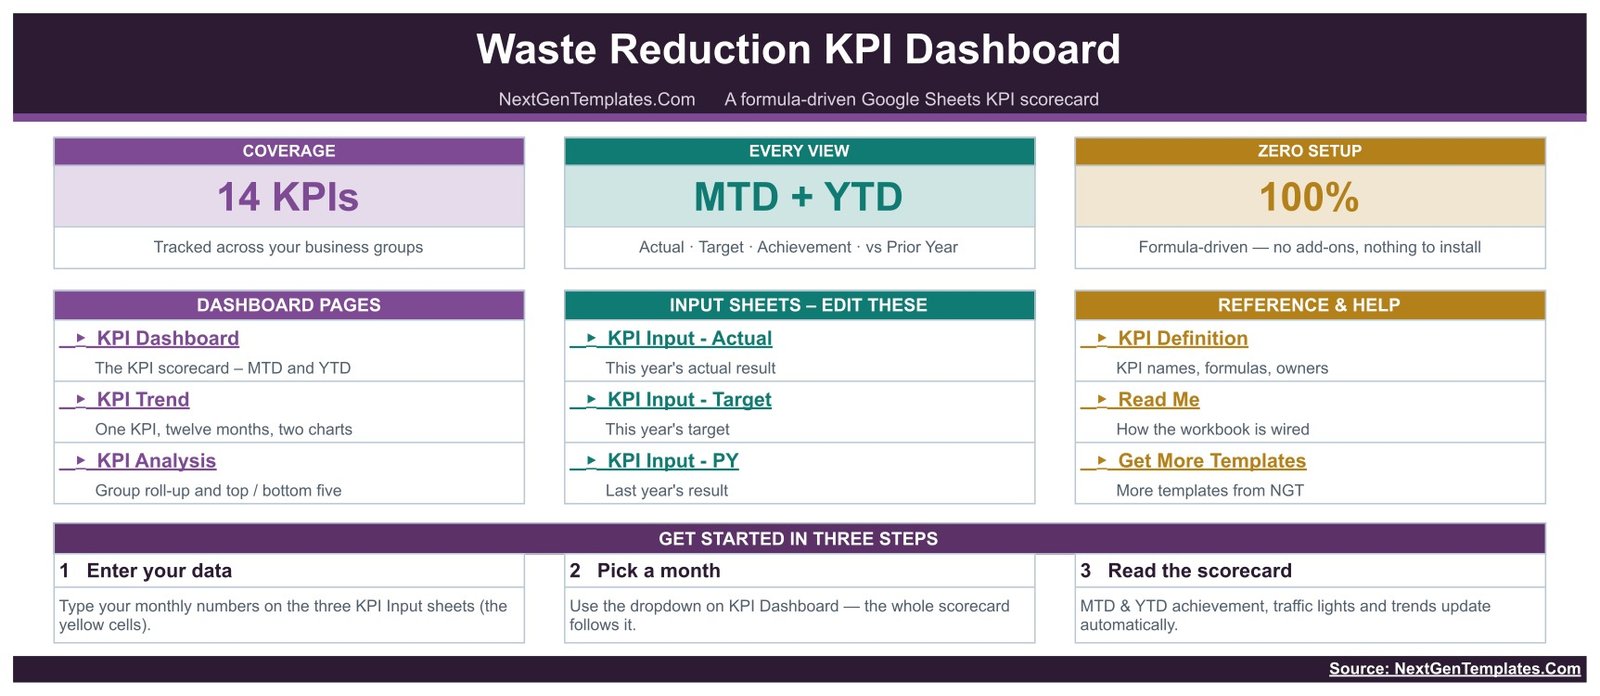
- Home. A launch page with links to every sheet, a 14 KPIs / MTD + YTD / 100% formula-driven summary and a three-step start guide.
- KPI Dashboard. The scorecard. A Select Month dropdown at the top left drives the whole workbook, with the month-to-date block in teal and the year-to-date block in gold.
- KPI Trend. One KPI at a time – the sample opens on Waste Diversion Rate, owned by the Sustainability Manager, Critical priority, monthly – with a twelve-month table and the MTD Trend for Waste Diversion Rate and YTD Trend for Waste Diversion Rate charts underneath.
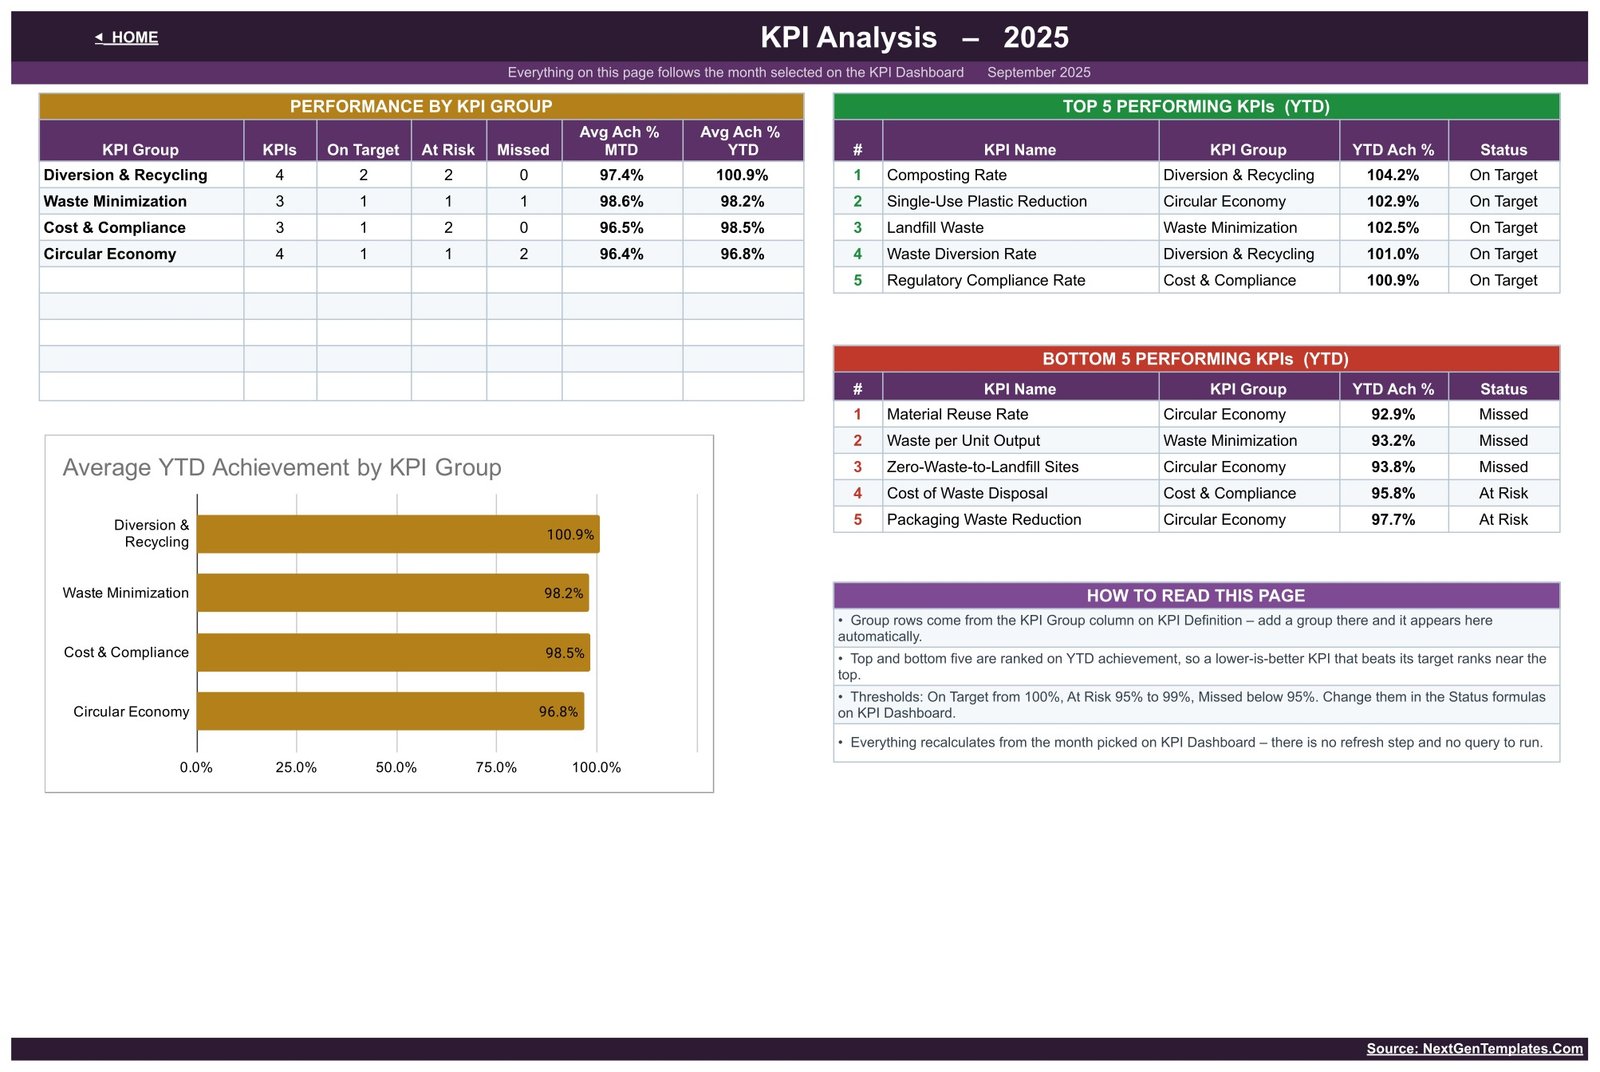
- KPI Analysis. Performance by KPI Group, Top 5 and Bottom 5 Performing KPIs on YTD achievement, and an Average YTD Achievement by KPI Group bar chart.
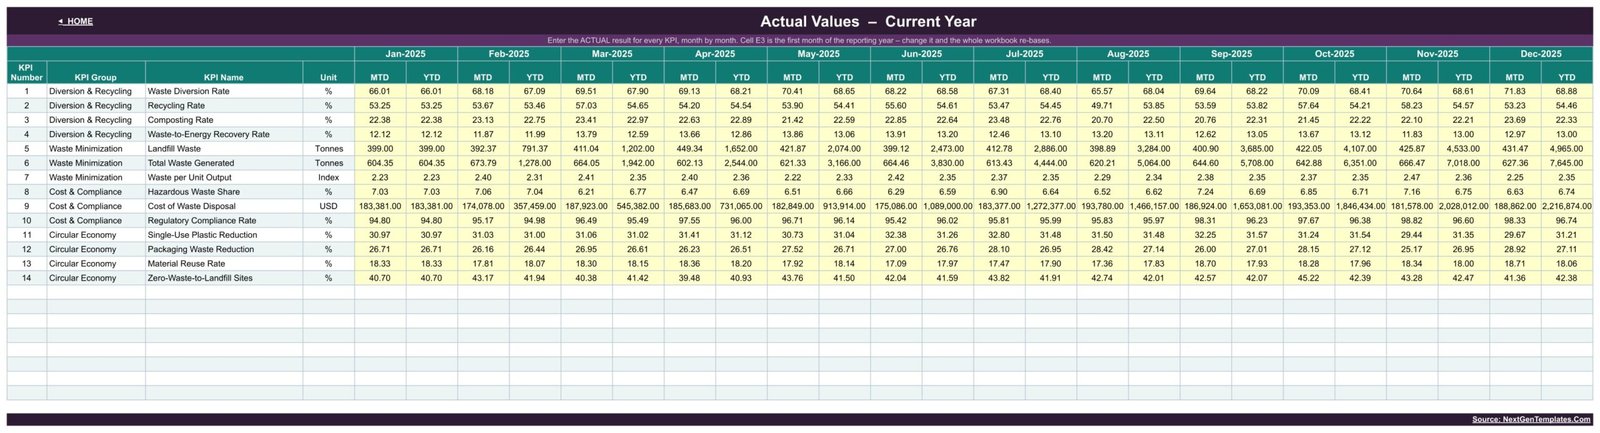
- KPI Input – Actual, KPI Input – Target, KPI Input – PY. Three identical grids – this year’s result, this year’s target, last year’s result – with MTD and YTD columns for each of the twelve months. The yellow cells are the only ones you type in.
- KPI Definition. The master list. Add a row here and it appears on every other sheet automatically.
- Read Me and Get More Templates.
Waste Reduction KPI Dashboard vs. Excel vs. Paid Sustainability Software – Where This Fits
| This template (Google Sheets) | An Excel KPI workbook | Paid EHS / sustainability software | |
|---|---|---|---|
| Cost | 8.99 once | Similar one-off price, plus Microsoft 365 | Typically 200-1,500+ per month |
| Platform | Browser, free Google account | Desktop Excel | Vendor web app |
| Setup time | Minutes – copy the sheet and type your numbers | Minutes, once the file is shared | Weeks of onboarding and data mapping |
| Real-time team collaboration | Yes, native multi-user editing | Only through OneDrive co-authoring | Yes |
| Mobile access | Google Sheets app | Excel mobile | Vendor app |
| Customizable KPIs | Yes – edit the KPI Definition sheet | Yes, if you know the formulas | Limited to the vendor’s metric library |
| Share with a link | Yes | No – file attachment or cloud sync | Yes, per licensed seat |
| Year-1 cost at 5 users | 8.99 | 8.99 plus existing licences | 2,400-18,000+ |
| KPI count out of the box | 14, in four groups | Varies | Hundreds, most irrelevant to you |
| Regulatory reporting | No – you enter and interpret your own figures | No | Often included |
Who This Template Is For – and Who It’s Not For
A good fit for sustainability and EHS leads at a single site or a small group of sites, facilities and operations managers who already collect waste tonnages from their haulier, procurement teams chasing packaging and single-use plastic reduction, and finance partners who want disposal cost tracked next to the tonnage that drives it. It suits a team that reports waste performance monthly in a meeting rather than continuously.
Not a good fit if you need audited or certified figures, a formal disclosure under a named reporting framework, automated meter or weighbridge feeds, per-bin sensor data, or emissions calculations. This workbook does no conversion, applies no emission factors and holds no regulatory logic. The Regulatory Compliance Rate KPI is a percentage you work out and type in – the sheet neither checks nor certifies it. If you need automatic data capture from a waste contractor’s system, buy software.
How to Use the Waste Reduction KPI Dashboard in Google Sheets
- Open the PDF in your download and click the link to create your own copy in Google Drive.
- Open KPI Definition and make the 14 KPIs yours – rename them, change the units, set the owner and priority, delete what you do not measure and add what you do.
- Set the first month of your reporting year in cell E3 of the input sheets if you do not run on a calendar year.
- Type your figures into the yellow cells on KPI Input – Actual, KPI Input – Target and KPI Input – PY.
- Go to KPI Dashboard, pick your month from the dropdown, and read the scorecard.
- Use KPI Trend for the one metric your meeting is arguing about, and KPI Analysis for the group roll-up and the bottom five.
Real-World Use Cases
Priya, Sustainability Manager at a three-site manufacturer. Her haulier sends tonnages on the 5th. She types nine numbers per site into KPI Input – Actual, picks the month, and walks into the operations review with the diversion rate, the landfill trend and the three KPIs that missed – instead of rebuilding a chart deck.
Daniel, Facilities Lead for a retail chain’s head office. He tracks Composting Rate and Single-Use Plastic Reduction against a baseline year. The vs PY column is the only argument he needs when someone claims the coffee-cup scheme changed nothing.
Ana, Finance Business Partner. She owns Cost of Waste Disposal. Because the template scores lower-is-better KPIs properly, coming in under budget shows as achievement above 100%, and she can put the cost line and the tonnage line in front of the same committee.
Frequently Asked Questions
Does this template make my organisation compliant with waste or environmental regulations?
No. It is a manual tracking and visualisation spreadsheet for numbers you enter yourself. It does not perform regulatory reporting, does not implement any named reporting or certification standard, does not produce audited figures and does not calculate emissions.
Is this the KPI scorecard or the analytical waste dashboard?
The scorecard. You get a month picker, traffic-light statuses, a per-KPI trend page and a group analysis page. The chart-led analytical dashboards are separate products with near-identical names, so check the screenshots before you buy.
Can I change the 14 KPIs to my own?
Yes. The KPI Definition sheet is the master list – rename, add or delete rows there and the scorecard, trend, analysis and input sheets follow automatically. You do not need to touch a formula.
Do I need Excel or any paid add-on?
No. It runs entirely on Google Sheets formulas with a free Google account. There is no Apps Script, no add-on, no connector and no refresh step.
How do lower-is-better KPIs like landfill tonnage work?
They are marked LTB on the KPI Definition sheet and scored as Target divided by Actual, so sending less waste to landfill than you planned produces an achievement above 100%.Waste Reduction KPI Dashboard in Google Sheets
What do I actually download?
A PDF containing the Google Sheets link. Open it, click through, and use File > Make a copy to get your own editable copy in your Drive. Nothing is shared with anyone else.Waste Reduction KPI Dashboard in Google Sheets
Can my team edit it at the same time?
Yes – it is an ordinary Google Sheet, so normal sharing and simultaneous editing apply once you have made your copy.Waste Reduction KPI Dashboard in Google Sheets
About the Author
Built by PK – Microsoft Certified Professional with 15+ years of Excel, Google Sheets, and Power BI experience. Founder of NextGenTemplates, reaching 300K+ subscribers across YouTube channels. Every template is hand-built and tested before release.Waste Reduction KPI Dashboard in Google Sheets
Explore Related Templates
- Carbon Footprint KPI Dashboard in Google Sheets – the same scorecard layout for energy and emissions tracking.
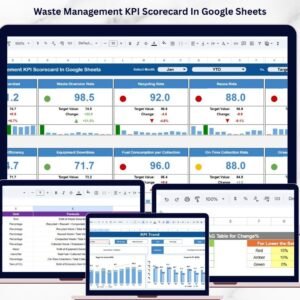
- Waste Management KPI Scorecard in Google Sheets – collection and haulage side of the same problem.
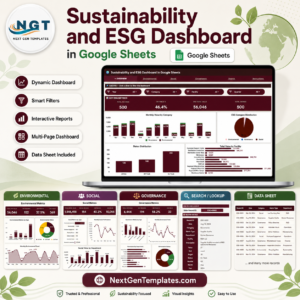
- ESG Dashboard in Google Sheets – the wider environmental, social and governance picture.
- Renewable Resource KPI Dashboard in Google Sheets – the closest sibling scorecard, for material and energy sourcing.
- Climate Action KPI Scorecard in Google Sheets – target-setting across a climate programme.
- Browse the full KPI Dashboard in Google Sheets category or every Google Sheets template.
Get the Waste Reduction KPI Dashboard in Google Sheets – one payment, instant download, your own editable copy in Google Drive in under a minute. A full walkthrough is on the blog: Waste Reduction KPI Dashboard in Google Sheets.Waste Reduction KPI Dashboard in Google Sheets
Watch the step-by-step video Demo:
Last updated: August 2026.Waste Reduction KPI Dashboard in Google Sheets










Reviews
There are no reviews yet.