


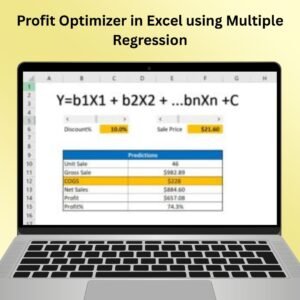
The Profit Optimizer in Excel Using Multiple Regression is a powerful tool designed to help businesses and analysts maximize their profits by using advanced data analysis techniques. This tool leverages multiple regression analysis to identify the relationships between various independent variables and their impact on profit. By understanding how different factors influence profit, users can make informed decisions to optimize business performance.
This Excel-based tool allows you to input your data, run a multiple regression analysis, and generate insights on how various variables affect your bottom line. Whether you’re analyzing pricing, sales volume, marketing spend, or other business metrics, the Profit Optimizer helps you find the best combination of factors to maximize profitability. The tool is ideal for finance professionals, business analysts, and decision-makers looking to use data to improve their business outcomes.

Key Features of the Profit Optimizer in Excel Using Multiple Regression:
📈 Multiple Regression Analysis
Use multiple regression analysis to evaluate how different independent variables, such as price, sales volume, and marketing spend, affect your business profit.
🔍 In-Depth Data Insights
Gain detailed insights into the relationships between variables, helping you understand which factors are most influential in driving profits.
🛠️ Customizable Inputs
Easily input your own data into the template and customize the analysis to fit your specific business model or scenario.
📊 Visual Output
Generate clear visualizations, such as charts and graphs, to present your findings and communicate the impact of each variable on your profit.
📉 Real-Time Optimization
The tool updates in real time as you adjust the data inputs, providing immediate insights and recommendations for optimizing profit.
Why You’ll Love the Profit Optimizer in Excel Using Multiple Regression:
✅ Maximize Profitability – Understand the key factors driving your business profits and optimize them for the best results. ✅ Data-Driven Decisions – Make smarter business decisions based on data and multiple regression analysis. ✅ Customizable and Flexible – Tailor the analysis to your specific business needs and scenarios, whether you’re optimizing pricing or marketing spend. ✅ Clear Visual Insights – Easily interpret complex data with visual charts and graphs that highlight the most impactful variables. ✅ Quick and Easy Setup – The tool is designed to be user-friendly, allowing you to input your data and run analysis with minimal effort.
What’s Inside the Profit Optimizer in Excel Using Multiple Regression:
- Multiple Regression Analysis – Automatically calculates the impact of different variables on your business profit.
- Customizable Data Input – Input your data and adjust it as necessary to model different scenarios.
- Visual Analysis Output – Generate graphs and charts that make it easier to interpret the results of the regression analysis.
- Real-Time Data Updates – The tool updates as you change your input data, providing immediate feedback and insights.
How to Use the Profit Optimizer in Excel Using Multiple Regression:
1️⃣ Download the Template – Get immediate access to the Excel file after purchase. 2️⃣ Input Your Data – Enter the data for the independent variables (e.g., pricing, sales volume, marketing spend) and dependent variable (profit). 3️⃣ Run the Regression Analysis – Use the built-in multiple regression analysis function to evaluate how your variables affect profit. 4️⃣ Analyze the Results – Review the output and interpret the results to see which factors are most influencing your profitability. 5️⃣ Optimize Your Profit – Use the insights to make informed decisions that will help you optimize your profit by adjusting the key factors.
Who Can Benefit from the Profit Optimizer in Excel Using Multiple Regression:
- Business Analysts
- Finance Professionals
- Marketing Teams
- Sales Managers
- Entrepreneurs
- Decision Makers in any business looking to improve profitability through data-driven insights
The Profit Optimizer in Excel Using Multiple Regression is a valuable tool for anyone looking to take control of their business performance and maximize profitability through data analysis. With its user-friendly setup, clear insights, and actionable recommendations, this tool empowers you to make smarter, more informed business decisions.
Click here to read the Detailed blog post
https://www.pk-anexcelexpert.com/profit-optimizer-in-excel-using-multiple-regression/
Visit our YouTube channel to learn step-by-step video tutorials
Watch the step-by-step video tutorial:
Compatibility and Requirements
- Works in Microsoft Excel desktop (Excel 2016 or later, or Microsoft 365).
- You enter your own data for the independent variables and for profit, and the results and charts update in the workbook.
- New to Excel charts? Microsoft explains the basics in Create a chart from start to finish.
Frequently Asked Questions
What does the Profit Optimizer do?
It runs a multiple regression analysis to show how variables such as price, sales volume and marketing spend affect your profit.
What data do I need?
Values for your independent variables, for example pricing, sales volume and marketing spend, plus the dependent variable, which is profit.
Does it show the results visually?
Yes. It produces charts and graphs that show the impact of each variable on profit.
Do the results update when I change the data?
Yes. The tool updates as you change the input data.
Related Profit Analysis Templates
- Profitability Analysis KPI Dashboard in Excel: track profitability KPIs
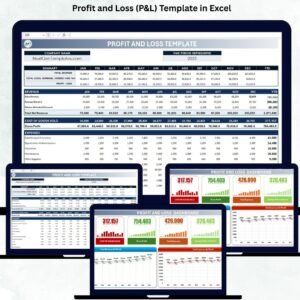
- Profit and Loss (P&L) Template in Excel: build a P&L statement
- Profit Analysis Dashboard using What-if Parameter in Power BI: test profit scenarios in Power BI
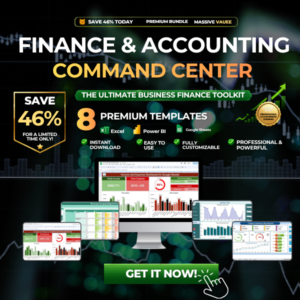
- Finance & Accounting Command Center: 8 finance templates in one bundle
Browse all Excel analysis templates or the Excel financial tools.











Reviews
There are no reviews yet.