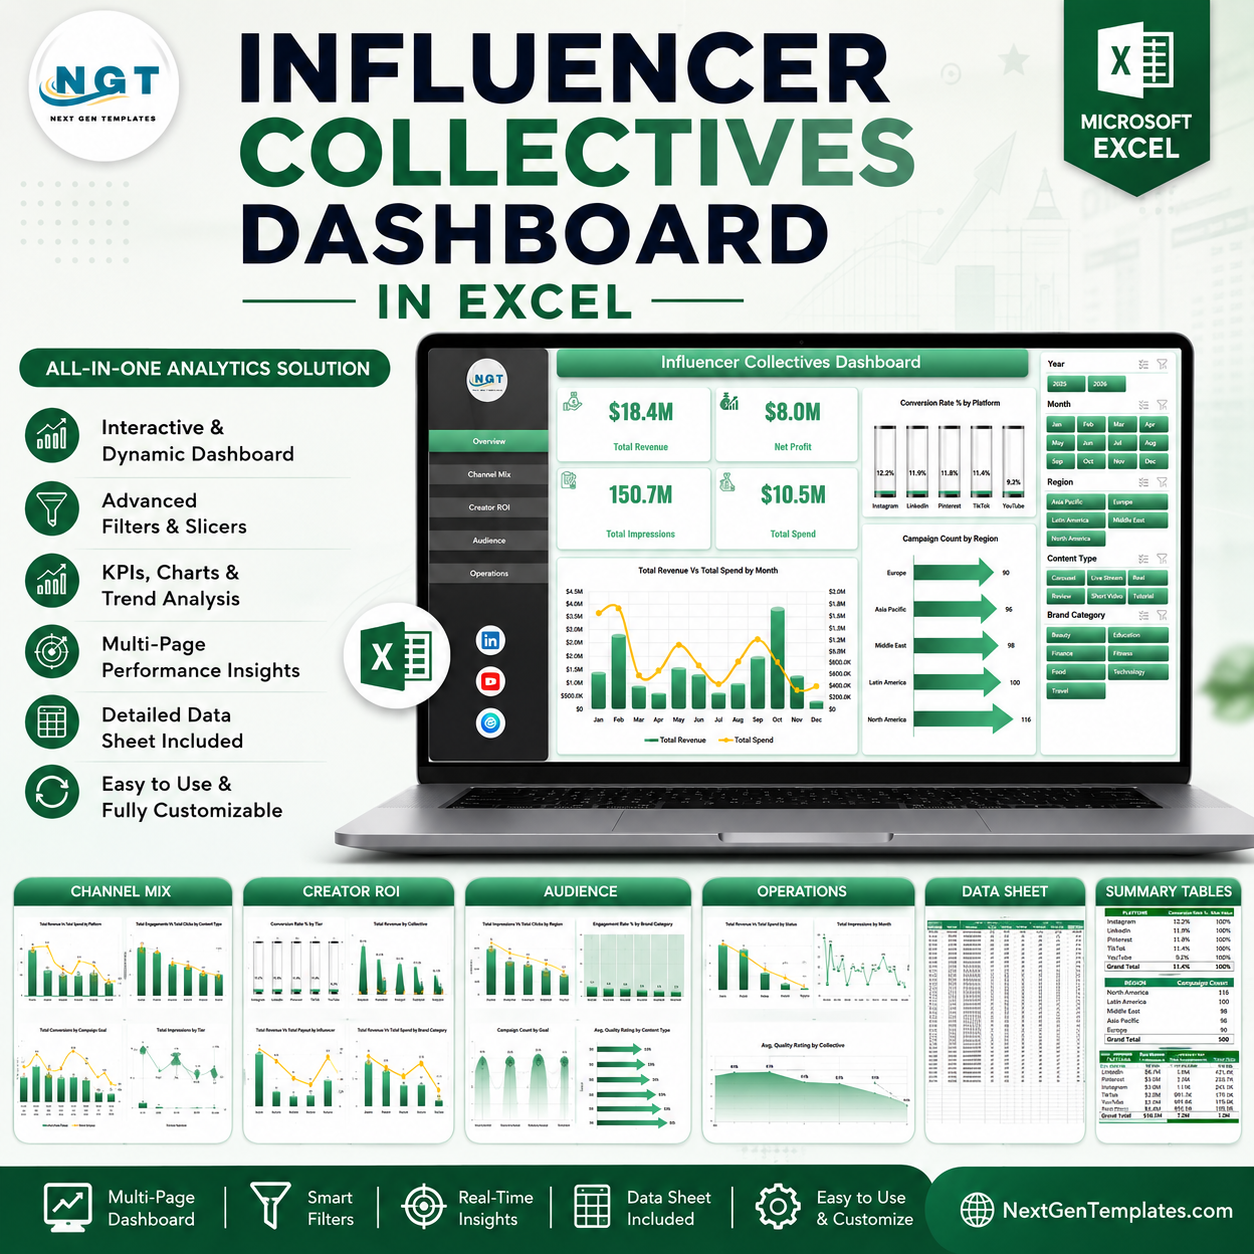


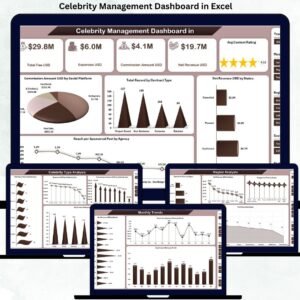
The Influencer Collectives Dashboard in Excel gives creator marketing teams 5 reporting pages, 4 headline KPI cards, 18 analysis charts, slicer-driven filtering, a structured Data sheet, and a hidden Support sheet for pivot-based refresh. With influencer marketing often spanning platforms, regions, tiers, payouts, impressions, clicks, conversions, and brand categories, a plain tracker can hide budget waste quickly. This Excel dashboard turns campaign rows into board-ready views in minutes.
Trusted by 8,400+ teams in 40+ countries using NextGenTemplates. Instant download, one-time payment, no subscription, no per-user fee, and lifetime access.
Key Features of Influencer Collectives Dashboard in Excel
- 4 executive KPI cards for Total Revenue, Net Profit, Total Impressions, and Total Spend.
- 5 dashboard pages covering Overview, Channel Mix, Creator ROI, Audience, and Operations.
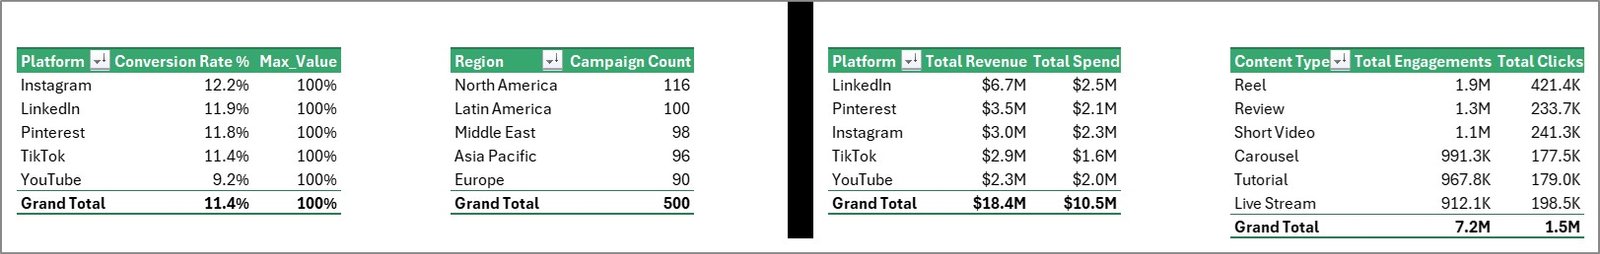
- 18 pre-built charts for revenue, spend, conversion rate, clicks, engagements, campaign counts, quality ratings, and tier performance.
- Interactive slicers to filter the dashboard quickly by campaign fields and review focused segments without rebuilding charts.
- Editable Data sheet where you replace sample rows in the same column structure.
- Pivot-powered Support sheet that keeps the workbook dynamic after using Refresh All in Excel.
What’s Inside the Influencer Collectives Dashboard in Excel
1. Overview Page
The Overview page gives a high-level campaign readout with cards for Total Revenue, Net Profit, Total Impressions, and Total Spend. The Revenue and Spend by Month chart shows whether investment and return are moving together, while Conversion Rate by Platform helps identify the strongest social channels. Campaign Count by Region shows where collective activity is concentrated.
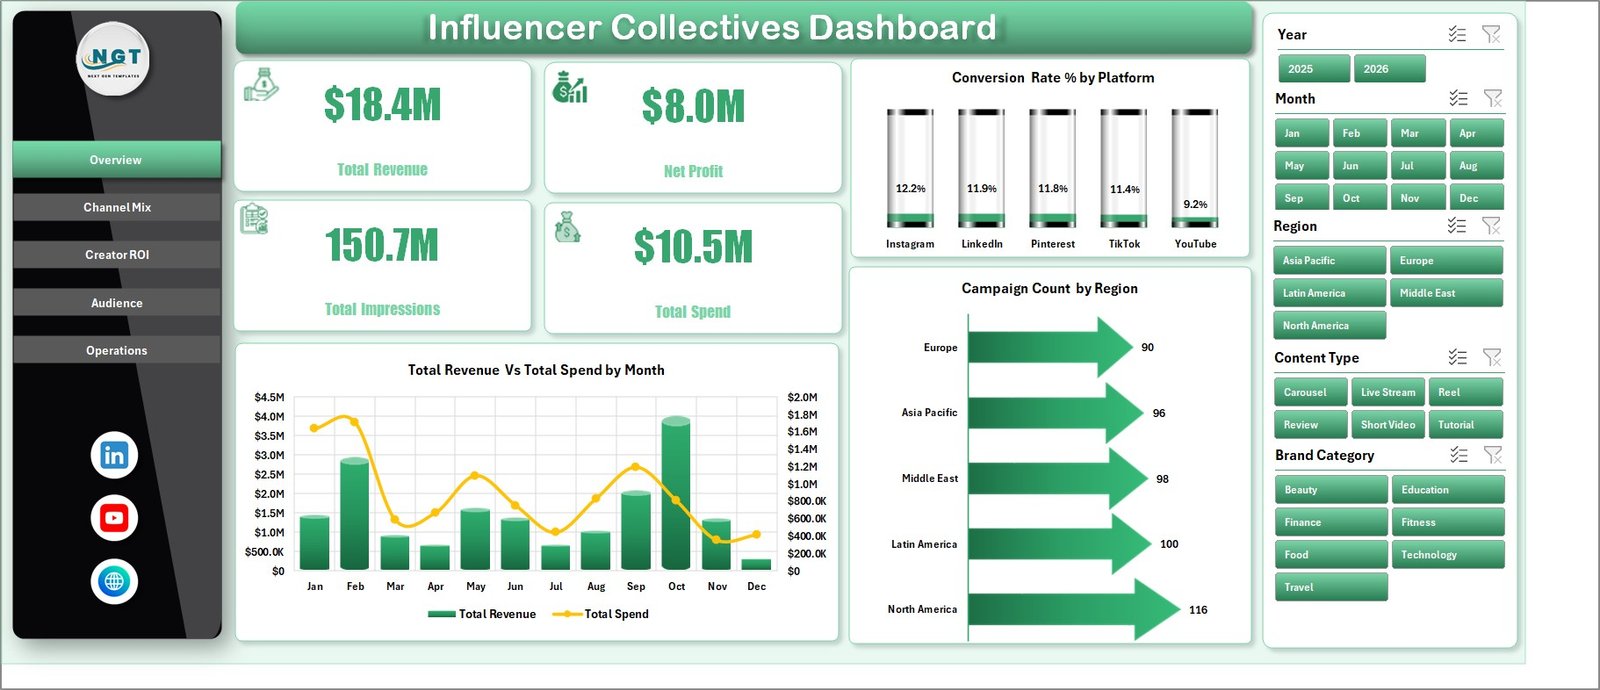
Influencer Collectives Dashboard in Excel
2. Channel Mix
This sheet compares Total Revenue and Total Spend by Platform so you can see which channels justify their budget. It also analyzes Total Engagements and Total Clicks by Content Type, Total Conversions by Campaign Goal, and Total Impressions by Tier.
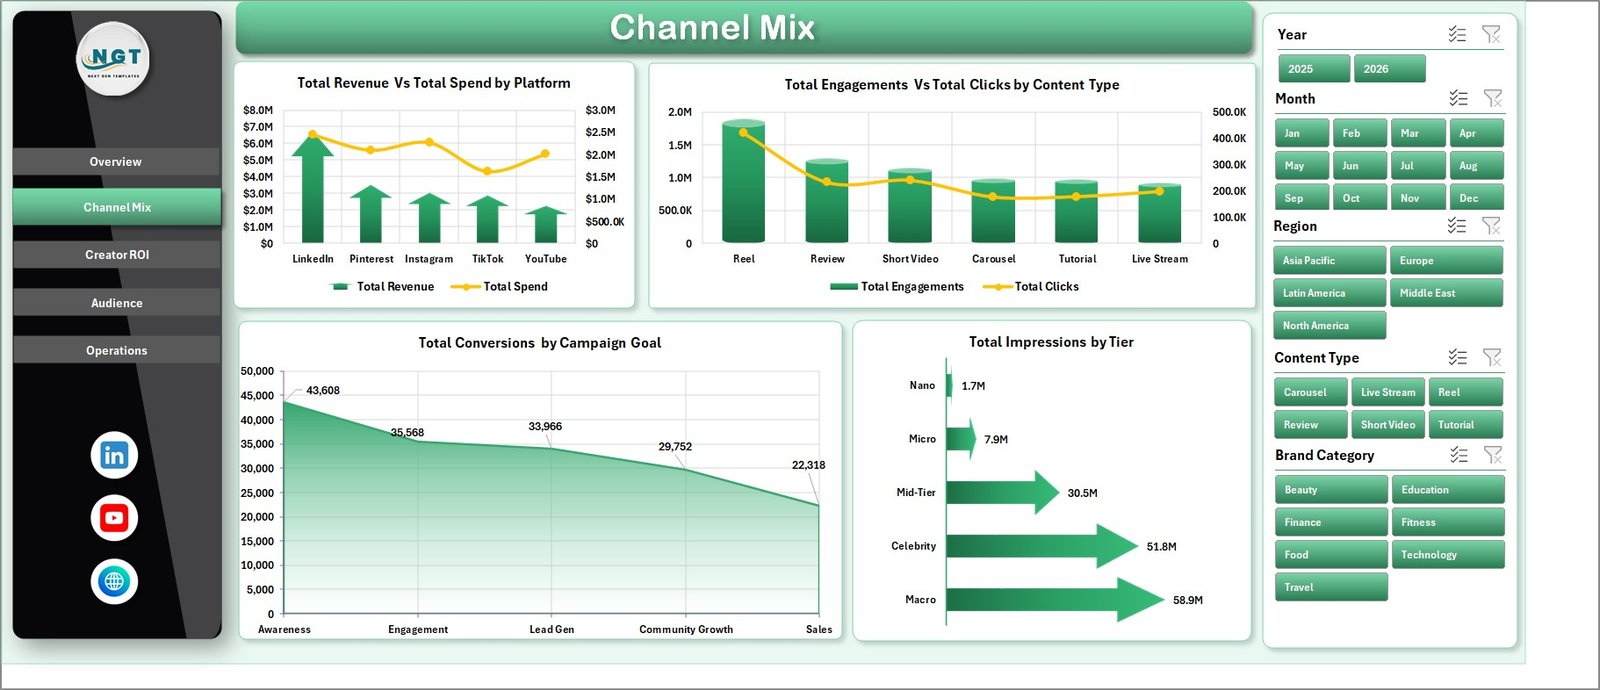
Channel Mix
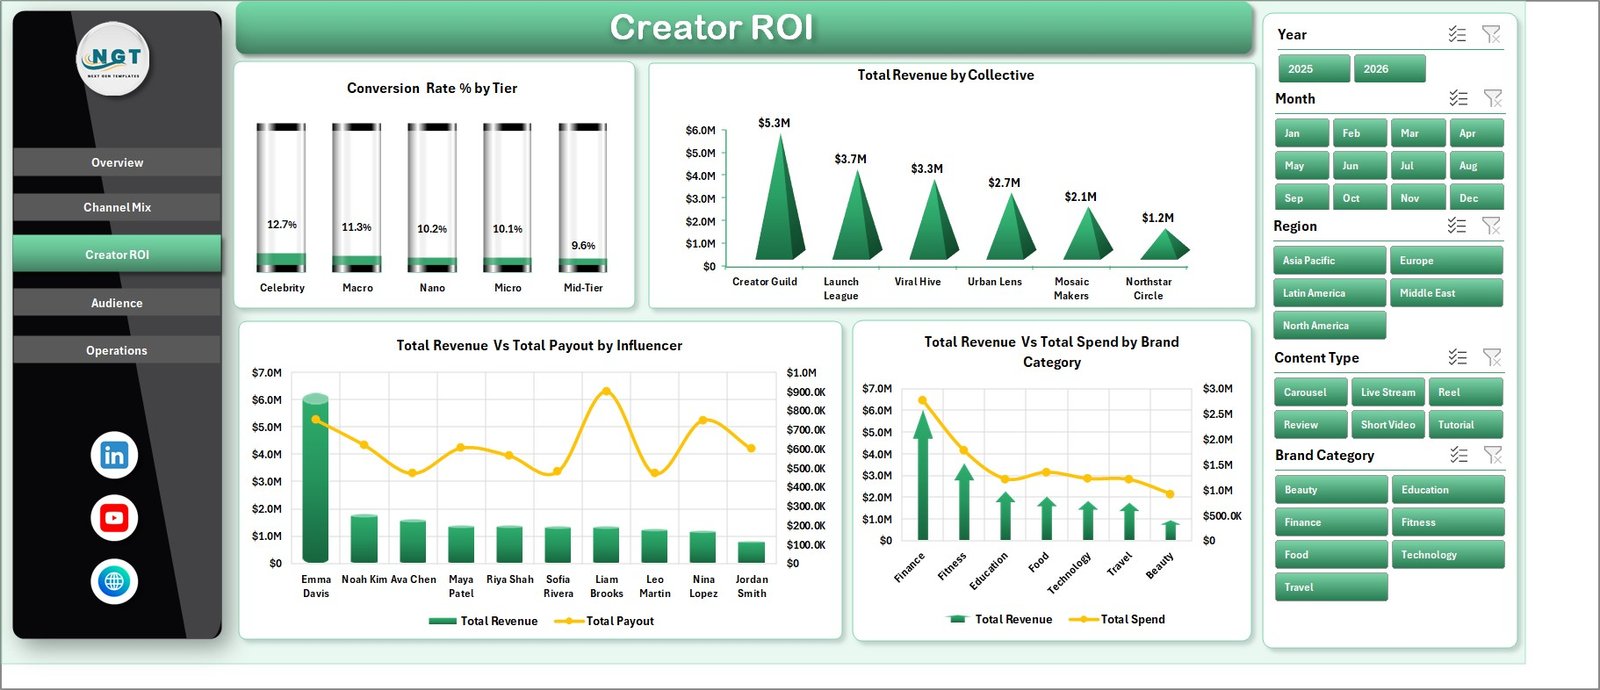
3. Creator ROI
The Creator ROI page focuses on return by creator segment, collective, influencer, and brand category. Conversion Rate by Tier reveals which creator level converts best, while Revenue and Payout by Influencer helps spot creators who earn more than they cost.
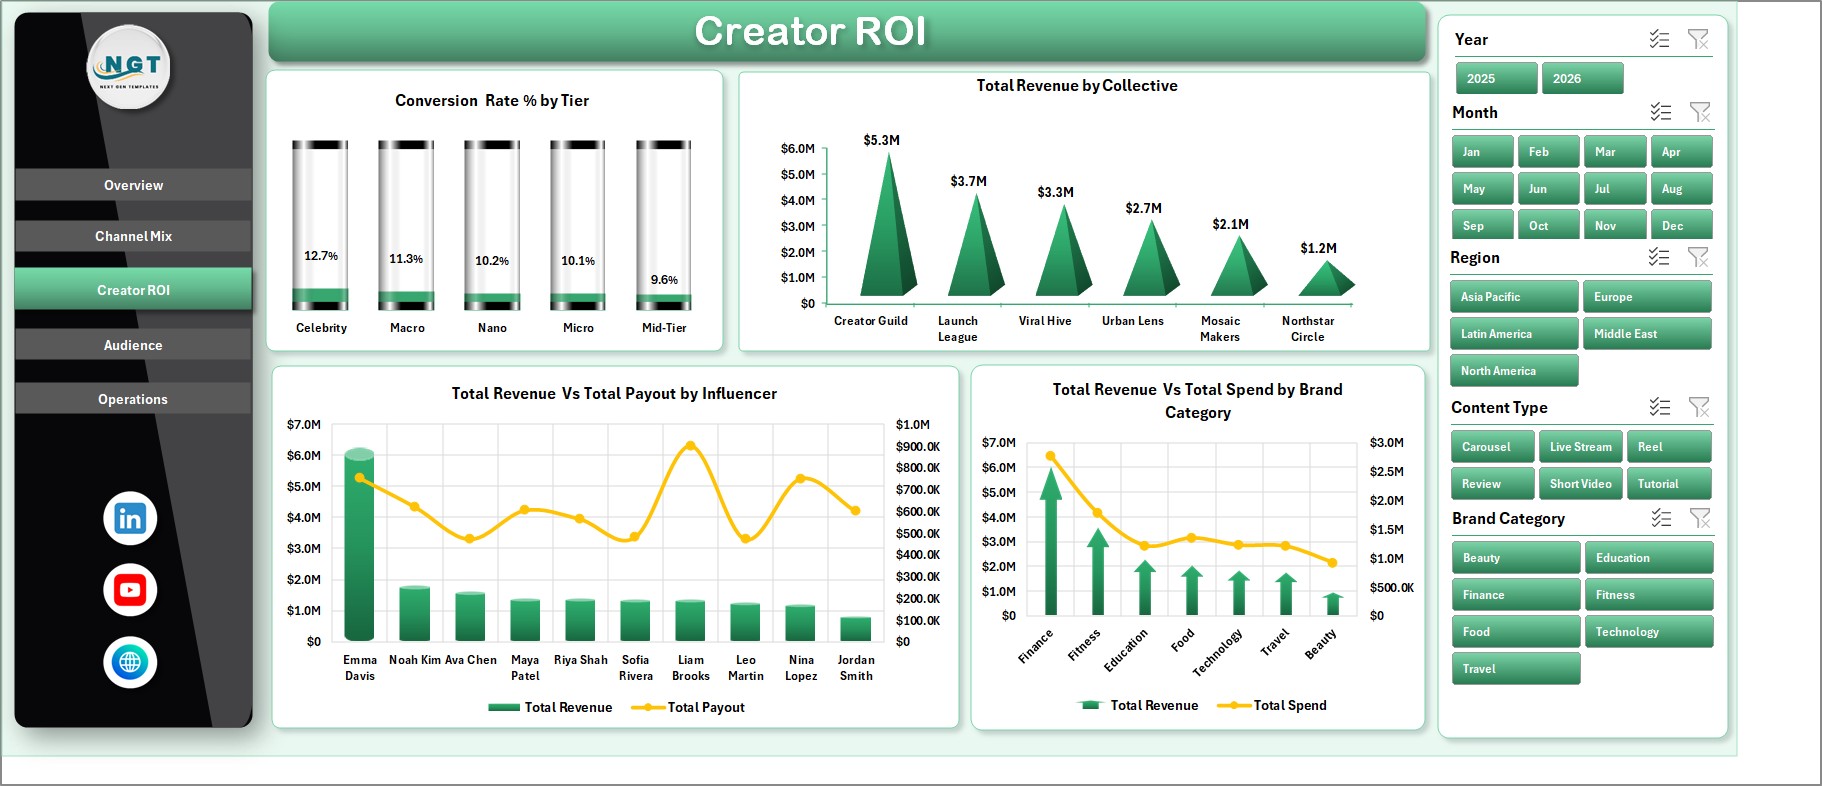
Creator ROI
4. Audience
The Audience sheet shows Total Impressions and Total Clicks by Region to compare reach and traffic. It also includes Engagement Rate by Brand Category, Campaign Count by Campaign Goal, and Avg. Quality Rating by Content Type.
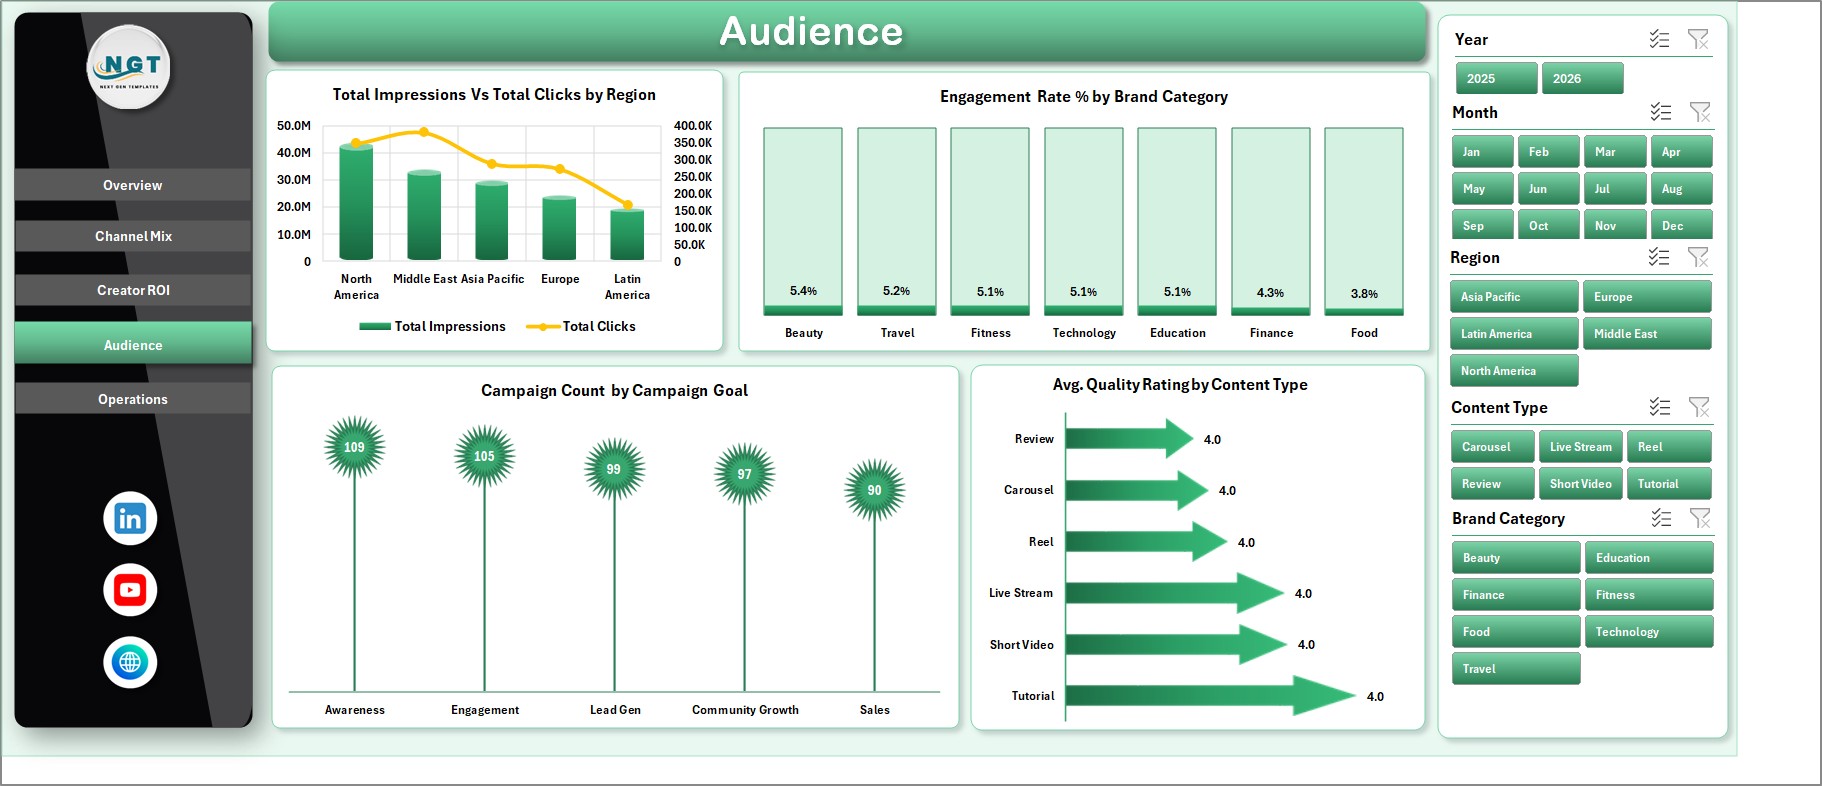
Audience
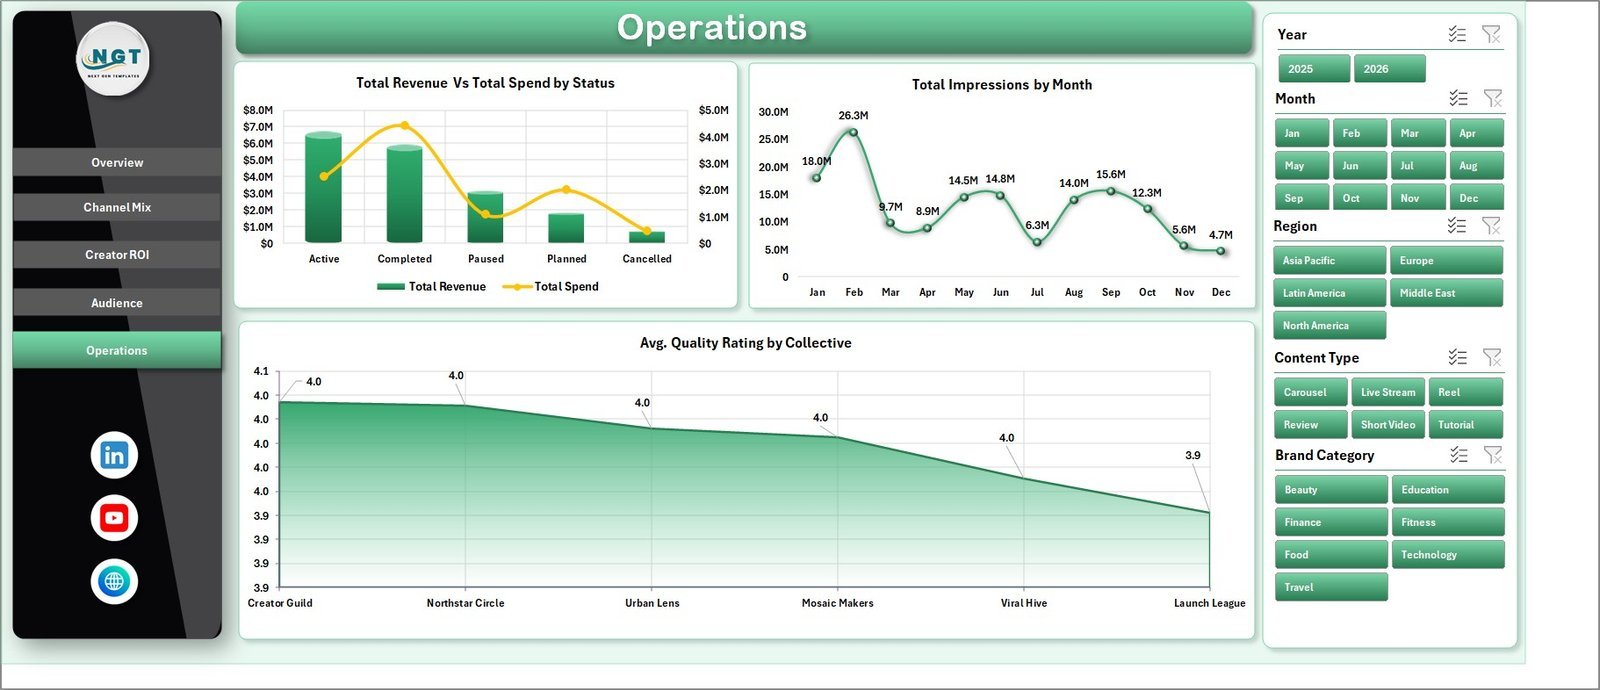
5. Operations
The Operations page helps teams monitor workflow outcomes with Total Revenue and Total Spend by Status. Monthly impressions show delivery momentum, and Avg. Quality Rating by Collective helps compare execution quality across creator groups.
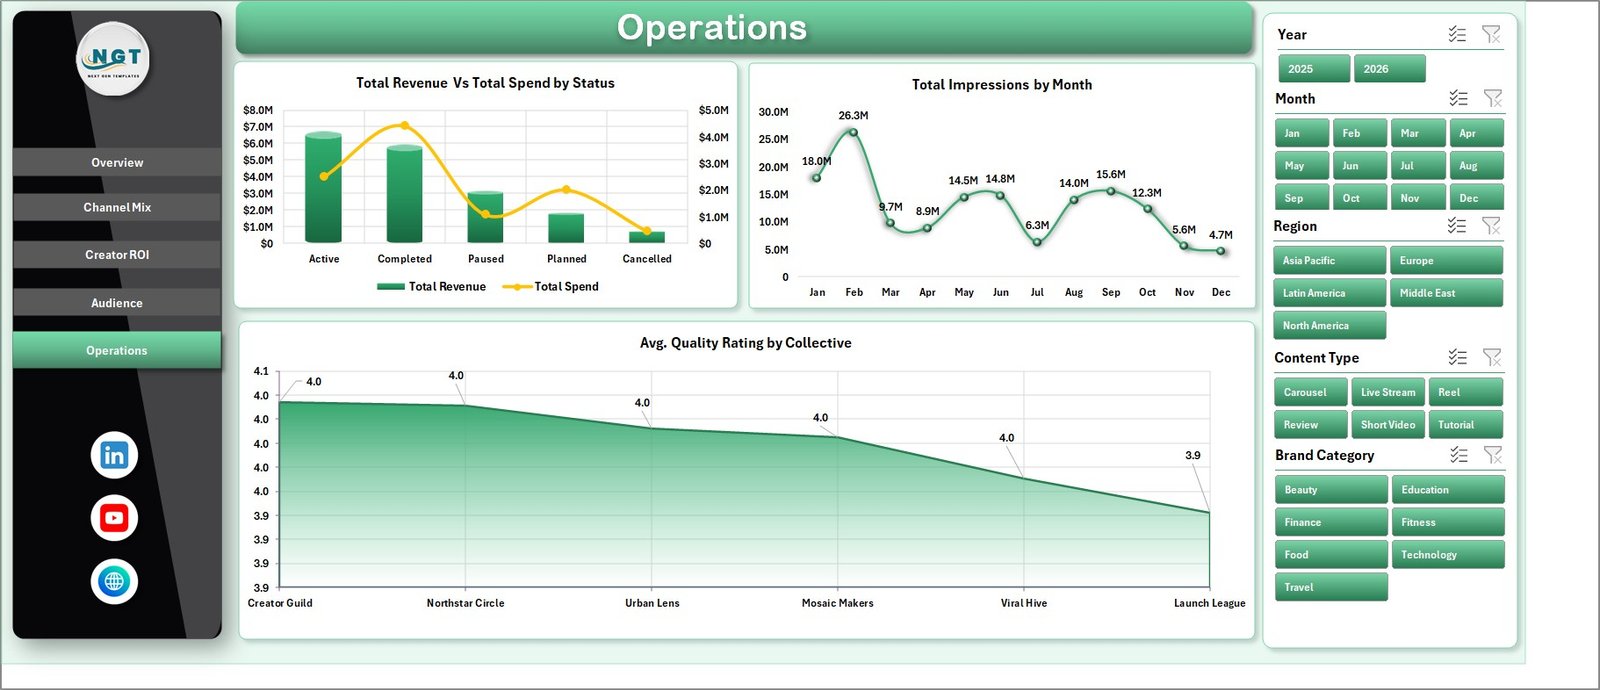
Operations
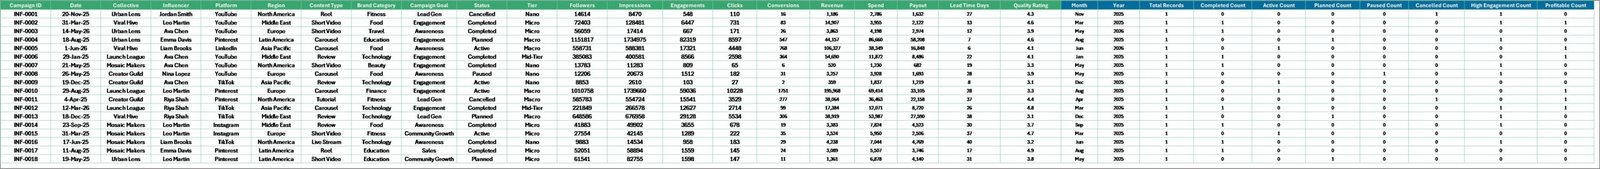
6. Data Sheet Tab
The Data sheet is where you add your own campaign records in the same format as the sample data. Keep the columns consistent, add new rows, then refresh the workbook to update cards, pivots, slicers, and charts.
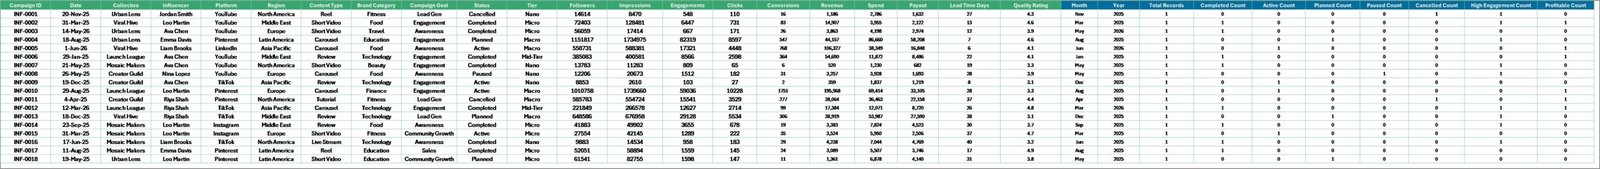
Data Sheet tab
7. Support Sheet
The Support sheet contains the pivot tables used to build the dashboard dynamically. After updating the Data sheet, go to the Excel Data ribbon and click Refresh All. You can keep this sheet hidden during normal use.

Support sheet tab
Influencer Collectives Dashboard in Excel vs. Google Sheets vs. Paid CRM/SaaS – Where This Fits
| Feature | This Excel Dashboard | Google Sheets Alternative | Paid Influencer SaaS |
|---|---|---|---|
| Cost | $17.99 one-time | $9.99-$17.99 one-time | $1,000+/month |
| Platform | Microsoft Excel | Browser-based Sheets | Vendor web app |
| Setup time | Under 10 minutes | Under 10 minutes | Days to weeks |
| Customizable fields | Fully editable | Editable | Often limited |
| Year-1 cost at 5 users | $17.99 total | $9.99-$17.99 total | $12,000+ |
| Best fit | Manual campaign reporting and ROI review | Cloud collaboration | Discovery, contracts, and live integrations |
Who This Template Is For – and Who It’s Not For
This template is for influencer marketing managers, creator agencies, brand partnership teams, and campaign analysts who need a clean Excel reporting file for collectives, platforms, tiers, and regions. It is not for enterprise teams that need automated social API pulls, contract management, influencer discovery, or payment processing inside the same system.
How to Use the Influencer Collectives Dashboard in Excel
- Download and open the Excel workbook.
- Go to the Data sheet and replace the sample rows with your campaign data.
- Keep the same column structure so the pivots can read your records.
- Open the Excel Data ribbon and click Refresh All.
- Use slicers on the dashboard pages to filter by the segments you want to review.
Real-World Use Cases
Maya, an agency account lead, uses the Channel Mix page to show a client which platforms generated the highest conversion rate. Daniel, a brand partnerships manager, uses Creator ROI to compare influencer payouts against revenue. Priya, a campaign analyst, uses Operations to review campaign status, monthly impressions, and quality ratings before the weekly meeting.
Frequently Asked Questions
What KPIs are included?
The dashboard includes Total Revenue, Net Profit, Total Impressions, and Total Spend on the Overview page.
Can I add my own data?
Yes. Replace the sample records in the Data sheet while keeping the same format, then refresh the workbook.
Does this require macros?
No. The dashboard is based on Excel charts, slicers, pivot tables, and structured data.
Can I hide the Support sheet?
Yes. The Support sheet feeds the dashboard pivots and can stay hidden during normal use.
Is this better than paid influencer software?
It is better for low-cost reporting and manual analysis. Paid software is better for live integrations, creator discovery, contracts, and payment workflows.
Does it work in Google Sheets?
This product is designed for Microsoft Excel. For cloud collaboration, consider a Google Sheets influencer dashboard.
About the Author
Built by PK – Microsoft Certified Professional with 15+ years of Excel, Google Sheets, and Power BI experience. Founder of NextGenTemplates, reaching 300K+ subscribers across YouTube channels. Every template is hand-built and tested before release.
Explore Related Templates
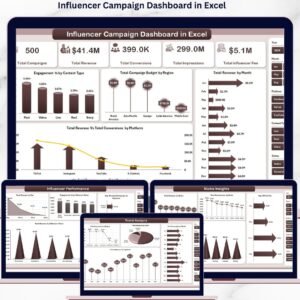
Explore related creator and marketing templates: Influencer Campaign Dashboard in Excel, Social Media Influencer Tracking Dashboard in Google Sheets, Digital Creators Guilds Dashboard in Excel, and DIY Craft Marketplaces Dashboard in Excel. Browse more Excel Dashboard templates.
Read the detailed blog post for this dashboard.
Last updated: June 24, 2026. Download the Influencer Collectives Dashboard in Excel today and turn creator campaign data into clear ROI, audience, and operations reporting.


Reviews
There are no reviews yet.