
Hospital Equipment Leasing Dashboard in Power BI gives hospital finance, biomedical engineering, procurement, and operations teams a ready-to-use PBIX report for reviewing lease revenue, monthly lease cost, maintenance cost, utilization, vendor mix, equipment count, and risk patterns. Instead of building every visual from scratch, users can replace the sample data source, refresh the report, and analyze 5 focused Power BI pages with KPI cards, slicers, and management-ready visuals. Join 8,400+ teams in 40+ countries using NextGenTemplates for practical business dashboards. Instant download, one-time payment, no subscription, and lifetime access.
Key Features of Hospital Equipment Leasing Dashboard in Power BI
- 5 report pages for Overview, Lease Trends, Equipment Mix, Vendor Analysis, and Risk Review.
- 5 top KPI cards for Total Revenue, Total Monthly Lease Cost, Total Maintenance Cost, Leased Equipment Count, and Average Revenue Per Record.
- Interactive slicers let users filter the report quickly by hospital, vendor, region, department, status, category, lease type, and priority when those fields are present in the data.
- Power BI visual layout supports executive meetings, vendor reviews, monthly finance reporting, and equipment-utilization conversations.
- Editable PBIX file so analysts can adjust measures, visuals, colors, fields, and page layouts for their hospital process.
What’s Inside the Hospital Equipment Leasing Dashboard in Power BI
Overview Page
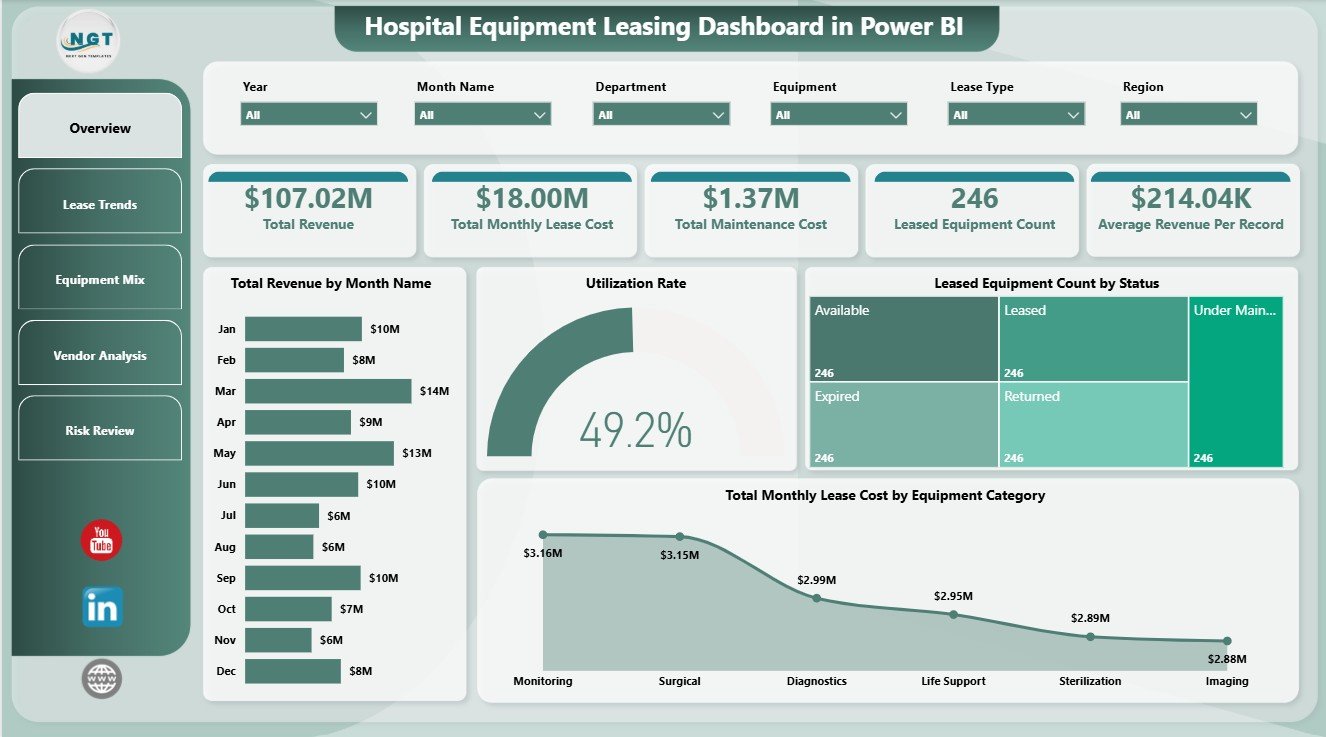
The Overview Page shows the high-level story first with KPI cards for Total Revenue, Total Monthly Lease Cost, Total Maintenance Cost, Leased Equipment Count, and Average Revenue Per Record.
Total Revenue by Month Name highlights monthly revenue movement and helps finance teams spot seasonal or operational shifts. Utilization Rate by Overall Equipment Portfolio shows whether leased equipment is being used efficiently across the portfolio.
Leased Equipment Count by Status separates records by current status so users can monitor active, pending, closed, or issue-based leases. Total Monthly Lease Cost by Equipment Category identifies which categories create the largest recurring lease burden.
Lease Trends
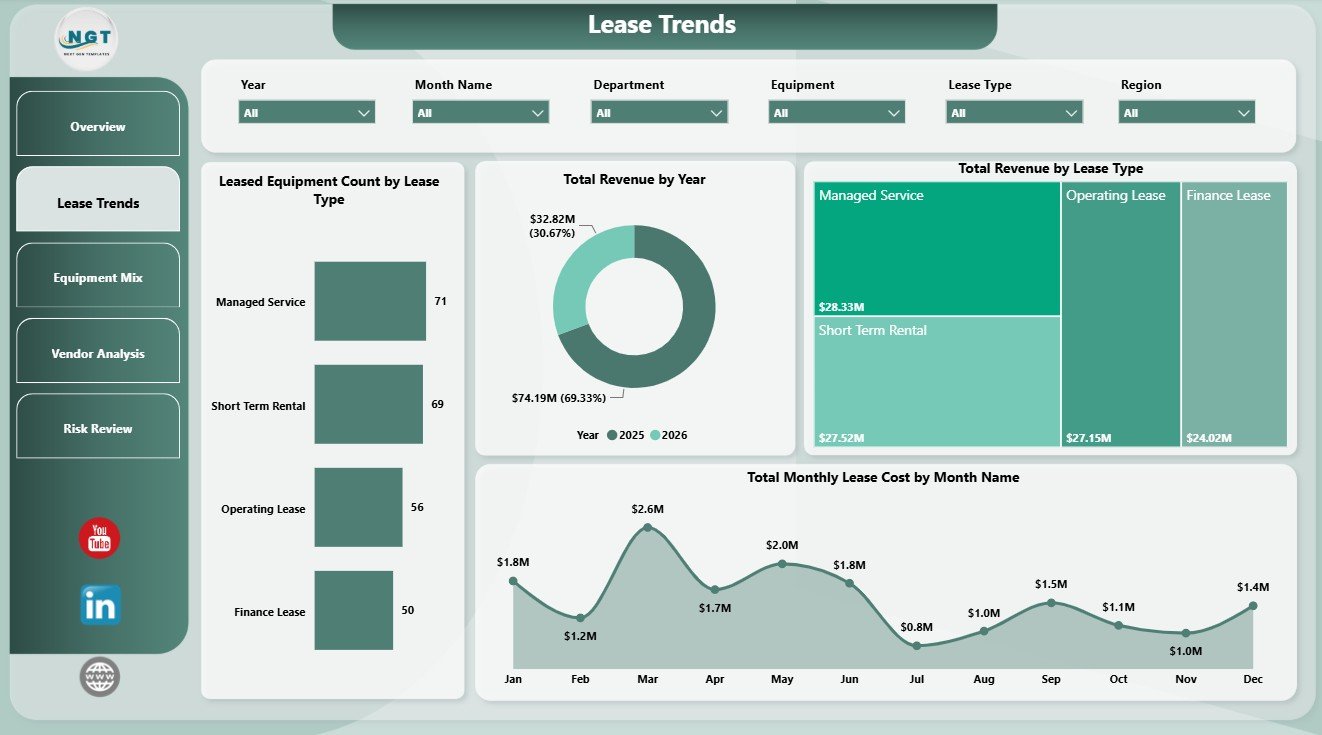
The Lease Trends page reviews leasing structure and time-based movement. Leased Equipment Count by Lease Type shows how many assets sit in each leasing arrangement, while Total Revenue by Year gives a clear annual trend view.
Total Revenue by Lease Type helps users compare which lease structures contribute most to revenue. Total Monthly Lease Cost by Month Name shows whether recurring lease commitments are rising, falling, or staying stable across months.
Equipment Mix
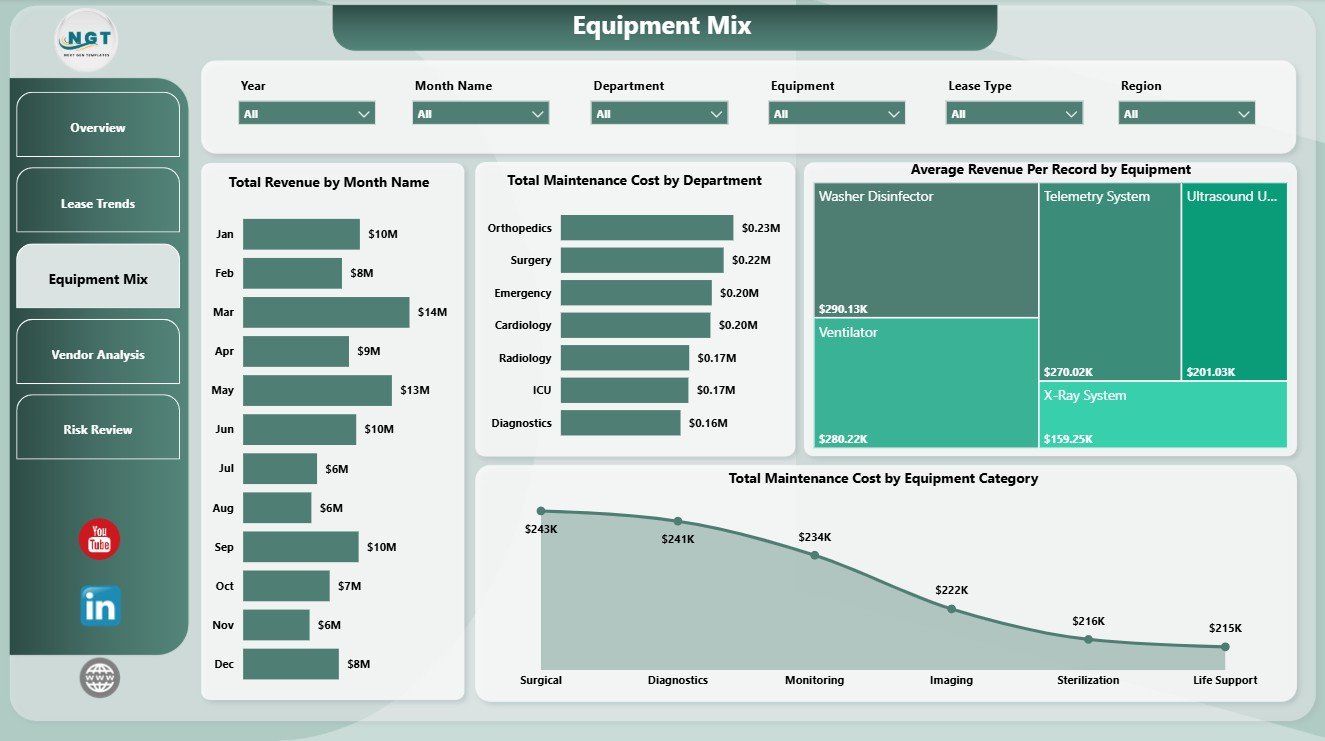
The Equipment Mix page explains how revenue and maintenance costs vary across equipment, departments, and categories. Total Revenue by Month Name helps compare recurring performance across the reporting cycle.
Total Maintenance Cost by Department shows where service cost is concentrated, while Average Revenue Per Record by Equipment helps compare asset-level value. Total Maintenance Cost by Equipment Category supports replacement planning, vendor discussion, and category-level cost control.
Vendor Analysis
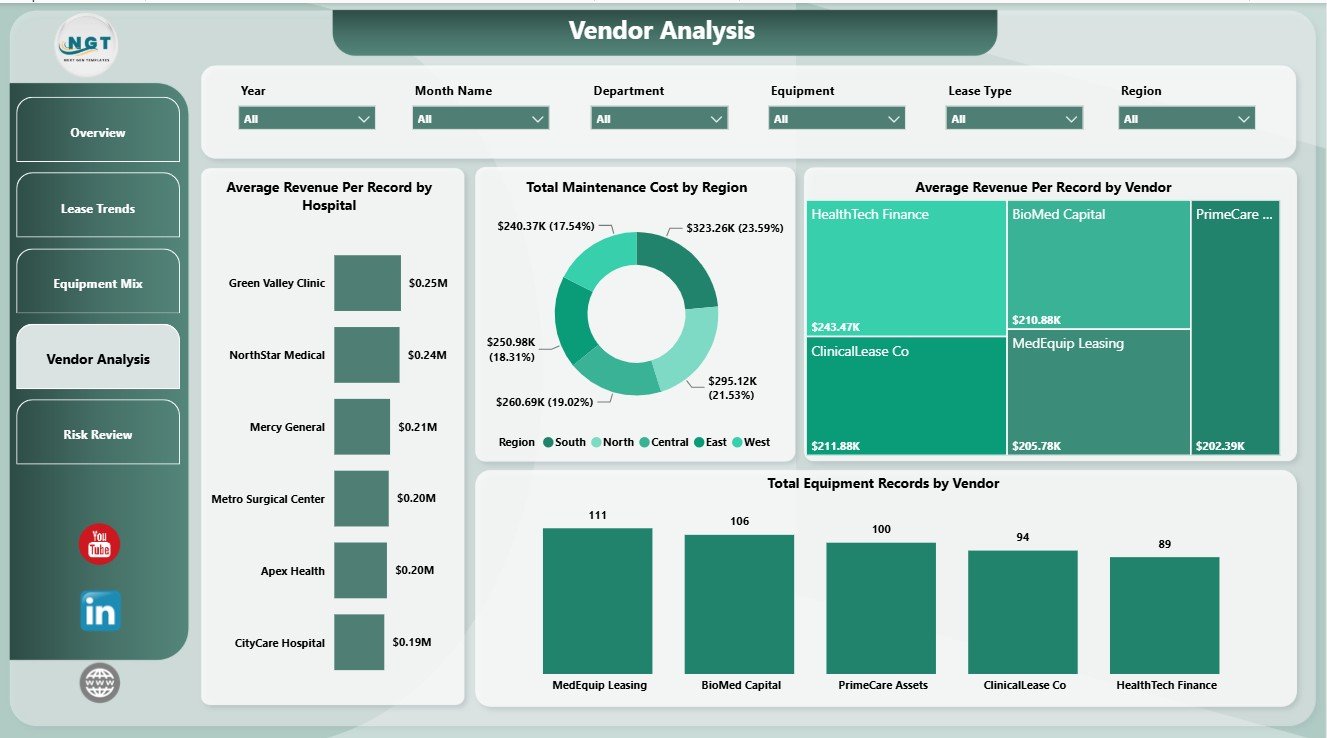
The Vendor Analysis page helps procurement and finance teams compare hospitals, regions, and vendors. Average Revenue Per Record by Hospital shows hospital-level contribution, while Total Maintenance Cost by Region highlights cost pressure by location.
Average Revenue Per Record by Vendor compares vendor-level value. Total Equipment Records by Vendor shows concentration and dependency, which is useful before vendor renewal or negotiation meetings.
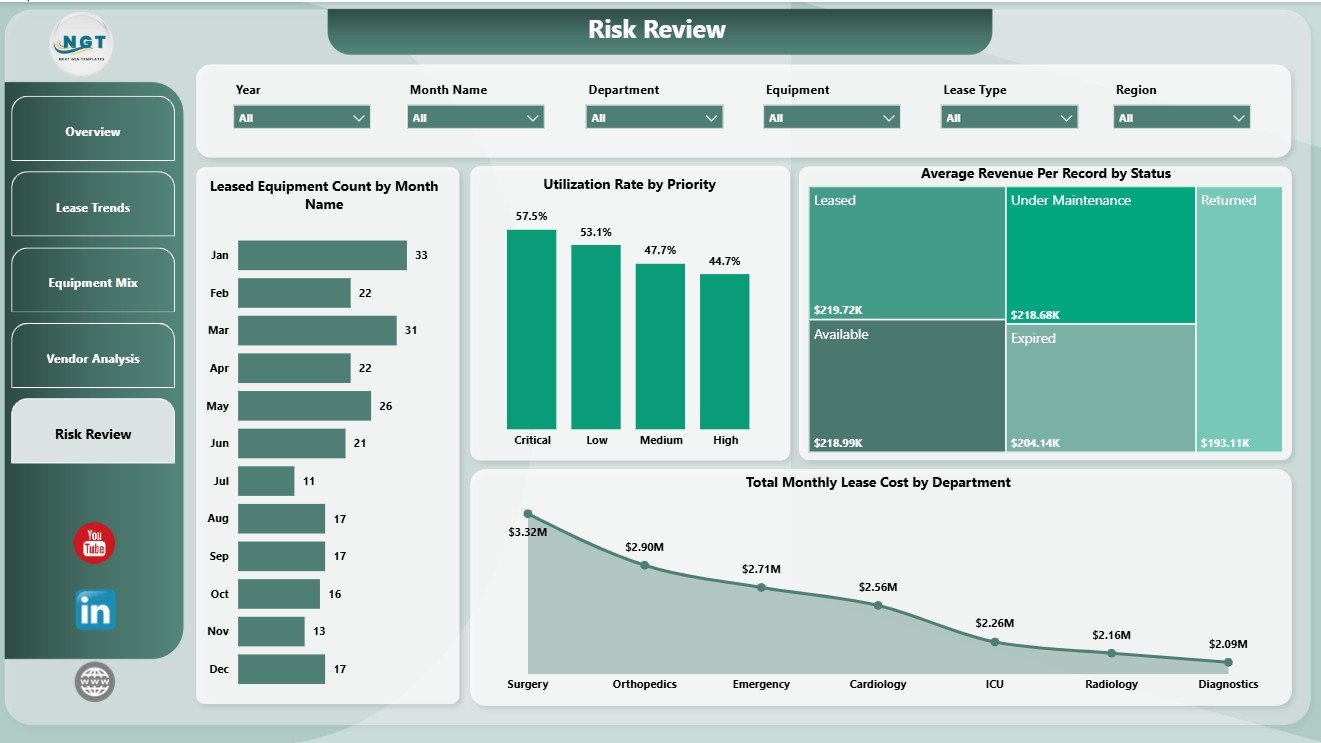
Risk Review
The Risk Review page connects equipment volume, utilization, status, priority, and department cost. Leased Equipment Count by Month Name shows record volume over time, and Utilization Rate by Priority helps teams focus on high-priority equipment usage.
Average Revenue Per Record by Status helps reveal which statuses are linked with stronger or weaker outcomes. Total Monthly Lease Cost by Department shows departments that may require budget review, contract review, or scheduling changes.
Hospital Equipment Leasing Dashboard in Power BI vs. Tableau vs. Paid Healthcare SaaS – Where This Fits
| Feature | Power BI dashboard | Tableau alternative | Paid healthcare SaaS |
|---|---|---|---|
| Cost | $17.99 one-time template | Requires Tableau setup and licensing | Monthly or annual subscription |
| Platform | Power BI Desktop and Power BI Service | Tableau Desktop or Tableau Cloud | Vendor-hosted platform |
| Setup time | Replace data source and refresh | Rebuild or adapt workbook | Often requires onboarding |
| Customizable fields | Editable PBIX model and visuals | Customizable by Tableau users | Often limited by vendor schema |
| Lease and vendor analysis | Built into report pages | Custom dashboard required | Depends on purchased modules |
| Year-1 cost at 5 users | $17.99 plus Power BI licensing as needed | Higher BI licensing cost | Can reach hundreds or thousands |
Who This Template Is For – and Who It’s Not For
This template is for hospital finance teams, biomedical equipment managers, procurement analysts, operations leaders, and healthcare consultants who want a practical Power BI reporting layer for leased medical equipment. It is not a live CMMS, EHR, IoT monitoring system, or lease accounting compliance engine. Teams needing work orders, live device telemetry, journal entries, approval workflows, or strict row-level security should use this dashboard alongside their operational systems.
How to Use the Hospital Equipment Leasing Dashboard in Power BI
- Download and unzip the product file.
- Open the PBIX file in Power BI Desktop.
- Replace the sample data source with your hospital equipment leasing data.
- Refresh the report and confirm the fields map correctly.
- Use slicers and report pages to review cost, revenue, vendor, utilization, and risk trends.
Real-World Use Cases
Anita, hospital finance manager: She checks monthly lease cost by equipment category before budget review meetings and compares the cost trend against revenue.
Rohan, biomedical equipment lead: He reviews utilization and maintenance cost to identify leased assets that may need replacement, renegotiation, or better scheduling.
Meera, procurement consultant: She compares vendors, hospitals, and regions to prepare a contract-review pack for senior leadership.
Frequently Asked Questions
What does this dashboard track?
It tracks revenue, monthly lease cost, maintenance cost, leased equipment count, average revenue per record, utilization rate, vendor performance, hospital, region, department, equipment category, lease type, status, and priority.
Do I need Power BI Desktop?
Yes. The PBIX file opens in Power BI Desktop, which is available from Microsoft. You can also publish to Power BI Service if your organization uses it.
Can I replace the sample data?
Yes. Replace the sample data source with your own leasing records, refresh the report, and check the visuals.
Can I customize the visuals?
Yes. You can edit report pages, visuals, measures, colors, slicers, and the data model inside Power BI Desktop.
Is this a hospital asset management system?
No. It is a reporting dashboard for analyzing exported or maintained leasing data. It does not replace a CMMS, ERP, EHR, or asset management platform.
Is this a one-time purchase?
Yes. The product is sold as a one-time download with no subscription from NextGenTemplates.
About the Author
Built by PK – Microsoft Certified Professional with 15+ years of Excel, Google Sheets, and Power BI experience. Founder of NextGenTemplates, reaching 300K+ subscribers across YouTube channels. Every template is hand-built and tested before release.
Explore Related Templates
For spreadsheet-based reporting, see the Hospital Equipment Leasing Dashboard in Excel. You can also browse more Power BI Dashboard Templates and the full Power BI template category. For broader business tools, review the VBA Management Systems Mega Pack.
Read the full walkthrough on PK-AnExcelExpert, then get the Hospital Equipment Leasing Dashboard in Power BI to start reviewing hospital lease cost, vendor mix, utilization, maintenance trends, and risk in one editable PBIX report.
Last updated: June 19, 2026


Reviews
There are no reviews yet.