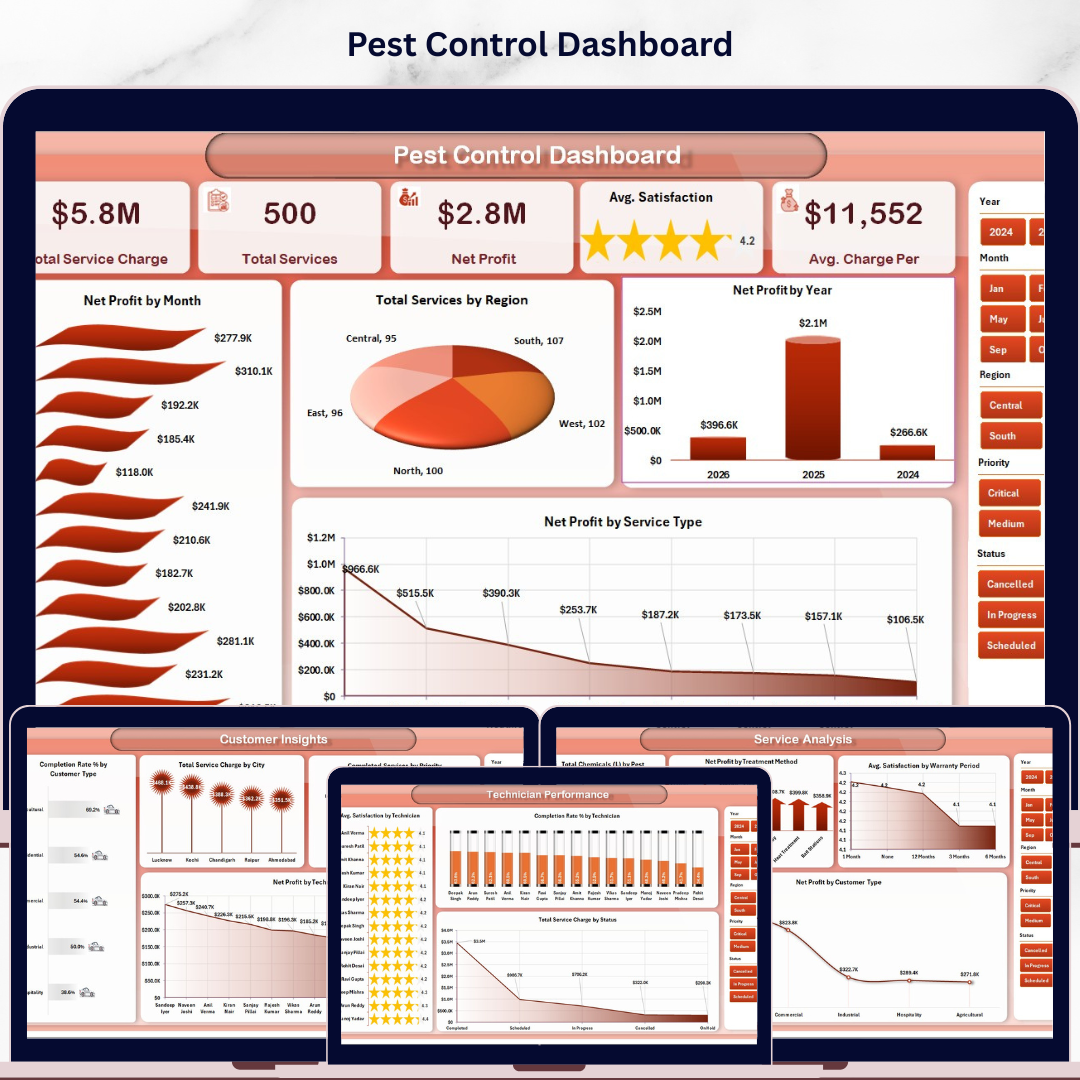

The Pest Control Dashboard in Excel monitors 5 core KPIs across 5 interactive analysis pages — covering revenue trends, service performance, customer insights, and technician output from a single workbook. With 16+ pre-built pivot-driven charts and multi-slicer filtering, you get a clear picture of your business in under 10 minutes of setup. Replace the sample data in the Data Sheet, hit Data → Refresh All, and every chart updates automatically.
🌍 Join 8,400+ teams in 40+ countries using NextGenTemplates to replace paid SaaS tools with one-time-purchase Excel, Google Sheets, Power BI, and HTML templates.
✅ Instant download · One-time payment · No subscription · No per-user fees · Lifetime access
Pest Control Dashboard in Excel — Overview Page
🔑 Key Features of the Pest Control Dashboard in Excel
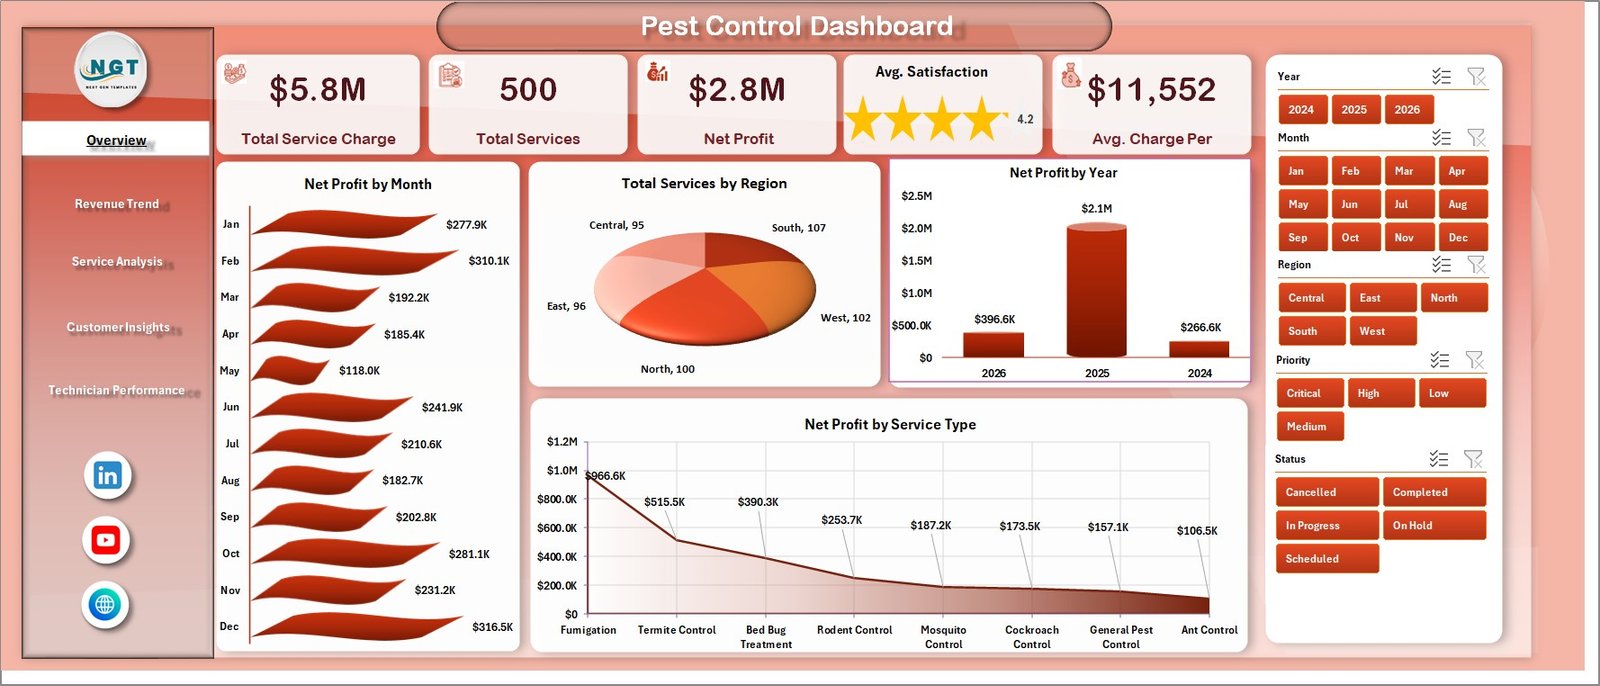
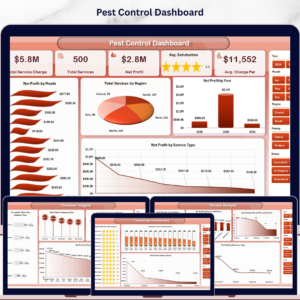
This dashboard tracks 5 key business metrics — Total Service Charge, Total Services, Net Profit, Avg. Satisfaction, and Avg. Charge Per Service — displayed as KPI cards at the top of the Overview page, giving managers an instant health check at a glance. Multiple slicers enable instant cross-chart filtering by region, service type, technician, booking source, or time period in a single click — no formula edits required.
🔹 5-Page Analysis Structure — Overview, Revenue Trend, Service Analysis, Customer Insights, and Technician Performance each address a distinct business dimension, so field managers always know where to look for the right metric.
🔹 16+ Pivot-Driven Charts — including Net Profit by Month, Total Services by Region, Net Profit by Year, Material Cost by Quarter, Total Chemicals by Pest Type, Completion Rate by Technician, and more. Every chart connects to the Support Sheet pivot tables and refreshes with one click.
🔹 Technician Performance Page — ranks field technicians by Avg. Satisfaction, Completion Rate %, and Total Service Charge in one dedicated view — so managers can identify top performers and address service gaps without pulling individual reports.
🔹 Customer and Geographic Insights — analyzes Total Service Charge by City, Completion Rate by Customer Type, and Net Profit by Technician, helping business owners make territory and expansion decisions based on data.
🔹 Works Offline in Microsoft Excel — no internet connection, no cloud dependency, no per-user licensing. One file, one purchase, unlimited use.
📦 What’s Inside the Pest Control Dashboard in Excel
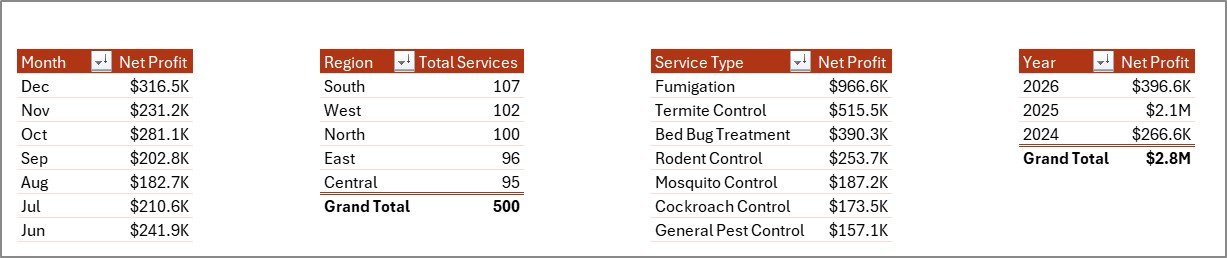
1 — Overview Page: Five KPI cards at the top surface Total Service Charge, Total Services, Net Profit, Avg. Satisfaction, and Avg. Charge Per Service at a glance. Four analysis charts — Net Profit by Month, Total Services by Region, Net Profit by Year, and Net Profit by Service Type — deliver a complete financial and operational overview. Multiple slicers filter all visuals simultaneously.
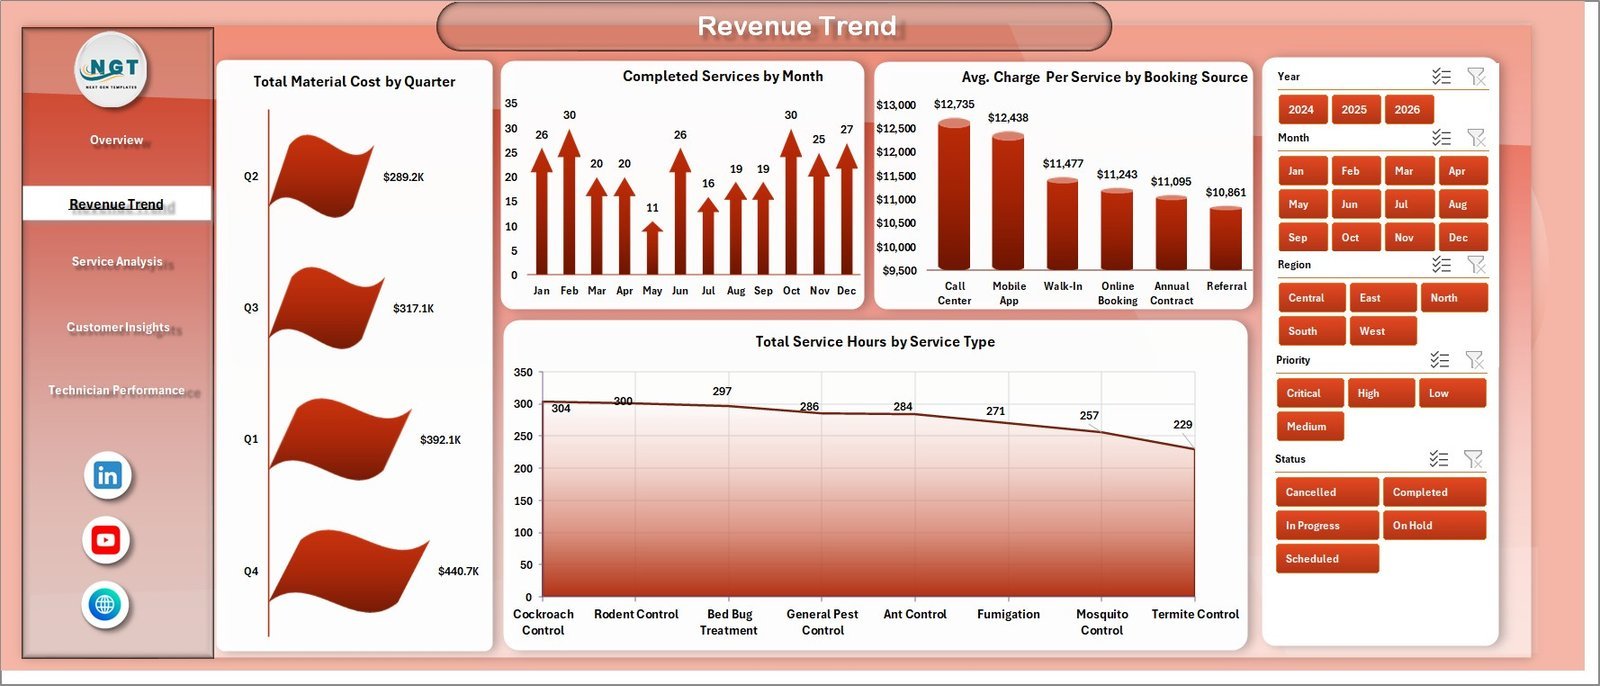
Revenue Trend Page
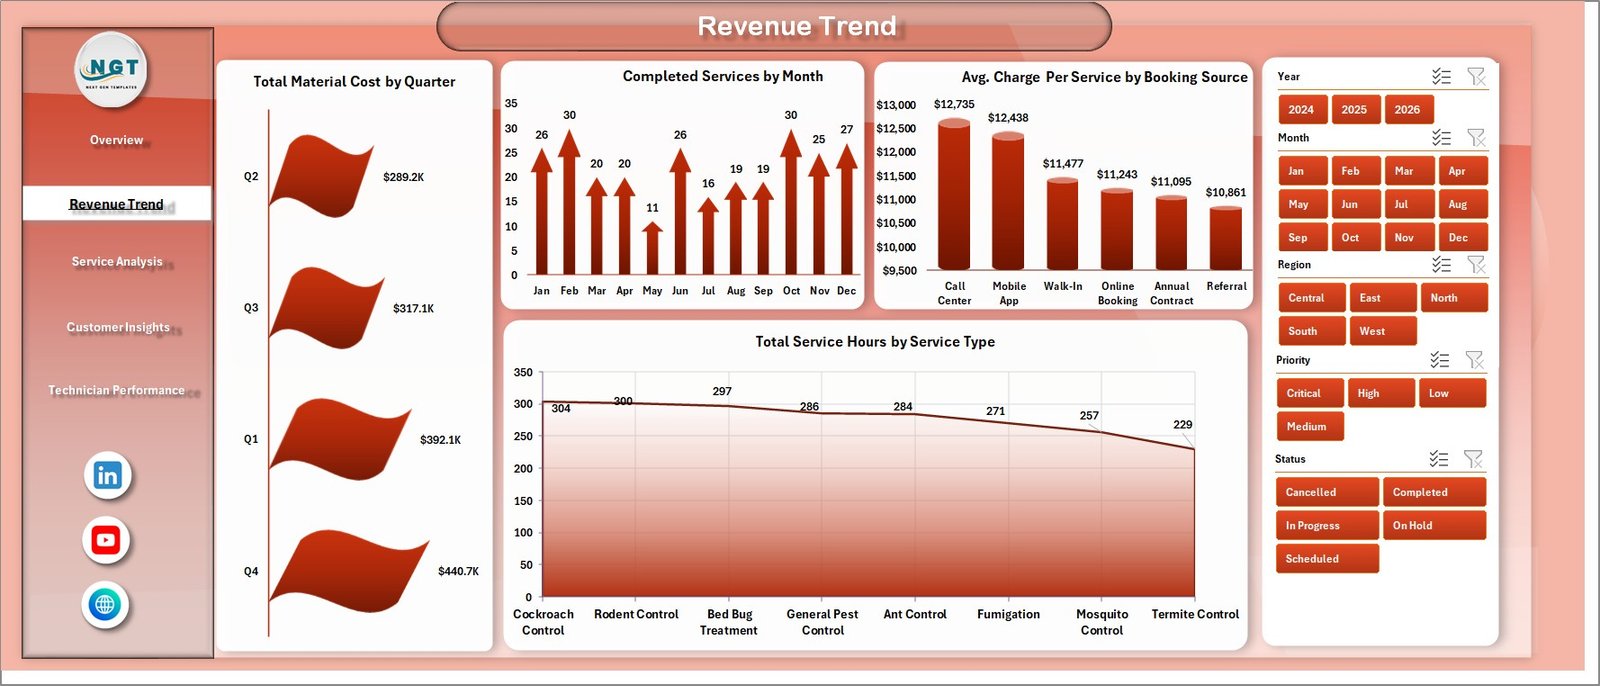
2 — Revenue Trend: Tracks Total Material Cost by Quarter, Completed Services by Month, Avg. Charge Per Service by Booking Source, and Total Service Hours by Service Type — revealing seasonal demand patterns and which booking channels deliver the highest average revenue per visit.
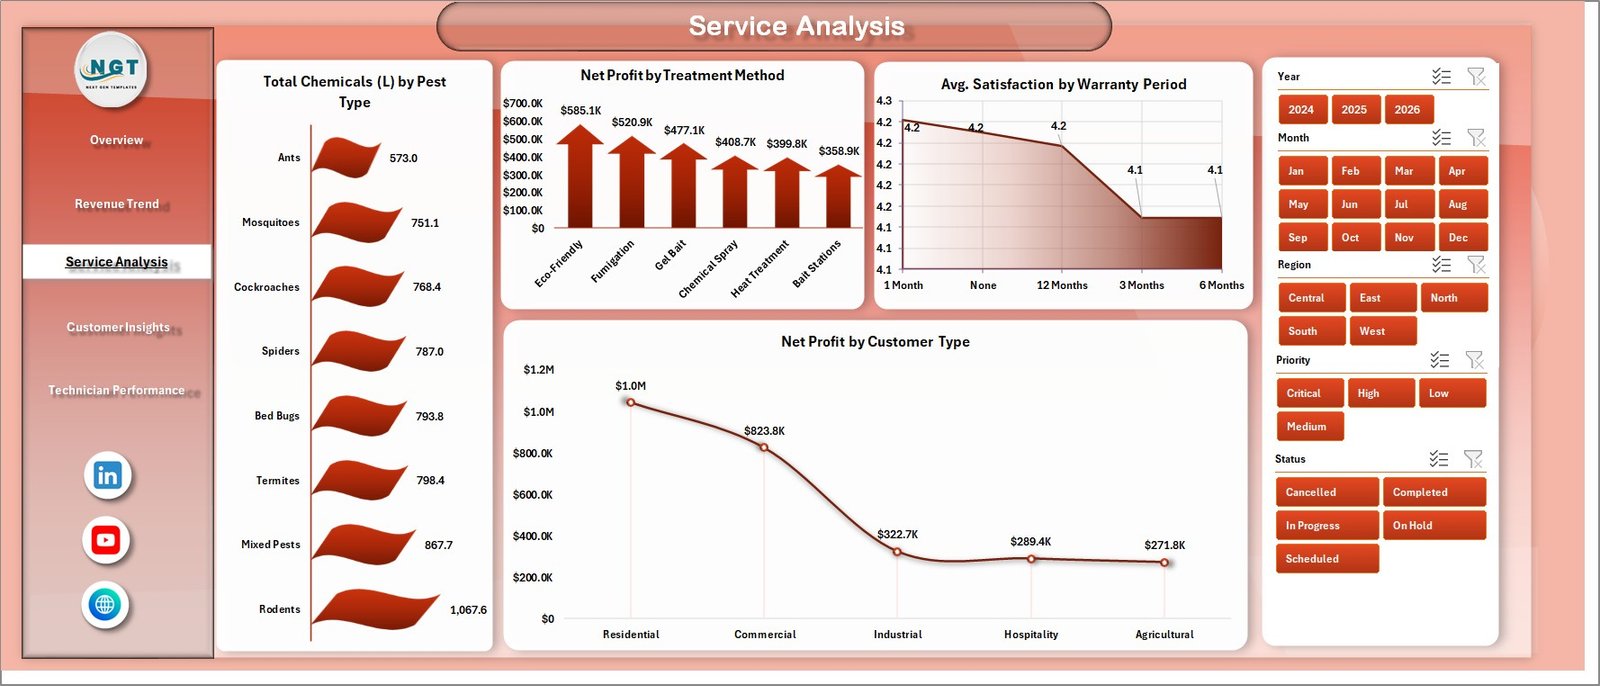
Service Analysis Page
3 — Service Analysis: Breaks down Total Chemicals (L) by Pest Type, Net Profit by Treatment Method, Avg. Satisfaction by Warranty Period, and Net Profit by Customer Type — helping operations teams optimize chemical usage, treatment mix, and pricing strategy by customer segment.

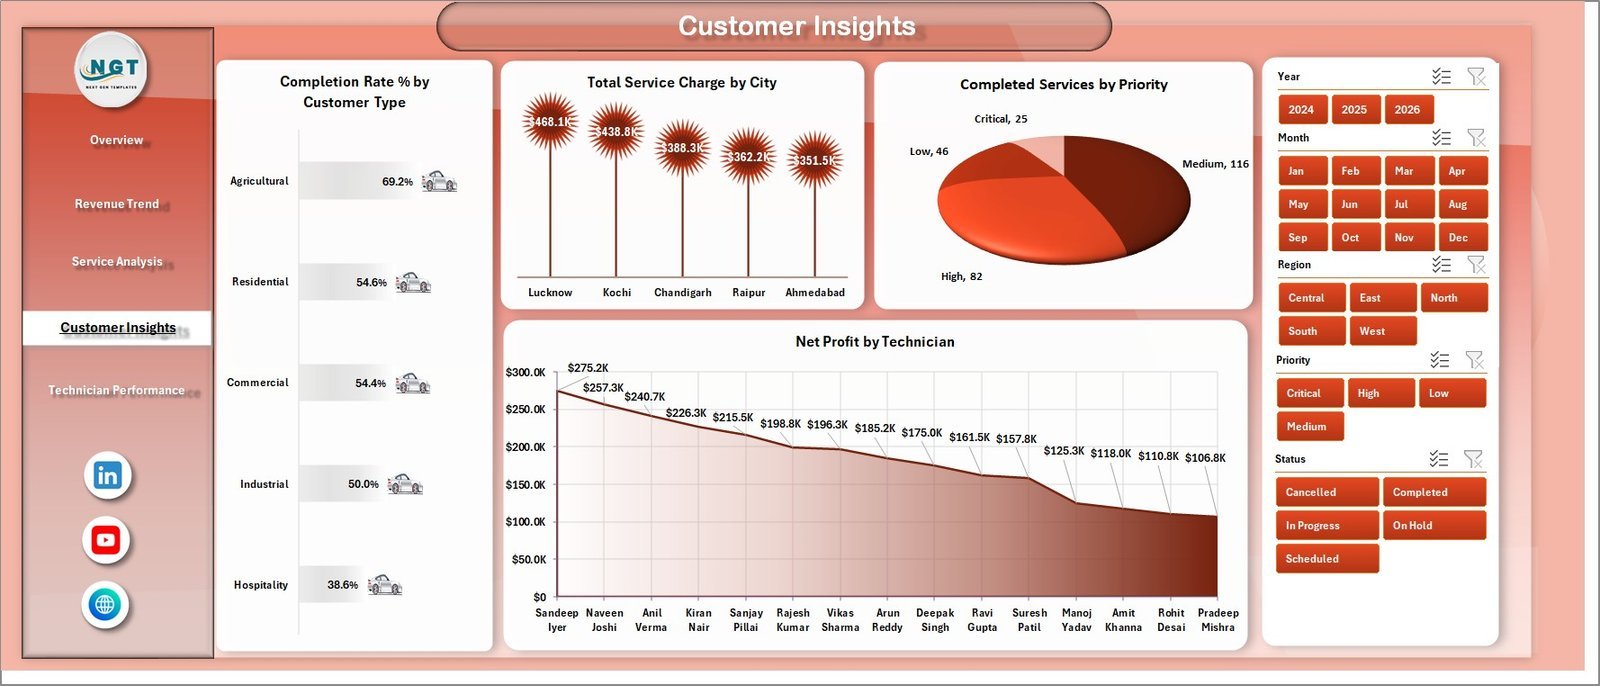
Customer Insights Page
4 — Customer Insights: Analyzes Completion Rate % by Customer Type, Total Service Charge by City, Completed Services by Priority, and Net Profit by Technician — giving service managers clear visibility into geographic performance and priority fulfillment rates across their customer base.

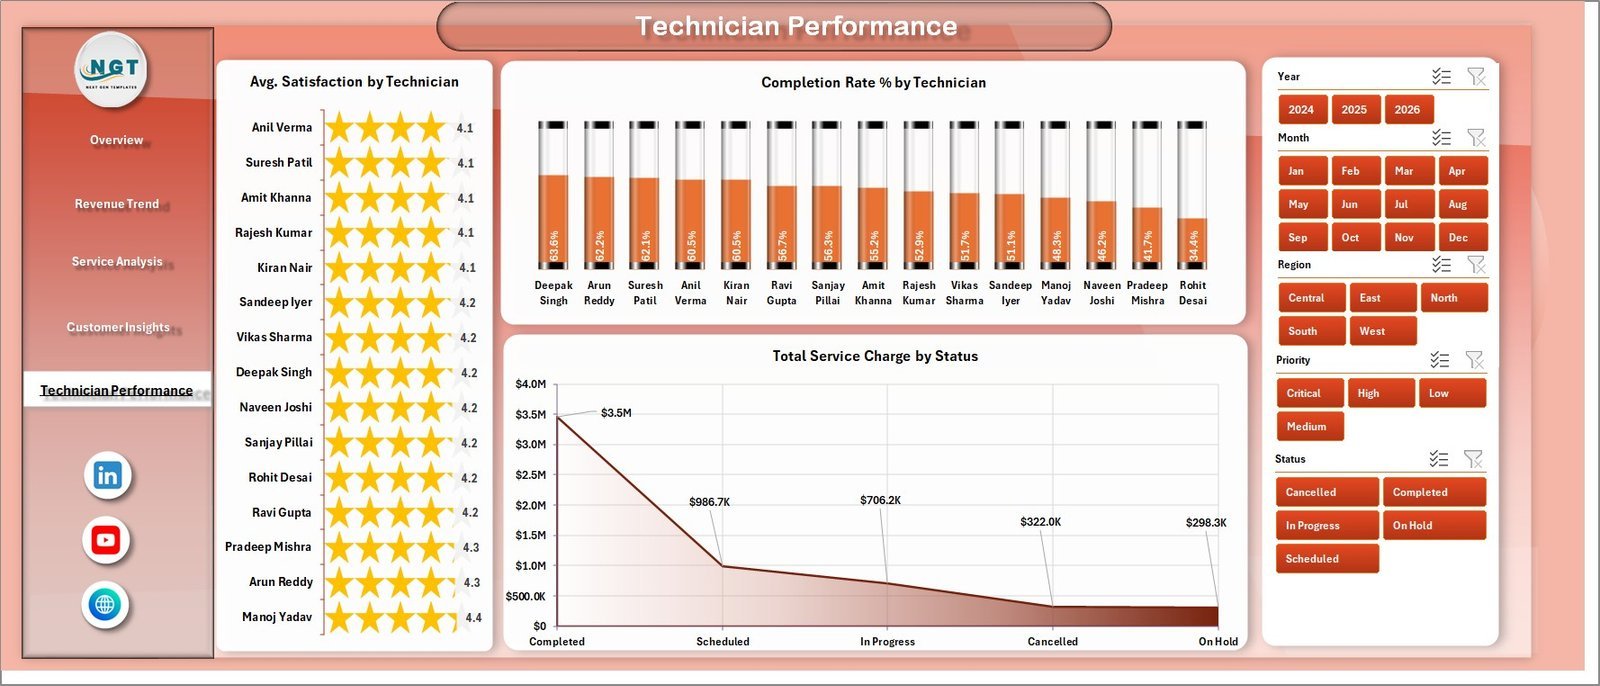
Technician Performance Page
5 — Technician Performance: Compares Avg. Satisfaction by Technician, Completion Rate % by Technician, and Total Service Charge by Status — enabling managers to rank field staff by customer satisfaction, job completion, and revenue contribution in one dedicated view.
📊 Pest Control Dashboard in Excel vs. Google Sheets vs. Paid Field Service SaaS
| Feature | Pest Control Dashboard in Excel | Google Sheets Tracker | ServiceTitan / Jobber |
|---|---|---|---|
| Cost | $17.99 one-time ✅ | Free (manual build) | $149–$399+/month |
| Platform | Microsoft Excel ✅ | Google Sheets (cloud) | Cloud SaaS web app |
| Setup Time | Under 10 minutes ✅ | Hours of manual build | Days of onboarding |
| Pre-Built Charts | 16+ pivot charts ✅ | Build yourself | Built-in reports |
| Slicer Filtering | Multi-slicer ✅ | Dropdown filters only | Yes (SaaS-level) |
| Works Offline | Yes ✅ | No | No |
| Technician Performance Tracking | Dedicated 5th page ✅ | Manual only | Yes (enterprise) |
| Year-1 Cost (5 users) | $17.99 total ✅ | Free (time cost) | $9,000–$24,000+ |
For pest control businesses that want clear financial and technician analytics without a $149+/month SaaS subscription, the Pest Control Dashboard in Excel sits in the sweet spot.
👥 Who This Template Is For — and Who It’s Not For
✅ This template is built for:
- Pest control business owners managing 1–50 technicians across multiple service regions
- Operations managers who review revenue, profitability, and technician KPIs monthly
- Field service managers tracking booking sources, customer types, and priority fulfillment rates
- Small-to-medium exterminator and fumigation companies replacing manual spreadsheet reporting
- Finance or admin staff producing monthly performance reports for pest control operations
❌ This template is NOT for:
- Enterprises needing real-time job dispatch, GPS tracking, or route optimization (ServiceTitan/Jobber)
- Teams needing customer-facing mobile app integration or automated invoicing
- Users who want a fully automated, zero-data-entry analytics system
⚙️ How to Use the Pest Control Dashboard in Excel
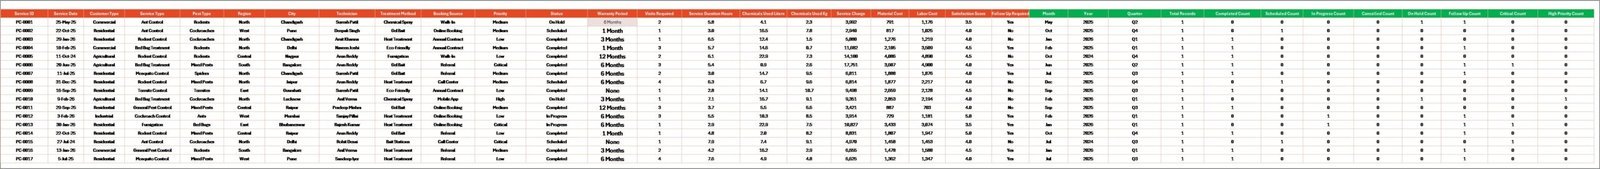
- Download and open the Excel file. Review the sample data structure in the Data Sheet tab to understand the column format.
- Add your service records to the Data Sheet in the same column format as the sample data provided.
- Refresh all pivot tables: Go to the Data tab in the Excel Ribbon and click Refresh All — every chart and KPI card across all 5 pages updates instantly.
- Apply slicers on any page to filter by region, service type, technician, customer type, or booking source.
- Hide the Support Sheet once familiar with the file — it contains the pivot tables powering all charts and can remain hidden during day-to-day use.
💼 Real-World Use Cases
Marcus runs a pest control company with 8 technicians across 3 cities. He uses the Pest Control Dashboard in Excel to review monthly Net Profit by Technician and Completion Rate every Monday morning — identifying which techs are driving the most revenue and which need coaching, without paying $199/month for a SaaS reporting module.
Priya manages operations for a commercial pest control contractor serving restaurants, warehouses, and residential clients. She tracks Total Service Charge by City and Net Profit by Customer Type to make quarterly decisions about which markets and client segments to expand — directly from her Excel workbook, offline, on her laptop.
A regional franchise owner exports monthly CSV data from their booking system, pastes it into the Data Sheet, and hits Refresh All. In under five minutes, the 5-page dashboard updates with every chart, KPI, and slicer reflecting the latest numbers — ready to share with franchise partners.
❓ Frequently Asked Questions
What KPIs does the Pest Control Dashboard in Excel track?
The Pest Control Dashboard in Excel tracks 5 core KPIs: Total Service Charge, Total Services, Net Profit, Average Satisfaction Score, and Average Charge Per Service. These appear as cards on the Overview page and update automatically when you refresh pivot tables after updating the Data Sheet.
Do I need advanced Excel skills to use this dashboard?
Basic Excel familiarity is sufficient. The main action required is clicking Data → Refresh All after adding new data. Slicers work with a single click and no formulas need to be modified. PK’s step-by-step video tutorials at YouTube.com/@PKAnExcelExpert walk through the full workflow.
How do I update data in this dashboard?
Add new service records to the Data Sheet in the same column format as the sample data. Then go to the Data tab in the Excel Ribbon and click Refresh All. Every pivot table, chart, and KPI card across all 5 pages will update instantly — no manual chart editing required.
How does this compare to ServiceTitan or Jobber?
ServiceTitan and Jobber are full field service platforms starting at $149–$399+/month with dispatch, scheduling, and customer management built in. The Pest Control Dashboard in Excel is a $17.99 one-time analytics template — it delivers financial and performance visibility without the subscription cost, but doesn’t replace scheduling or dispatch software.
Can this dashboard track multiple technicians and regions?
Yes. The dashboard includes charts for Total Services by Region, Total Service Charge by City, Net Profit by Technician, Completion Rate % by Technician, and Avg. Satisfaction by Technician. Slicers let you filter the entire dashboard by region, technician, or any other dimension in a single click.
What version of Microsoft Excel does this require?
The template works with Microsoft Excel 2016 and later, including Microsoft 365. Pivot table slicers require Excel 2010+. No VBA or macros are used, so no security warnings will appear when opening the file.
Can I customize service categories, pest types, and technician names?
Yes. Pest types, service categories, treatment methods, technician names, and city names all come directly from the Data Sheet — update your data to reflect your business and all charts will reflect your actual values after the next Refresh All.
👤 About the Author
Built by PK — Microsoft Certified Professional with 15+ years of Excel, Google Sheets, and Power BI experience. Founder of NextGenTemplates, reaching 300K+ subscribers across YouTube channels (@PK-AnExcelExpert, @NextGenTemplates, @NeoTechNavigators). Every template is hand-built and tested before release.
🔗 Explore Related Templates
Explore our full range of Excel Dashboard Templates. You may also find these related products useful:
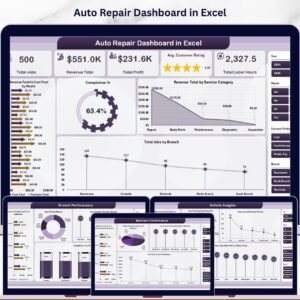
- Auto Repair Dashboard in Excel — service business performance analytics for repair shops and garages with technician and job tracking
- Office Cleaning Request Tracker in Excel — manage cleaning service requests, staff assignments, and priority tracking
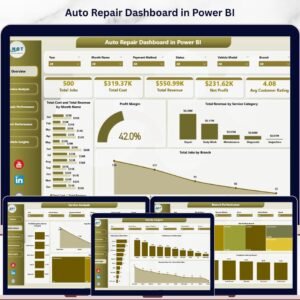
- Auto Repair Dashboard in Power BI — the same field service analytics in Power BI format for teams on the Microsoft BI stack
📖 Click here to read the Detailed Blog Post
🎥 Visit our YouTube channel for step-by-step video tutorials
👉 YouTube.com/@NextGenTemplates
Watch the step-by-step video tutorial:


Reviews
There are no reviews yet.