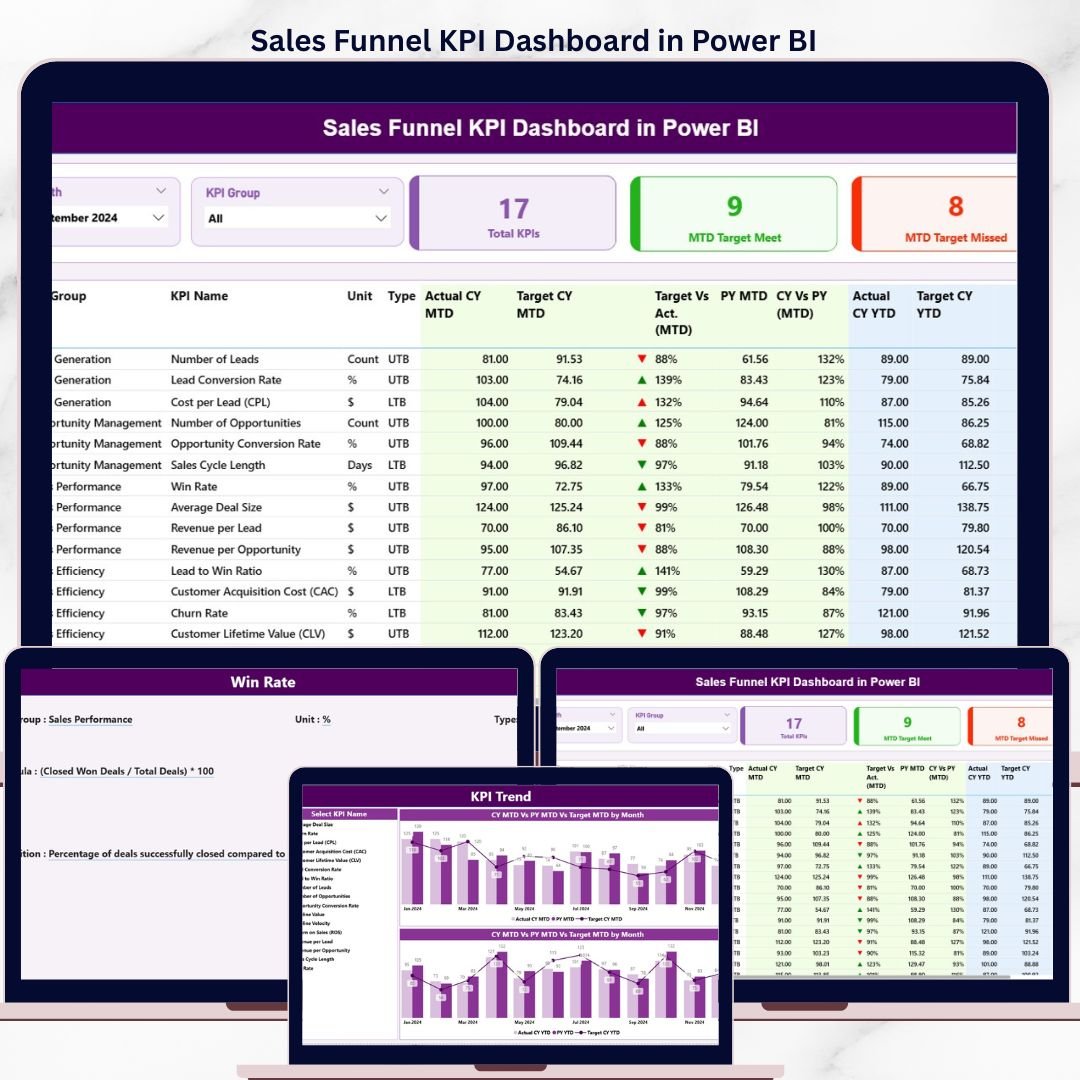
The Sales Funnel KPI Dashboard in Power BI tracks 3 interactive report pages covering MTD actuals, YTD actuals, prior-year comparisons, and target-achievement rates across every KPI in your sales funnel — all inside a single Power BI Desktop .pbix file connected to a familiar Excel data source. Setup takes under 10 minutes: fill 3 Excel worksheets with your actual numbers, targets, and KPI definitions, and every table, combo chart, and summary card updates automatically.
🌍 Join 8,400+ teams in 40+ countries using NextGenTemplates to replace costly CRM reporting modules with one-time-purchase Power BI and Excel templates.
✅ Instant download · One-time payment · No subscription · No per-user fees · Lifetime access
🔑 Key Features of Sales Funnel KPI Dashboard in Power BI
📊 3-page interactive Power BI report — The dashboard spans a Summary Page, a KPI Trend Page, and a hidden KPI Definition drill-through page, giving sales leaders a complete view from high-level scorecard down to individual KPI formula documentation. This is the only Power BI sales KPI template that combines an MTD/YTD table, trend combos, and a drill-through definition layer in a single .pbix file.
📋 16-column KPI detail table on the Summary Page — Each KPI row shows KPI Number, KPI Group, KPI Name, Unit, Type (LTB/UTB), Actual CY MTD, Target CY MTD, MTD achievement icon (▼/▲ in red/green), Target vs Actual MTD %, PY MTD, CY vs PY MTD %, Actual CY YTD, Target CY YTD, YTD icon, Target vs Actual YTD %, PY YTD, and CY vs PY YTD %. That is 16 data points per KPI in a single scrollable view.
🎯 MTD + YTD dual tracking with prior-year benchmarks — Every KPI is measured against both its current-year target and the same period in the prior year. Month and KPI Group slicers on the Summary Page filter the entire report instantly.
🔴🟢 LTB / UTB smart icon logic — The dashboard recognizes whether a KPI is Lower-The-Better (e.g., Cost per Lead, Churn Rate) or Upper-The-Better (e.g., Conversion Rate, Revenue) and applies ▼/▲ icons with red/green coloring accordingly — no manual formatting required.
📉 KPI Trend Page with 2 combo charts — Select any KPI from the left-side slicer and instantly see Current Year Actual, Prior Year Actual, and Target plotted as a time-series combo — separately for MTD and YTD. Ideal for identifying seasonal patterns and validating target-setting accuracy during QBRs.
📦 What’s Inside the Sales Funnel KPI Dashboard in Power BI
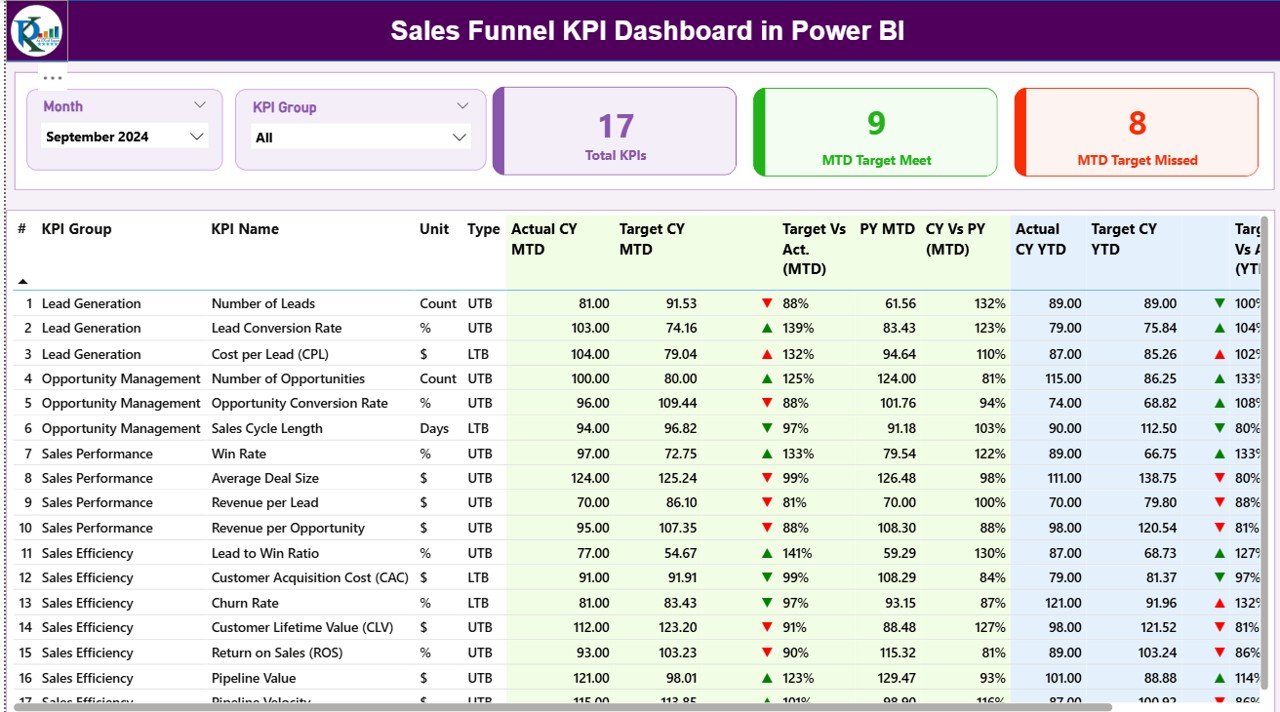
Summary Page — KPI detail table with MTD/YTD actuals, targets, icons, and prior-year comparisons
🗂️ Page 1 — Summary Page — Month and KPI Group slicers at the top. Three KPI cards: Total KPIs count, MTD Target Meet count, MTD Target Missed count. Below: the full 16-column KPI detail table with every metric per KPI row.
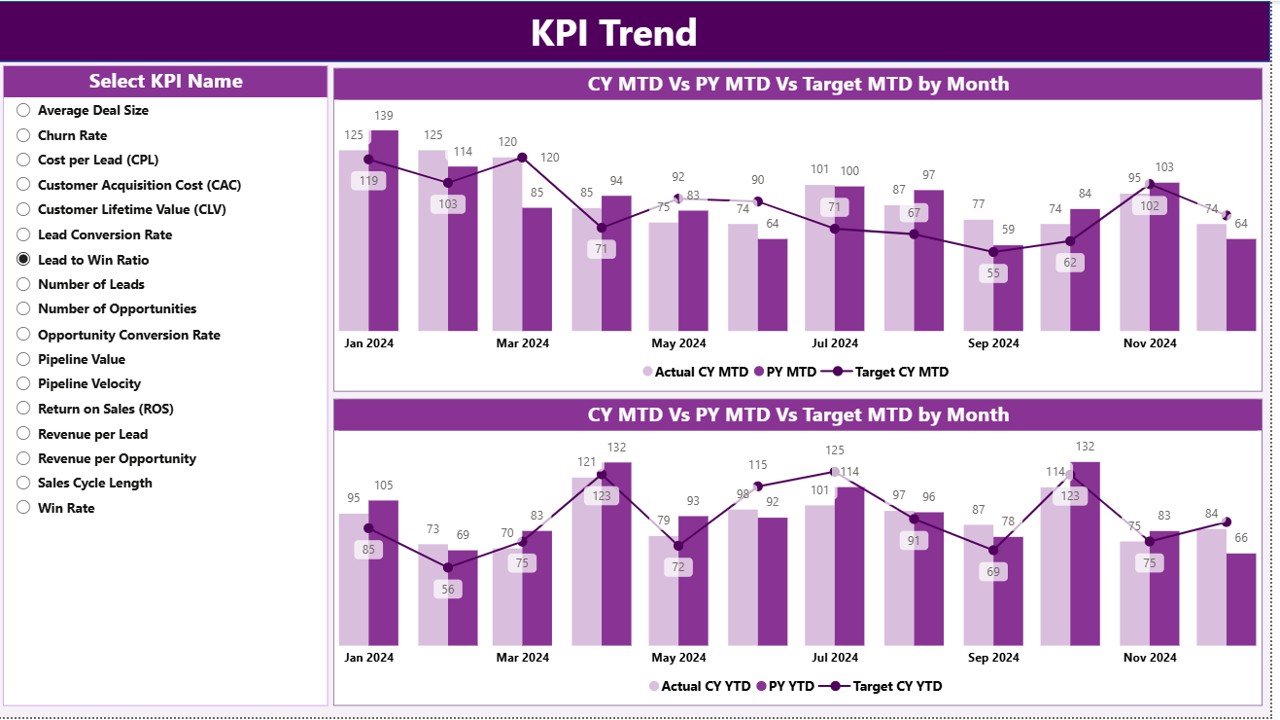
KPI Trend Page — combo charts for MTD and YTD actuals vs. targets vs. prior year
📊 Page 2 — KPI Trend Page — Left-side KPI Name slicer. Two combo charts: one for MTD trends, one for YTD trends — each plotting Current Year Actual, Previous Year Actual, and Target across months. Perfect for leadership review presentations.
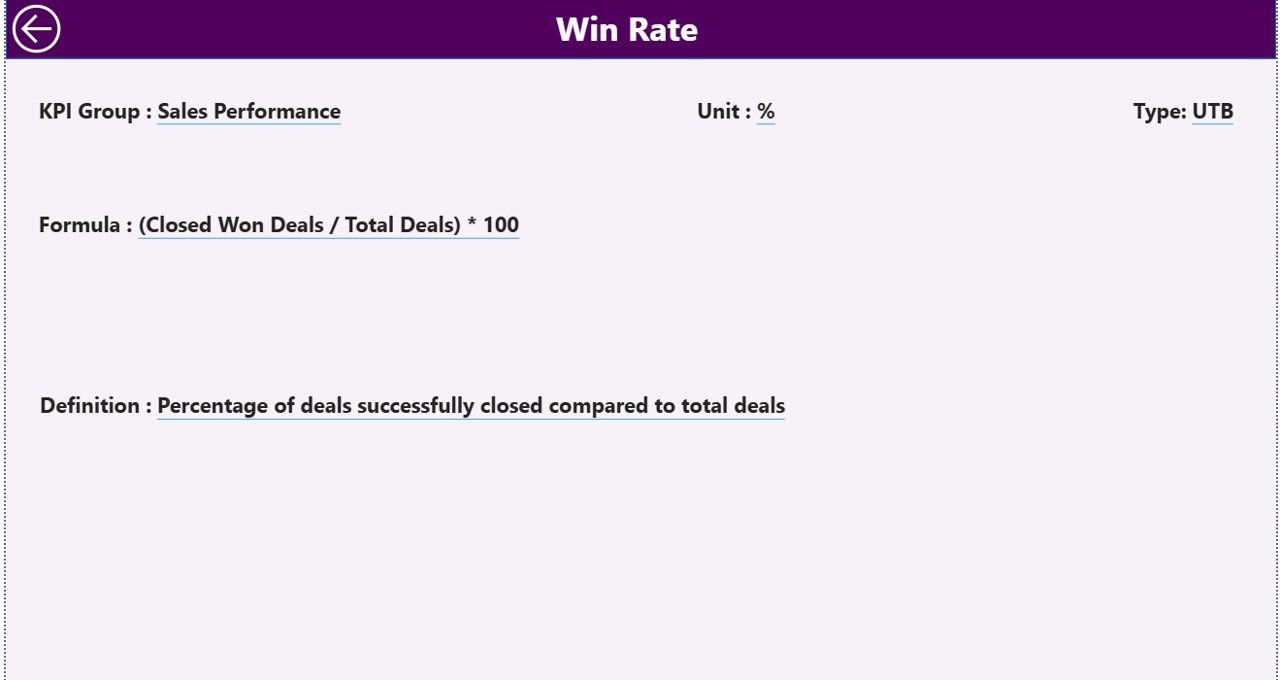
KPI Definition page (hidden drill-through) — formula and business definition for every KPI
📝 Page 3 — KPI Definition (hidden drill-through) — Right-click any KPI row on the Summary Page to drill through. Shows KPI Number, Group, Name, Unit, Formula, full business Definition, and LTB/UTB type. Back button on top-left returns to Summary.
📁 Excel Data Source (3 worksheets) — Input_Actual (KPI Name, Month, MTD actuals, YTD actuals), Input_Target (KPI Name, Month, MTD targets, YTD targets), and KPI Definition (KPI Number, Group, Name, Unit, Formula, Definition, Type).
📊 Sales Funnel KPI Dashboard in Power BI vs. Excel KPI Dashboard vs. Salesforce — Where This Fits
| Feature | Sales Funnel KPI Dashboard in Power BI | Excel KPI Dashboard | Salesforce CRM Reporting |
|---|---|---|---|
| Cost | $11.99 one-time | ~$7–18 one-time | $25–300 / user / month |
| Platform | Power BI Desktop (free) | Microsoft Excel | Salesforce cloud |
| Setup time | Under 10 minutes | 10–15 minutes | Days to weeks (admin config) |
| Interactive slicers | ✅ Month + KPI Group | Limited (dropdowns) | ✅ Yes |
| MTD + YTD + Prior-Year tracking | ✅ Built-in | Manual formulas needed | Custom reports required |
| LTB / UTB smart icons | ✅ Automatic | ❌ Manual formatting | ❌ Not built-in |
| Drill-through KPI definitions | ✅ Built-in | ❌ Not available | ✅ Custom pages needed |
| Year-1 cost at 5 users | $11.99 total | ~$18 total | $1,500–18,000 / year |
| No CRM subscription required | ✅ Standalone | ✅ Standalone | ❌ Requires Salesforce |
For sales ops teams that need MTD/YTD + prior-year KPI tracking with smart icons — without Salesforce pricing — the Sales Funnel KPI Dashboard in Power BI sits in the sweet spot.
👥 Who This Template Is For — and Who It’s Not For
✅ This template is built for:
- Sales managers and VPs tracking funnel KPIs like lead conversion rates, pipeline velocity, and quota attainment monthly
- Sales ops analysts needing MTD/YTD vs. target and prior-year benchmarks without writing DAX from scratch
- B2B and B2C sales teams with defined KPI sets that include both LTB and UTB metrics
- Business owners and consultants who want a shareable Power BI KPI report ready in minutes
❌ This template is NOT for:
- Teams that need real-time data refresh from Salesforce, HubSpot, or another live CRM (this uses manual Excel data entry)
- Enterprise teams needing row-level security or multi-tenant Power BI Service deployment
⚙️ How to Use the Sales Funnel KPI Dashboard in Power BI
- Download and extract the .zip file containing the .pbix and Excel data files.
- Fill the Input_Actual worksheet with your KPI names, month dates (first date of month), MTD actuals, and YTD actuals.
- Fill the Input_Target worksheet with matching KPI names, months, MTD targets, and YTD targets.
- Fill the KPI Definition worksheet with KPI Number, Group, Name, Unit, Formula, Definition, and Type (LTB or UTB).
- Open the .pbix in Power BI Desktop (free from Microsoft) and update the data source path to your Excel file.
- Refresh the dataset — all 3 pages update automatically with your real data.
💼 Real-World Use Cases
Marcus leads sales ops for a 40-person B2B SaaS company. He uses the Sales Funnel KPI Dashboard in Power BI to track 12 funnel KPIs — including MQL-to-SQL conversion rate, average deal cycle time, and win rate — against monthly targets and the prior year, all in a single scrollable table. Every Monday he filters by KPI Group to run the pipeline review without building a single DAX measure himself.
Priya is a sales consultant serving retail clients across three regions. She fills the KPI Definition sheet with each client’s custom metric set, points the data source to that client’s Excel file, and delivers a branded Power BI report in under an hour. The LTB/UTB icon logic means she never manually re-colors a table for a cost KPI that should turn green when it goes down.
David runs inside sales at a mid-market distribution company. He uses the KPI Trend Page to present monthly leadership reviews — two combo charts show each KPI vs. target and vs. last year — while the drill-through Definition page answers “how is this calculated?” before anyone asks.
❓ Frequently Asked Questions
What does the Sales Funnel KPI Dashboard in Power BI track?
The Sales Funnel KPI Dashboard in Power BI tracks any KPI you define, showing 16 data points per KPI: Actual CY MTD, Target CY MTD, MTD achievement icon, Target vs Actual MTD %, PY MTD, CY vs PY MTD %, Actual CY YTD, Target CY YTD, YTD icon, Target vs Actual YTD %, PY YTD, and CY vs PY YTD %. All KPIs update automatically when you refresh the Excel data source.
Do I need Power BI Pro to use this dashboard?
No. The Sales Funnel KPI Dashboard in Power BI runs on the free Power BI Desktop application, available from Microsoft at no cost. Power BI Pro is only required if you want to publish the report to Power BI Service for team sharing in the cloud.
Can I add my own KPIs to this dashboard?
Yes. Fill the KPI Definition worksheet with your own KPI names, groups, units, formulas, definitions, and types (LTB or UTB). The dashboard reads the KPI list dynamically — there are no hard-coded KPI names in the Power BI file, so any sales funnel KPI set works.
What is the difference between LTB and UTB in this template?
LTB (Lower The Better) applies to KPIs where lower is better performance, such as Cost per Lead or Churn Rate. UTB (Upper The Better) applies where higher is better, such as Conversion Rate or Revenue. The Sales Funnel KPI Dashboard uses this flag to color ▼/▲ icons correctly — green always means good performance regardless of direction.
How does the KPI Trend Page work?
Select any KPI from the left-side slicer on the Trend Page and two combo charts update instantly: one for MTD and one for YTD, each plotting Current Year Actual, Previous Year Actual, and Target across all months. This makes it easy to spot seasonal patterns and present performance trends to leadership.
How does this compare to Salesforce Reports?
Salesforce Reports cost $25–300 per user per month and require an active CRM subscription. The Sales Funnel KPI Dashboard in Power BI costs $11.99 once and includes MTD/YTD dual tracking with prior-year benchmarks. For manual-entry KPI monitoring, this template delivers executive-level reporting at a fraction of the cost.
Can I drill through to see KPI formulas and definitions?
Yes. Right-click any KPI row on the Summary Page and use the drill-through option to navigate to the KPI Definition page. This hidden page shows the full formula, business definition, KPI Group, Unit, and LTB/UTB type. A Back button on the top-left returns to the Summary Page.
👤 About the Author
Built by PK — Microsoft Certified Professional with 15+ years of Excel, Google Sheets, and Power BI experience. Founder of NextGenTemplates, reaching 300K+ subscribers across YouTube channels (@PK-AnExcelExpert, @NextGenTemplates, @NeoTechNavigators). Every template is hand-built and tested before release.
🔗 Explore Related Templates
Also available as: Sales Funnel KPI Dashboard in Google Sheets — the same MTD/YTD KPI logic in a no-install Google Sheets format for teams without Power BI Desktop.
📊 Sales and Revenue Command Center Dashboard in HTML — browser-based sales analytics with Chart.js visuals and CSV export, no software needed.
📊 CRM Dashboard in HTML — customer relationship tracking and pipeline analytics in a standalone browser file.
🌐 Browse all Power BI KPI Dashboard Templates → | Power BI Dashboard Templates →
📖 Click here to read the Detailed Blog Post
🎥 Visit our YouTube channel for step-by-step video tutorials
👉 YouTube.com/@NextGenTemplates


Reviews
There are no reviews yet.