
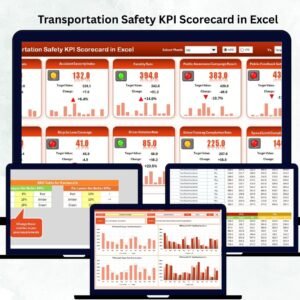
The Transportation Safety KPI Scorecard In Google Sheets monitors 10 safety-focused KPIs across 4 structured worksheets, with automated MTD and YTD calculations, traffic light indicators, and trend charts. Setup takes under 10 minutes — replace the sample data and every scorecard metric updates automatically.
🌍 Join 8,400+ teams in 40+ countries using NextGenTemplates to replace paid SaaS tools with one-time-purchase Excel, Google Sheets, Power BI, and HTML templates.
✅ Instant download · One-time payment · No subscription · No per-user fees · Lifetime access
🔑 Key Features of Transportation Safety KPI Scorecard In Google Sheets
📊 10 Transportation Safety KPIs — Track accident rate, injury frequency, vehicle inspection pass rate, driver safety score, near-miss incident rate, seat belt compliance, hours of service violations, cargo securement compliance, hazardous material incident rate, and emergency response time across all your fleet operations.
📅 MTD and YTD Performance Views — Toggle between Month-to-Date and Year-to-Date analysis using dropdown selectors. Each view recalculates all KPI values, percentage changes, and visual indicators instantly.
🚦 Traffic Light Performance Indicators — Green, yellow, and red color coding highlights which safety KPIs meet targets, which need attention, and which require immediate action. Managers identify risks in seconds.
🔼 Up and Down Arrows for % Change — Percentage change arrows show whether each KPI improved or declined compared to the previous period, making month-over-month trends visible at a glance.
📈 KPI Trend Analysis Charts — Select any KPI from a dropdown and view its 12-month performance trend with Actual, Target, and Previous Year lines displayed side by side.
🔍 Dynamic Month Dropdown — Select any month and the entire scorecard updates automatically. No manual recalculation or formula adjustments needed.
👥 Real-Time Collaboration — Because this scorecard runs in Google Sheets, safety managers, fleet supervisors, and compliance officers can update and review data simultaneously from any device.
⚙ Automated KPI Calculations — Enter raw safety data once. The scorecard automatically calculates KPI values, compares against targets, and generates performance indicators.
🎯 Target vs Actual Comparison — Every KPI displays actual performance alongside target values with variance calculations, enabling precise gap analysis for safety improvement planning.
📦 What’s Inside the Transportation Safety KPI Scorecard In Google Sheets
This scorecard template includes 4 worksheets designed for complete transportation safety KPI management:
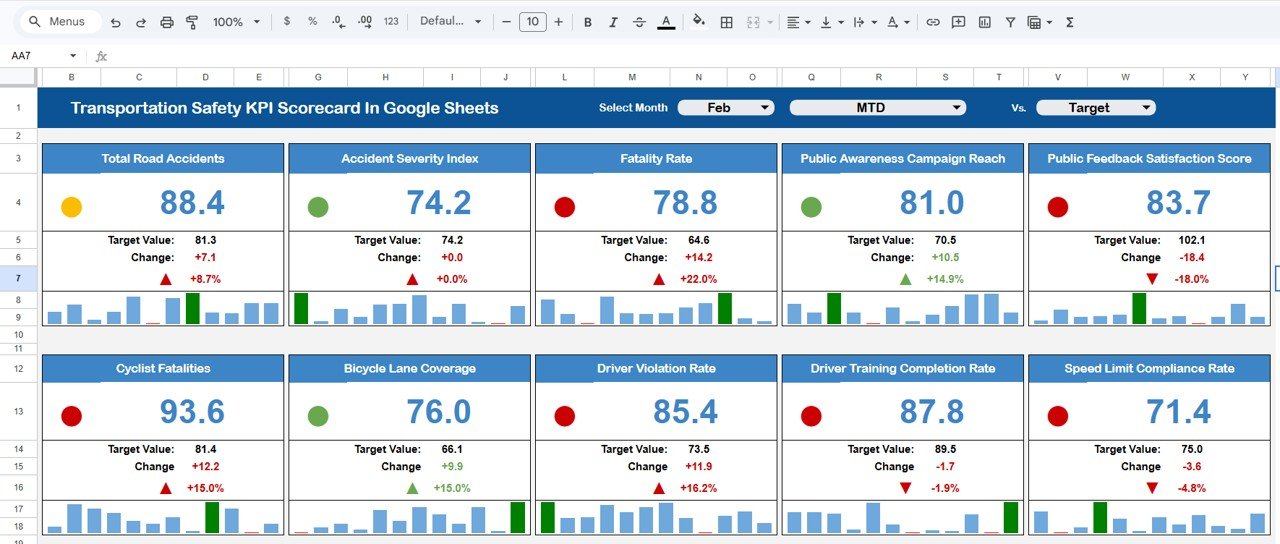
1️⃣ Scorecard Sheet — Central Safety Performance View
The Scorecard sheet is the main interface where you can view KPI performance. Key features include:
📋 Dropdown Menus — Select the month, MTD (Month-to-Date), or YTD (Year-to-Date) for performance analysis.
📊 Actual vs Target Values — Compare actual performance against targets for each KPI.
🚦 Visual Indicators — Quickly see performance status using color-coded traffic light indicators and conditional formatting.
📑 KPI Overview — Display all relevant information about KPIs, including MTD and YTD comparisons with percentage change arrows.
 Transportation Safety KPI Scorecard In Google Sheets
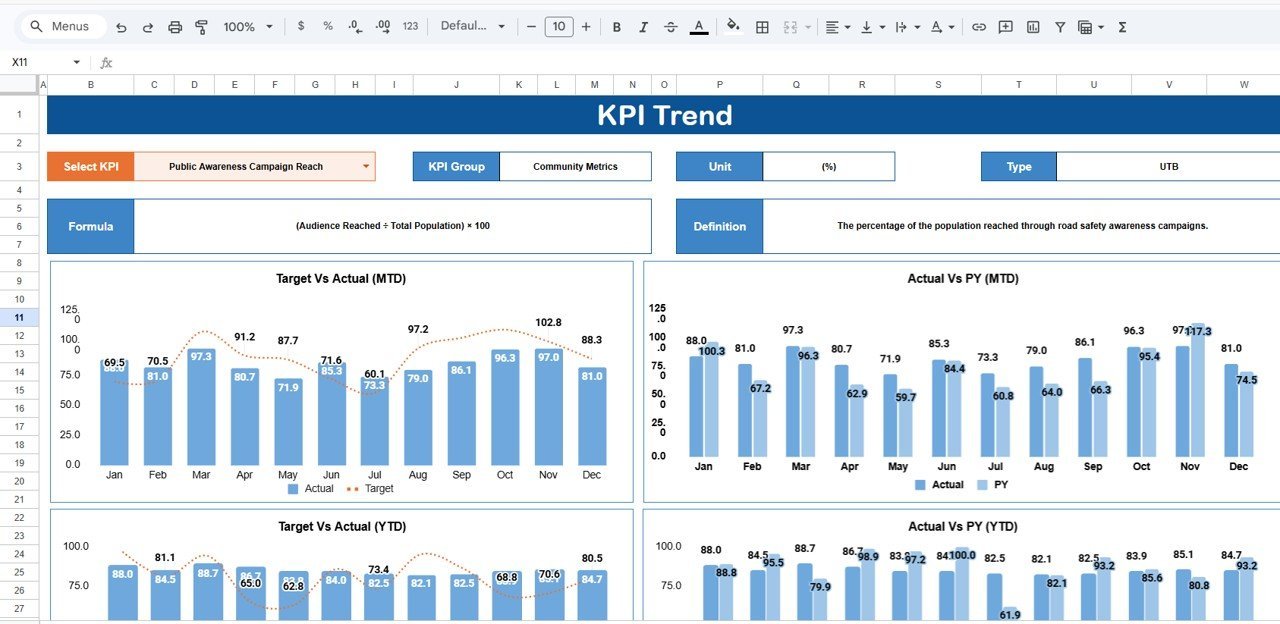
2️⃣ KPI Trend Sheet — Safety Performance Over Time
Here you can select the KPI name from the drop down available on range C3. The sheet displays the KPI Group, Unit of KPI, Type of KPI (Lower the Better or Upper the Better), Formula of the KPI and Definition of the KPI. MTD and YTD trend charts show Actual, Target, and Previous Year numbers side by side.
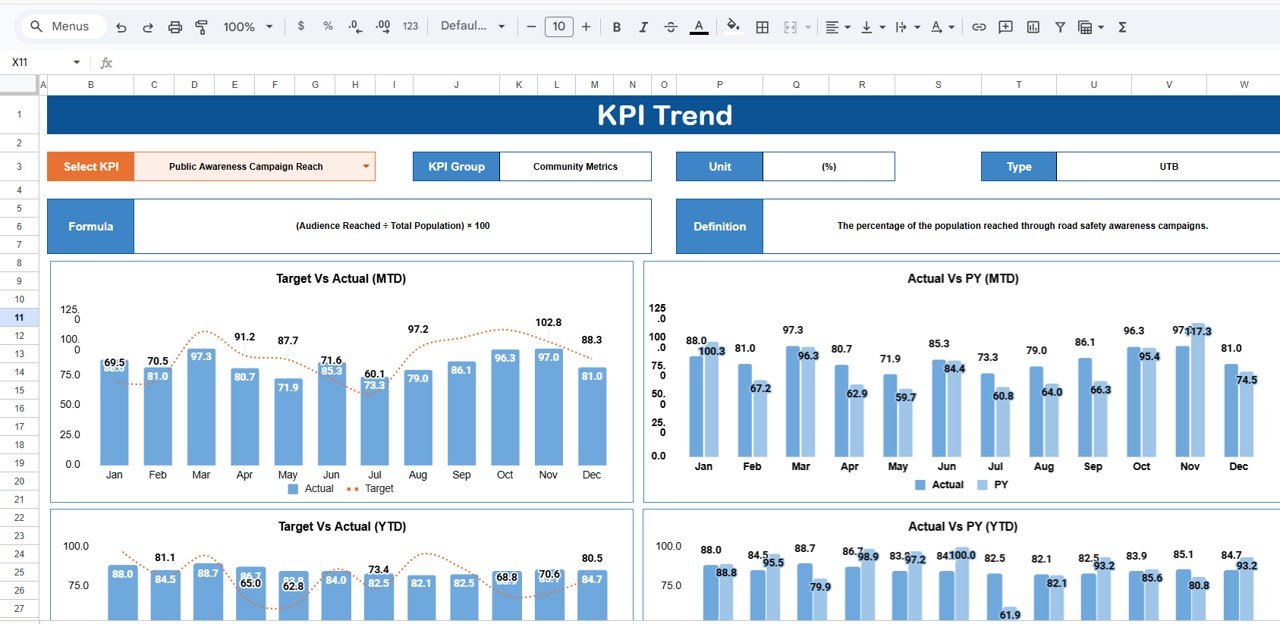 KPI Trend Sheet
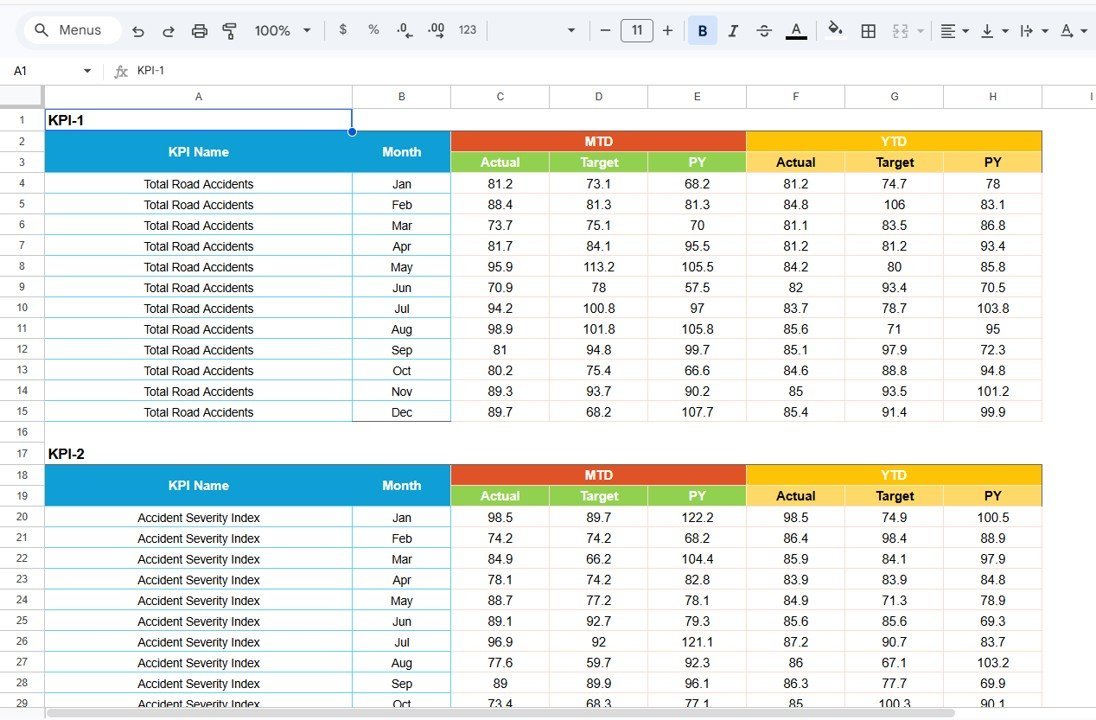
3️⃣ Input Data Sheet — Raw Safety Data Entry
The Input Data sheet is where you enter all KPI data. Record actual values, targets, and other metrics for each KPI. Easily update data as new results become available, ensuring the scorecard remains current and accurate.
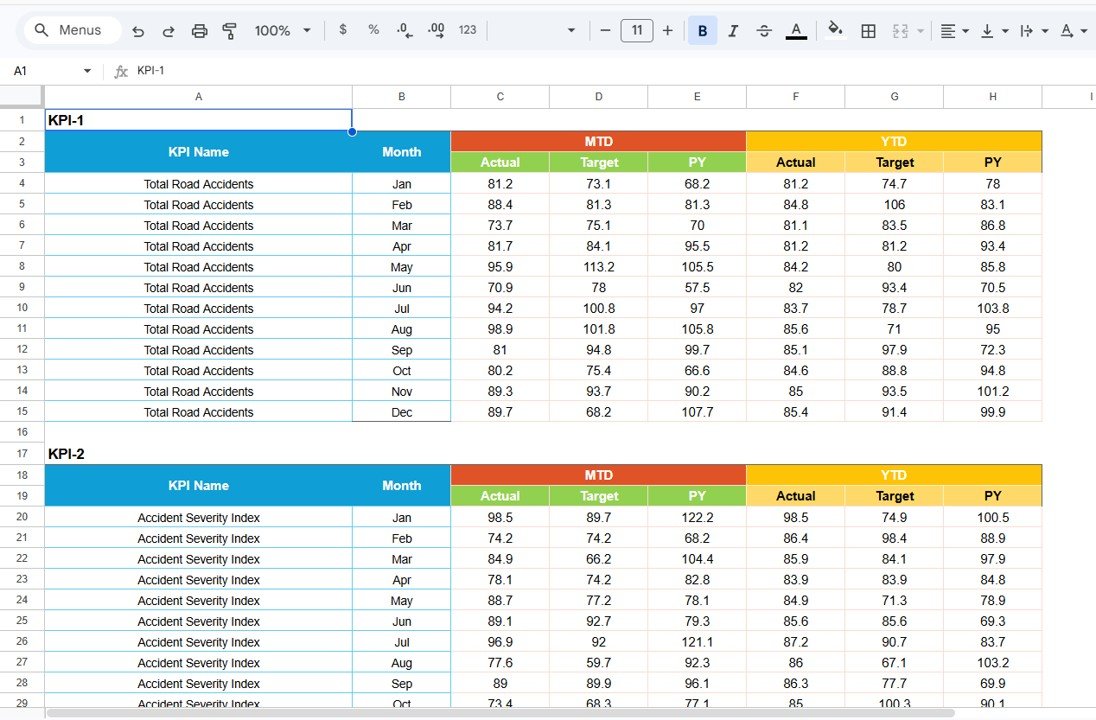 Input Data Sheet
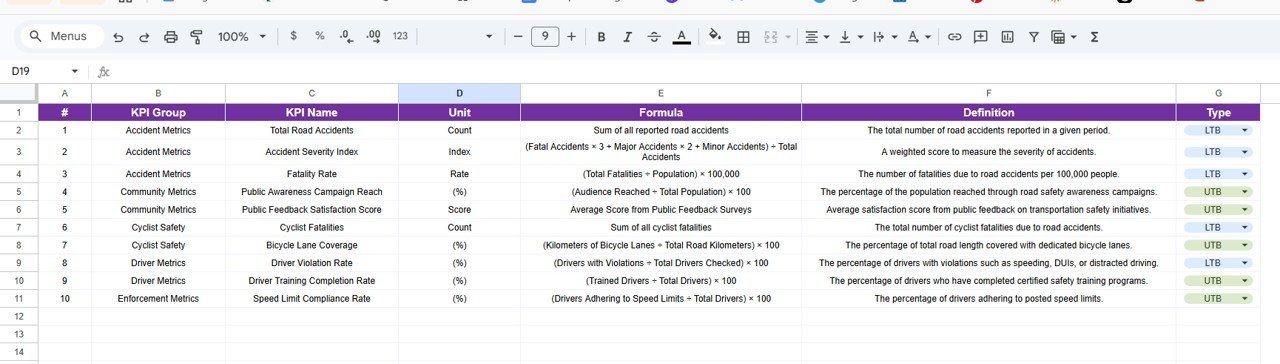
4️⃣ KPI Definition Sheet — Safety KPI Framework
In this sheet tab, you enter the KPI Name, KPI Group, Unit, Formula and KPI definition. This ensures every team member understands how each safety metric is calculated and what it measures.
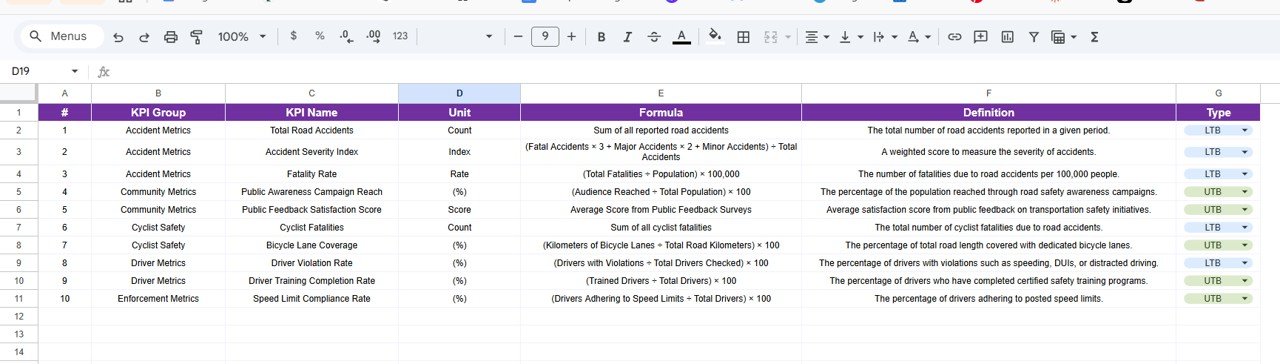 KPI Definition Sheet Tab
📊 Transportation Safety KPI Scorecard vs. Microsoft Excel vs. Paid Fleet Safety SaaS — Where This Fits
| Feature | Transportation Safety KPI Scorecard (Google Sheets) | Microsoft Excel Dashboard | Samsara / Lytx Fleet Safety |
|---|---|---|---|
| Cost | $8.99 one-time | $14.99+ one-time | $25-50 / vehicle / month |
| Platform | Google Sheets (cloud) | Desktop Excel | Proprietary SaaS |
| Setup Time | Under 10 minutes | 15-30 minutes | 2-4 weeks |
| Real-Time Team Collaboration | ✅ Built-in | ❌ Requires OneDrive | ✅ Yes |
| Mobile Access | ✅ Any browser | Limited | ✅ App required |
| Customizable KPIs | ✅ Fully editable | ✅ Fully editable | Limited to vendor fields |
| Share with Link | ✅ Instant | ❌ Email only | ✅ Within platform |
| Year-1 Cost (5 users) | $8.99 total | $14.99 total | $1,500-3,000+ |
| Safety Trend Charts | ✅ Built-in | ✅ Manual setup | ✅ Automated |
For safety teams that want structured KPI monitoring without paying per-vehicle SaaS fees, the Transportation Safety KPI Scorecard In Google Sheets sits in the sweet spot.
👥 Who This Template Is For — and Who It’s Not For
✅ This template is built for:
- Fleet safety managers at trucking and logistics companies with 10-500 vehicles
- Transportation compliance officers tracking FMCSA and DOT safety metrics
- Operations managers monitoring driver behavior, accident rates, and inspection results
- Small-to-midsize courier and delivery companies tracking safety KPIs monthly
❌ This template is NOT for:
- Enterprise fleets with 1,000+ vehicles needing real-time telematics integration
- Organizations requiring automated GPS-based safety scoring with hardware sensors
- Teams needing multi-location dashboards with role-based access controls
⚙️ How to Use the Transportation Safety KPI Scorecard In Google Sheets
1️⃣ Open the Google Sheets template and make a copy to your Google Drive
2️⃣ Define your safety KPIs in the KPI Definition sheet with names, groups, units, formulas, and definitions
3️⃣ Enter monthly safety data in the Input Data sheet including actual values and targets
4️⃣ Select any month from the dropdown on the Scorecard sheet to view performance
5️⃣ Toggle between MTD and YTD views to analyze short-term and long-term safety trends
6️⃣ Use the Trend sheet to drill into individual KPIs and identify patterns over 12 months
💼 Real-World Use Cases
Mike manages fleet safety at a 120-truck logistics company in Ohio. He uses the Transportation Safety KPI Scorecard In Google Sheets to track monthly accident rates, vehicle inspection pass rates, and hours-of-service violations. Before quarterly DOT audits, Mike pulls up YTD views and exports the data for compliance documentation — saving 6 hours of manual report preparation each quarter.
Priya leads operations at a 45-vehicle courier service in Dallas. She monitors driver safety scores and near-miss incidents weekly using the scorecard. When the traffic light turns red on seat belt compliance, Priya schedules targeted driver training sessions. Since implementing the scorecard, her company has reduced reportable incidents by 28% in 8 months.
Carlos runs a hazardous materials transport division. He tracks emergency response times and cargo securement compliance across 3 depot locations. The trend charts help him present safety performance improvements to insurance underwriters, which contributed to a 12% reduction in fleet insurance premiums last year.
❓ Frequently Asked Questions
What safety KPIs does the Transportation Safety KPI Scorecard track?
The Transportation Safety KPI Scorecard In Google Sheets tracks 10 key performance indicators including accident rate, injury frequency, vehicle inspection pass rate, driver safety score, near-miss incidents, seat belt compliance, hours-of-service violations, cargo securement compliance, hazmat incident rate, and emergency response time.
Can I customize the 10 KPIs in this scorecard?
Yes. You can edit, add, or replace any KPI in the KPI Definition sheet. Change the KPI name, group, unit, formula, and definition to match your specific fleet safety requirements. The scorecard recalculates automatically.
Does this scorecard work for DOT and FMCSA compliance reporting?
The Transportation Safety KPI Scorecard In Google Sheets provides structured monthly safety data with MTD and YTD tracking. While it does not auto-generate official DOT forms, it organizes your safety metrics for audit preparation and compliance reviews.
How long does setup take?
Setup takes under 10 minutes. Make a copy of the template in Google Drive, enter your KPI definitions, input your first month of safety data, and the scorecard calculates all metrics automatically.
Can multiple team members access the scorecard simultaneously?
Yes. Google Sheets supports real-time multi-user collaboration. Safety managers, fleet supervisors, and compliance officers can update data and review performance simultaneously from any device with internet access.
How does this compare to paid fleet safety software like Samsara?
Samsara and similar platforms cost $25-50 per vehicle per month and require hardware installation. The Transportation Safety KPI Scorecard costs $8.99 one-time with no recurring fees. It suits teams that want structured KPI tracking without telematics hardware dependency.
Does the scorecard update automatically when I change the month?
Yes. When you select a different month from the dropdown, all KPI values, traffic light indicators, percentage change arrows, and performance comparisons update instantly across the entire scorecard.
👤 About the Author
Built by PK — Microsoft Certified Professional with 15+ years of Excel, Google Sheets, and Power BI experience. Founder of NextGenTemplates, reaching 300K+ subscribers across YouTube channels (@PK-AnExcelExpert, @NextGenTemplates, @NeoTechNavigators). Every template is hand-built and tested before release.
🔗 Explore Related Templates
📊 Transportation Safety KPI Scorecard in Excel — The same safety KPI framework built for Microsoft Excel with advanced charting.
📊 Transportation KPI Scorecard in Google Sheets — Track broader transportation operations KPIs including delivery, fuel efficiency, and cost per KM.
📊 Supply Chain – Logistics KPI Scorecard in Google Sheets — Monitor end-to-end supply chain performance.
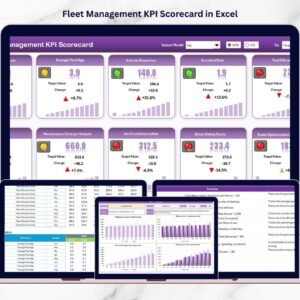
📊 Fleet Management KPI Scorecard in Excel — Fleet-focused KPI tracking for vehicle utilization and maintenance.
Browse all Google Sheets KPI Scorecard Templates
📖 Click here to read the Detailed Blog Post
🎥 Visit our YouTube channel for step-by-step video tutorials
👉 YouTube.com/@NextGenTemplates


Reviews
There are no reviews yet.