



The Ocean Conservation KPI Dashboard in Excel is an essential tool for organizations, researchers, and environmentalists dedicated to protecting and preserving our oceans. This Excel-based dashboard provides real-time insights into key performance indicators (KPIs) related to ocean conservation efforts, including pollution reduction, marine biodiversity, water quality, and sustainability practices. It enables you to track progress, measure success, and make data-driven decisions that contribute to the preservation of ocean ecosystems.
Whether you’re managing a marine conservation project, working on government-led initiatives, or running an environmental organization, the Ocean Conservation KPI Dashboard in Excel helps you track your efforts to protect marine life and promote sustainability. It empowers you to assess your impact and optimize strategies to meet ocean conservation goals effectively.
Key Features of the Ocean Conservation KPI Dashboard in Excel
🌊 Track Marine Biodiversity
Monitor the health of marine ecosystems and track biodiversity levels. Measure the populations of key species and evaluate the effectiveness of conservation strategies aimed at preserving marine life.
⚡ Pollution & Waste Management Tracking
Track the reduction of ocean pollution, including plastic waste, oil spills, and chemical contamination. Monitor cleanup efforts and assess the effectiveness of waste management strategies in mitigating environmental damage.
📈 Water Quality Monitoring
Measure the quality of ocean water, including parameters like pH, temperature, salinity, and pollution levels. Use this data to track environmental changes and take action to restore optimal water conditions.
💡 Sustainability Practices Evaluation
Monitor the adoption of sustainable practices, including the reduction of overfishing, habitat destruction, and resource depletion. Track efforts to promote sustainable fishing practices, marine protection areas, and eco-friendly policies.
🖥️ Interactive & Real-Time Data Insights
Gain real-time data on all key conservation metrics. The dashboard includes interactive charts, filters, and slicers that allow you to explore data in-depth and gain actionable insights.
Why You’ll Love the Ocean Conservation KPI Dashboard in Excel

✅ Monitor Marine Biodiversity
Track the health of marine ecosystems and species populations. Measure the success of conservation efforts and identify areas for improvement to protect marine life.
✅ Track Pollution & Waste Reduction
Monitor the reduction of ocean pollution and track the effectiveness of cleanup efforts. Use data-driven insights to improve waste management strategies and reduce pollution.
✅ Evaluate Water Quality
Measure ocean water quality and assess the impact of conservation efforts on water conditions. Use real-time data to take immediate action and improve water quality.
✅ Promote Sustainable Practices
Track the success of sustainable practices such as eco-friendly fishing methods, resource conservation, and habitat protection. Monitor the impact of sustainability programs on marine ecosystems.
✅ Data-Driven Decision Making
Leverage real-time insights to make informed decisions about ocean conservation strategies. Use data to refine efforts and ensure that marine ecosystems are protected for future generations.
What’s Inside the Ocean Conservation KPI Dashboard Template?
- Marine Biodiversity Tracking: Monitor the health of marine ecosystems and species populations.
- Pollution & Waste Management: Track the reduction of ocean pollution and assess waste management efforts.
- Water Quality Monitoring: Measure water quality indicators such as pH, temperature, and salinity.
- Sustainability Practices Tracking: Monitor sustainable practices, including eco-friendly fishing and resource conservation.
- Real-Time Data Insights: Get real-time data on key conservation metrics to optimize efforts.
- Customizable KPIs: Adjust the dashboard to track specific conservation goals and metrics.
How to Use the Ocean Conservation KPI Dashboard in Excel
1️⃣ Download the Template: Get instant access to your Ocean Conservation KPI Dashboard in Excel.
2️⃣ Input Your Data: Enter data related to marine biodiversity, pollution, water quality, and sustainability practices into the dashboard.
3️⃣ Track & Monitor KPIs: Use the dashboard to track the effectiveness of your conservation efforts in real-time.
4️⃣ Analyze & Optimize: Use insights from the dashboard to optimize your conservation strategies and improve the health of ocean ecosystems.
Who Can Benefit from the Ocean Conservation KPI Dashboard in Excel?
🔹 Environmental Organizations & NGOs
🔹 Marine Conservationists & Oceanographers
🔹 Government Agencies & Policy Makers
🔹 Sustainability Professionals
🔹 Research Institutions & Academics
🔹 Anyone Involved in Ocean Preservation & Marine Ecosystem Protection
Track and optimize your ocean conservation efforts with the Ocean Conservation KPI Dashboard in Excel. Measure biodiversity, pollution reduction, water quality, and sustainability practices to ensure a healthier ocean and a sustainable future.
Click here to read the Detailed blog post
Visit our YouTube channel to learn step-by-step video tutorials
Youtube.com/@PKAnExcelExpert
Compatibility and Requirements
- Works in Microsoft Excel desktop (Excel 2016 or later, or Microsoft 365).
- The dashboard uses interactive charts, filters and slicers. Microsoft explains slicers in Use slicers to filter data.
Frequently Asked Questions
Which KPIs does the Ocean Conservation dashboard track?
Marine biodiversity and species populations, pollution and waste reduction, water quality (pH, temperature, salinity) and sustainable practices.
Can I filter the data?
Yes. Interactive charts, filters and slicers let you explore the data in depth.
Can I track my own conservation goals?
Yes. The KPIs are customizable, so you can track your own goals and metrics.
Is there a Power BI or Google Sheets version?
Yes. See the Ocean Conservation KPI Dashboard in Power BI and the Ocean Conservation KPI Dashboard in Google Sheets.
Related Conservation Templates
- Ocean Conservation KPI Scorecard in Excel: a scorecard view of the same KPIs
- Ocean Conservation KPI Dashboard in Power BI: the same topic in Power BI
- Ocean Conservation KPI Dashboard in Google Sheets: the same topic in Google Sheets
- Marine & Ports KPI Dashboard in Excel: KPIs for marine and port operations
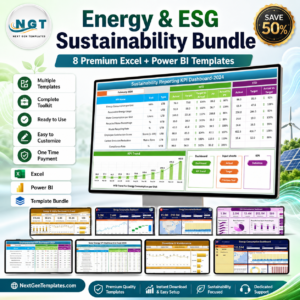
- Energy & ESG Sustainability Bundle: 8 sustainability templates in one download
Browse all Excel KPI dashboards or the Excel dashboards.


























Reviews
There are no reviews yet.