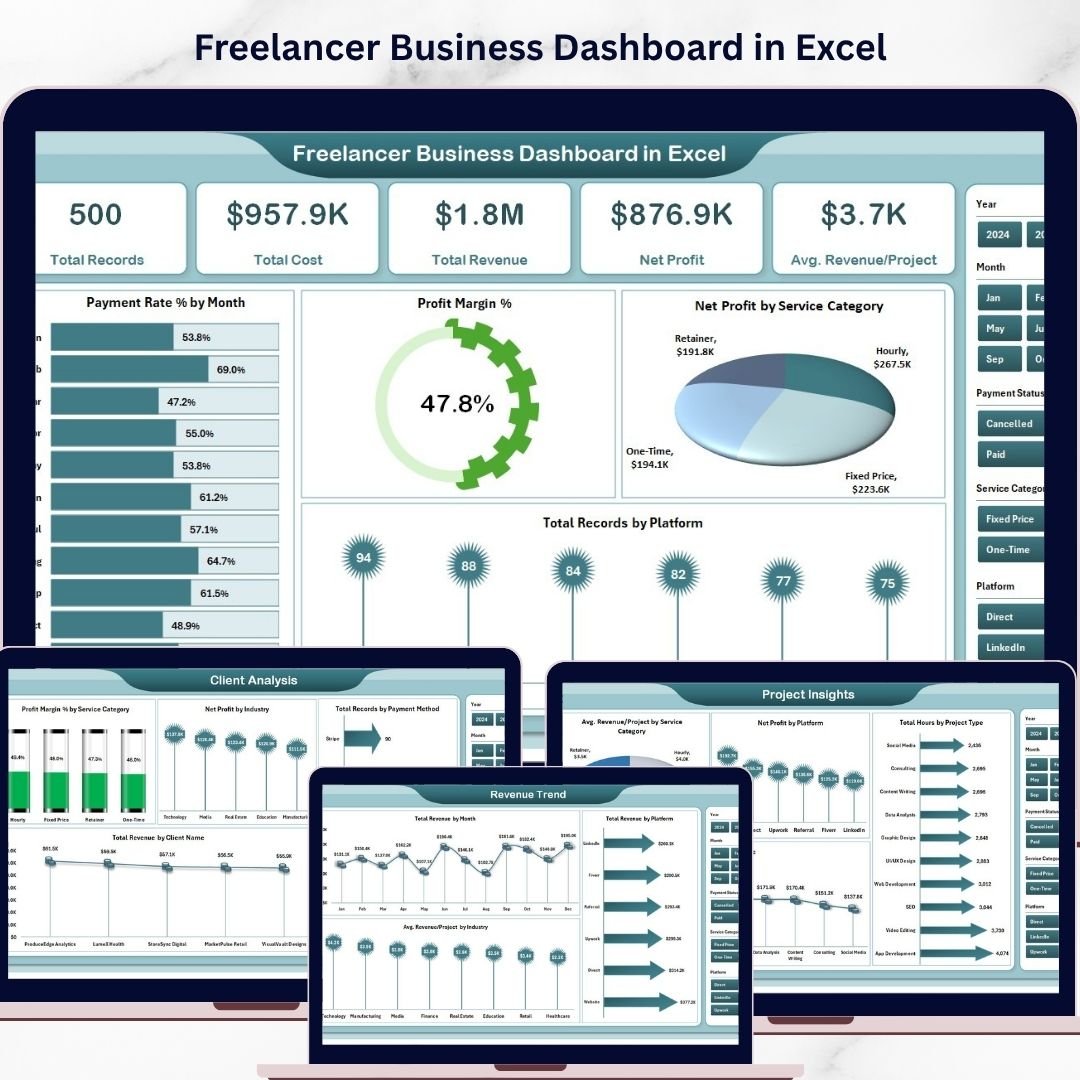
Freelancer Business Dashboard in Excel is a powerful, ready-to-use analytics template designed to help freelancers, independent consultants, and self-employed professionals track revenue, costs, profit margins, client performance, and project insights — all from one interactive Excel dashboard. This template includes 5 dynamic dashboard pages, a structured data sheet, and a support sheet with pivot tables that auto-refresh when you update your data 📊💼.
Whether you are a graphic designer, web developer, content writer, marketing consultant, or any type of freelancer, this Excel Dashboard Template transforms your raw freelance business data into clear, visual insights. Instead of tracking projects across scattered spreadsheets, you can now monitor your entire freelance operation from one centralized dashboard. Looking for a KPI-based scorecard approach? Check out the Freelance Business KPI Scorecard in Google Sheets for detailed performance monitoring.
🔑 Key Features of Freelancer Business Dashboard in Excel
📊 5 Interactive Dashboard Pages — Overview, Client Analysis, Project Insights, Payment Tracking, and Revenue Trend pages give you 360-degree visibility into your freelance business. This dashboard tracks 5 key metrics including Total Records, Total Cost, Total Revenue, Net Profit, and Avg. Revenue/Project across multiple analytical views.
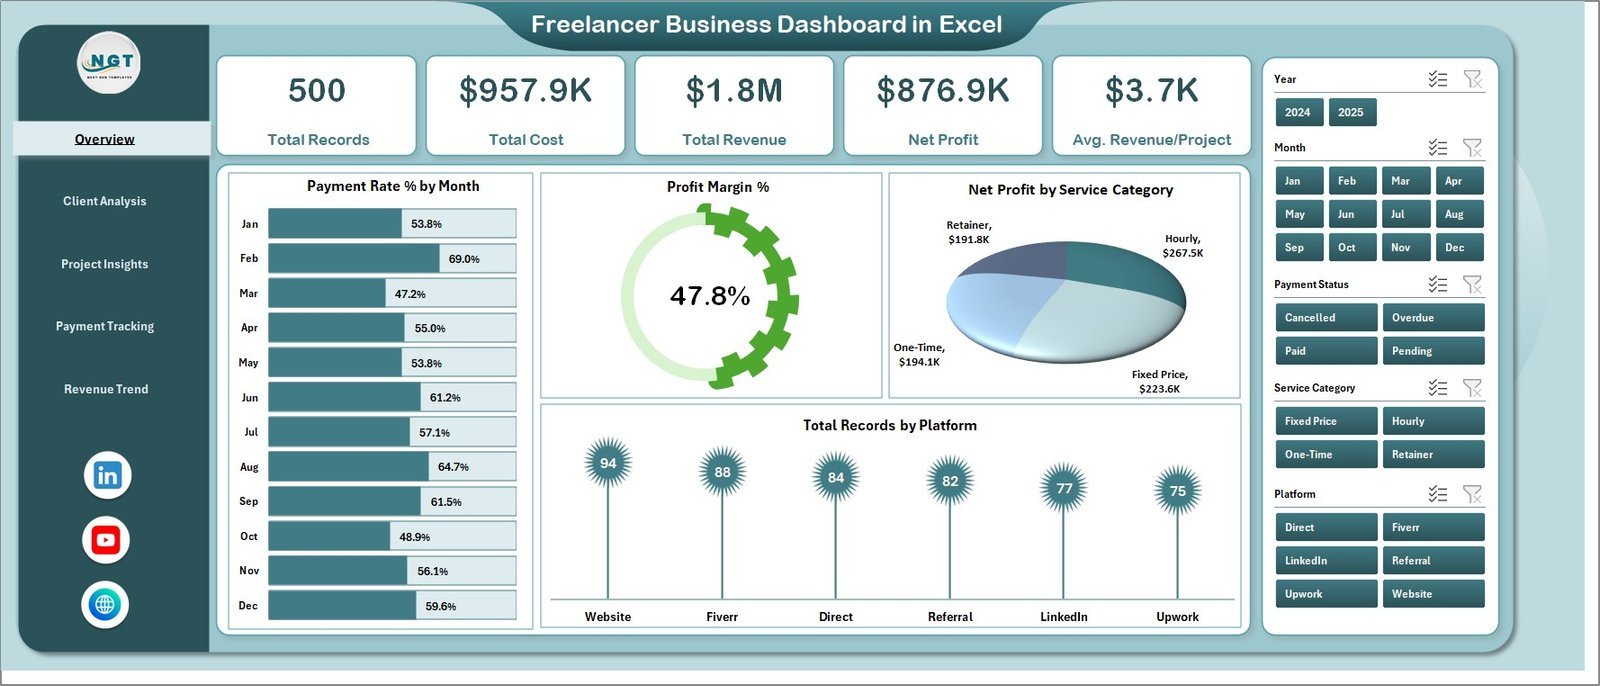
📈 Dynamic KPI Cards on Overview — Instantly view Total Records, Total Cost, Total Revenue, Net Profit, and Avg. Revenue/Project at the top of the Overview page for a quick executive summary of your freelance business health.
🎛 Multiple Slicers for Quick Filtering — Apply dynamic filters across the dashboard to drill down into specific service categories, platforms, clients, payment methods, and time periods instantly.
👥 Client-Level Performance Analysis — The Client Analysis page provides Profit Margin % by Service Category, Net Profit by Industry, Total Records by Payment Method, and Total Revenue by Client Name for complete client profitability tracking.
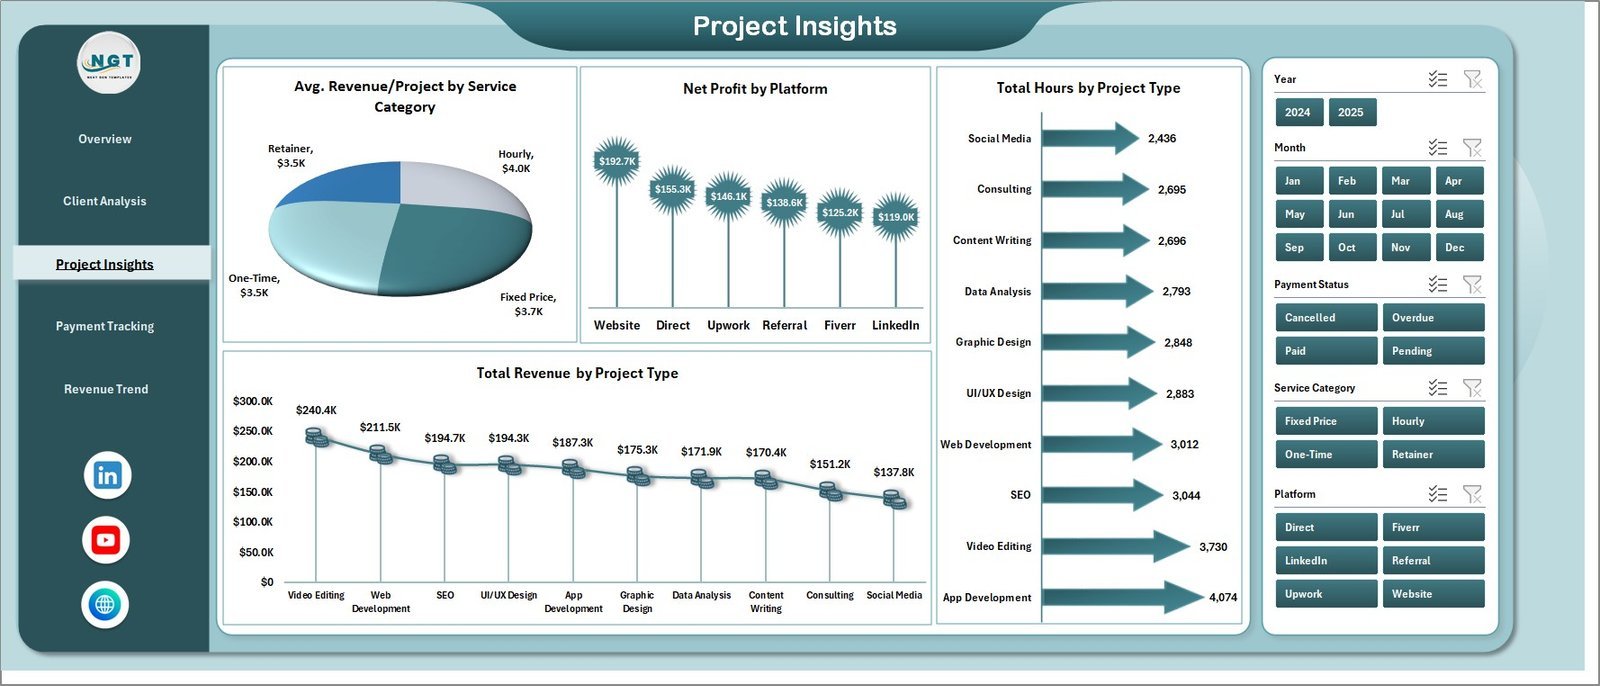
📋 Project-Level Insights — The Project Insights page features Avg. Revenue/Project by Service Category, Net Profit by Platform, Total Hours by Project Type, and Total Revenue by Project Type to help you identify your most profitable work.
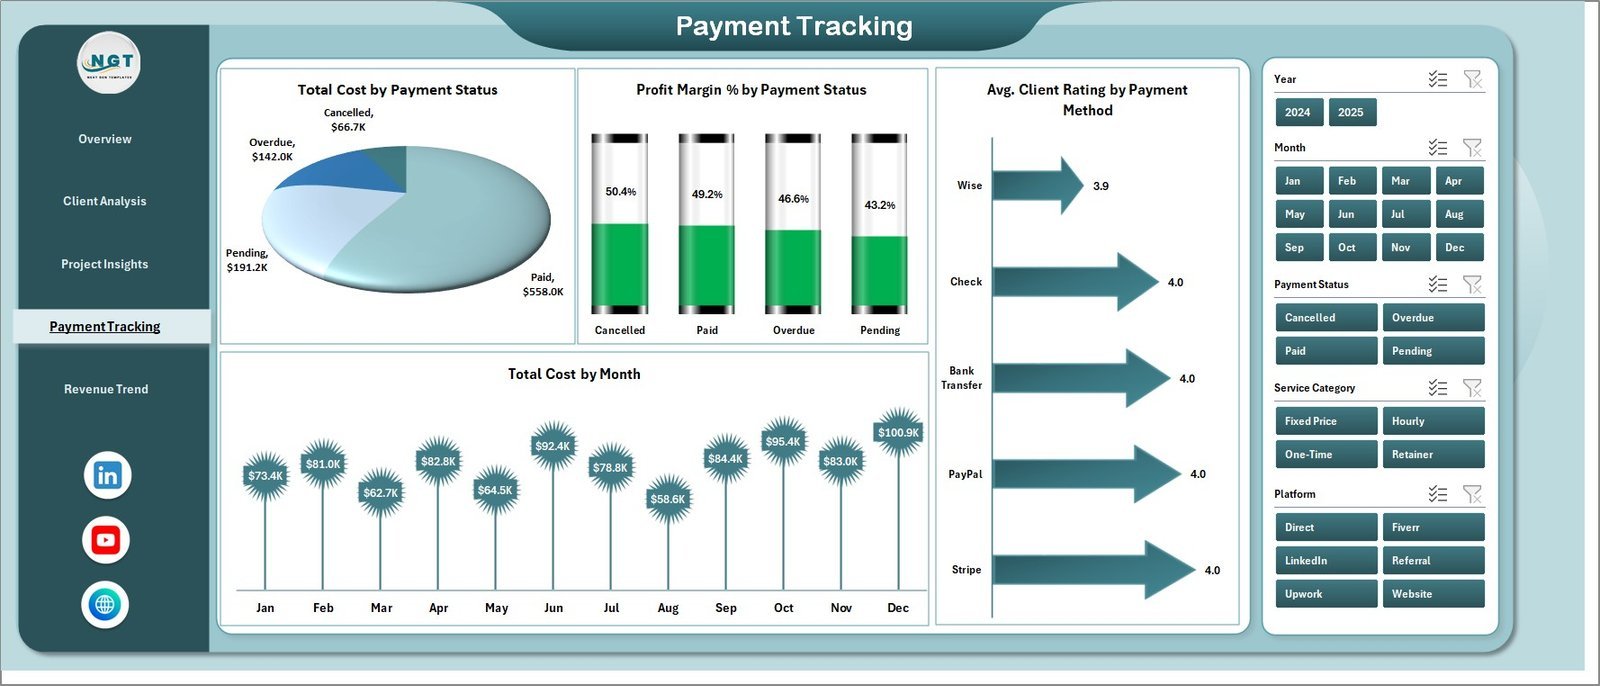
💳 Payment Monitoring and Tracking — Track Total Cost by Payment Status, Profit Margin % by Payment Status, Avg. Client Rating by Payment Method, and Total Cost by Month to ensure healthy cash flow management.
📈 Revenue Trend Analysis — Monitor Total Revenue by Month, Total Revenue by Platform, and Avg. Revenue/Project by Industry for long-term business growth planning.
⚡ Pivot-Powered Auto-Refresh — All charts are connected to pivot tables in the Support sheet. Simply refresh data and every visual updates automatically. No VBA or macros required.
🔧 Plug-and-Play Data Sheet — Replace sample data with your own freelance records in the structured Data Sheet and refresh all dashboards with one click.
Explore more business analytics templates including our Personal Finance Dashboard in Excel for personal financial tracking and the Excel Dashboard Templates collection.
📦 What’s Inside the Freelancer Business Dashboard in Excel
📊 Overview Page — Displays 5 KPI cards (Total Records, Total Cost, Total Revenue, Net Profit, Avg. Revenue/Project) alongside visual charts showing Payment Rate % by Month tracking the percentage of payments received over time, Profit Margin % monitoring your profitability trends, Net Profit by Service Category comparing earnings across different freelance services, and Total Records by Platform showing which platforms generate the most projects. Multiple slicers allow instant filtering across all dimensions.
 Overview Page
📊 Client Analysis Page — Deep-dive into client performance with Profit Margin % by Service Category revealing which services yield the highest margins, Net Profit by Industry showing your most profitable client sectors, Total Records by Payment Method tracking payment preferences, and Total Revenue by Client Name identifying your highest-value clients.
📊 Project Insights Page — Analyze project performance with Avg. Revenue/Project by Service Category showing which service types generate the most revenue per project, Net Profit by Platform comparing profitability across freelancing platforms, Total Hours by Project Type tracking time investment across project categories, and Total Revenue by Project Type identifying your most lucrative project types.
📊 Payment Tracking Page — Monitor cash flow with Total Cost by Payment Status tracking paid, pending, and overdue amounts, Profit Margin % by Payment Status comparing profitability across payment statuses, Avg. Client Rating by Payment Method showing client satisfaction by payment channel, and Total Cost by Month revealing monthly expense patterns.
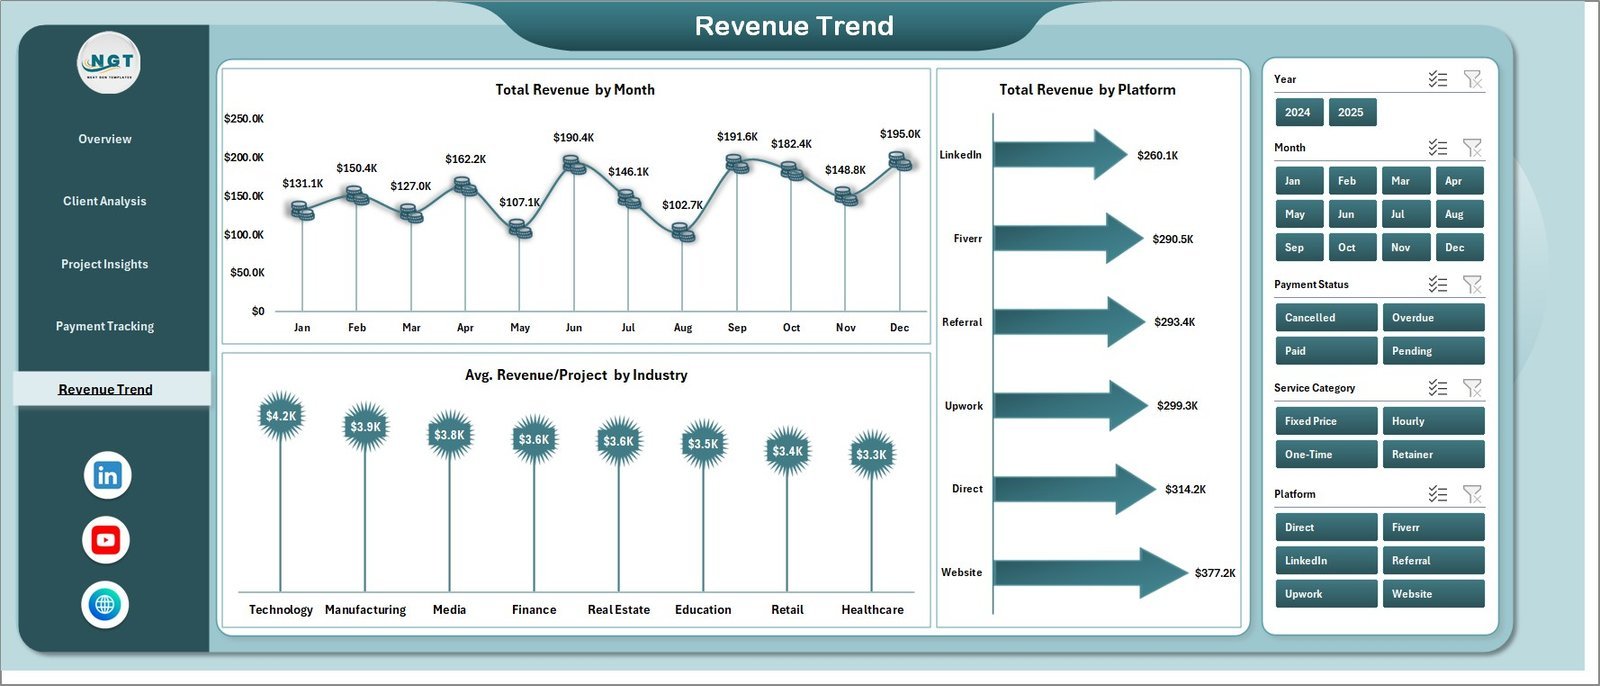
📊 Revenue Trend Page — Track your business growth with Total Revenue by Month showing monthly earnings trajectory, Total Revenue by Platform comparing income across different freelance platforms, and Avg. Revenue/Project by Industry revealing which industries pay the most per project.
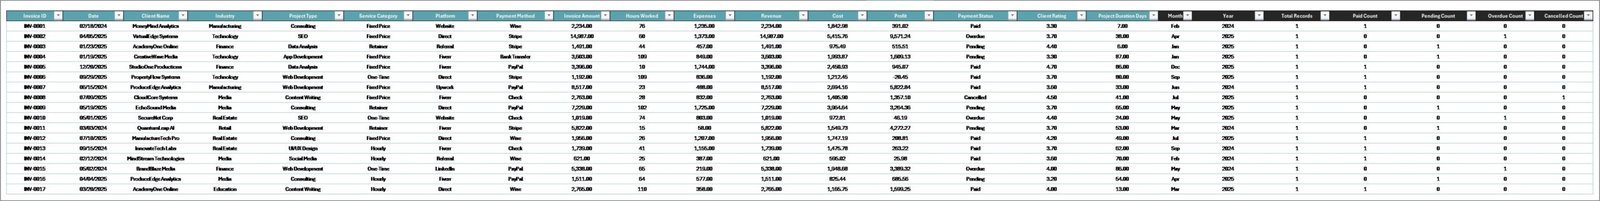
📊 Data Sheet — This is your data entry point. Add your freelance project records in the same format, and the entire dashboard auto-updates upon refresh.
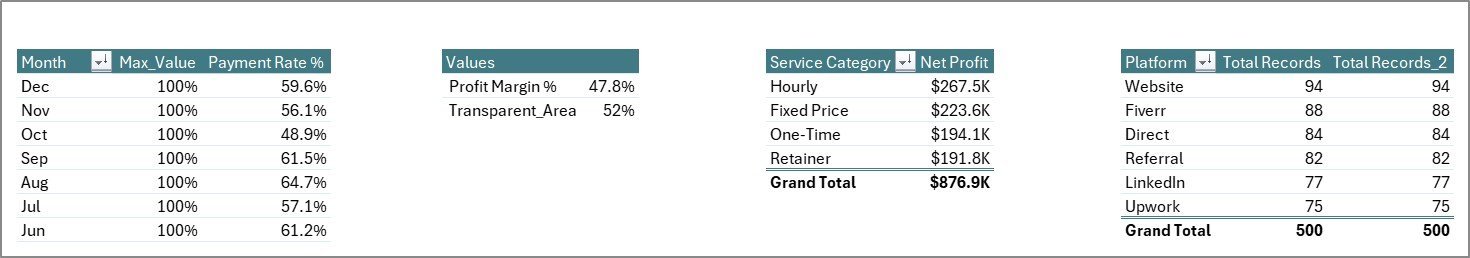
📊 Support Sheet — Contains all pivot tables that power the dashboard charts. After updating data, go to the Data tab in the Excel Ribbon and click Refresh All. All pivots and charts update instantly. You can keep this sheet hidden during regular use.
⚙️ How to Use the Freelancer Business Dashboard in Excel
1️⃣ Download and Open — Download the ZIP file, extract it, and open the Excel file in Microsoft Excel (2016 or later recommended).
2️⃣ Go to the Data Sheet — Navigate to the Data Sheet tab and replace the sample data with your own freelance project records in the same column format.
3️⃣ Refresh the Dashboard — Click on the Data tab in the Excel Ribbon and select Refresh All. All pivot tables and charts will update automatically.
4️⃣ Use Slicers for Filtering — On the Overview page, use the built-in slicers to filter data by specific service categories, platforms, clients, or time periods.
5️⃣ Explore All 5 Pages — Navigate through Overview, Client Analysis, Project Insights, Payment Tracking, and Revenue Trend tabs for complete freelance business analytics.
👥 Who Can Benefit from This Freelancer Business Dashboard in Excel
🎨 Creative Freelancers — Graphic designers, photographers, videographers, and content creators can track project revenue, client profitability, and service performance.
💻 Tech Freelancers — Web developers, app developers, and IT consultants can monitor project hours, platform performance, and payment tracking.
📝 Content and Marketing Freelancers — Writers, SEO specialists, and social media managers can analyze revenue trends and client engagement metrics.
📊 Consulting Professionals — Business, financial, and management consultants can track client revenue, profit margins, and project profitability.
🚀 Freelance Entrepreneurs — Anyone running a freelance business who wants a professional, data-driven approach to business growth and financial health.
❓ Frequently Asked Questions
What metrics does the Freelancer Business Dashboard in Excel track?
The Freelancer Business Dashboard in Excel tracks 5 key metrics on the Overview page: Total Records, Total Cost, Total Revenue, Net Profit, and Avg. Revenue/Project. Additional analysis across 5 interactive pages covers client profitability, project insights, payment status tracking, and monthly revenue trends.
Do I need advanced Excel skills to use this dashboard?
No. This dashboard requires no advanced Excel skills. Simply replace the sample data in the Data Sheet with your own freelance records and click Refresh All in the Data tab. All charts and KPI cards update automatically through pivot tables.
Can I track multiple freelance platforms in this dashboard?
Yes. The data structure supports multiple platforms, and the dashboard includes platform-level analysis in the Project Insights page showing Net Profit by Platform and in the Revenue Trend page showing Total Revenue by Platform.
Does this template work without VBA or macros?
Yes. The Freelancer Business Dashboard in Excel is 100% formula and pivot-table based. No VBA or macros are required. It works in Microsoft Excel 2016 and later versions without needing to enable macros.
What is the best Excel dashboard for tracking freelance business performance?
The Freelancer Business Dashboard in Excel from NextGen Templates is one of the most comprehensive freelance analytics templates available. It includes 5 interactive pages covering overview metrics, client analysis, project insights, payment tracking, and revenue trends — all in a single Excel file ready for immediate use.
🔗 Explore Related Templates
🔹 Freelance Business KPI Scorecard in Google Sheets — A KPI-focused scorecard for freelancers with Actual vs Target comparisons and trend analysis.
🔹 Personal Finance Dashboard in Excel — Track personal income, expenses, budgets, and savings alongside your freelance business finances.
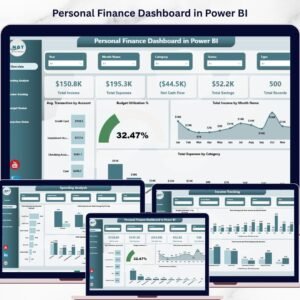
🔹 Personal Finance Dashboard in Power BI — Advanced financial analytics with 5 interactive Power BI pages for comprehensive financial tracking.
📖 Click here to read the Detailed Blog Post
🎥 Visit our YouTube channel to learn step-by-step video tutorials
👉 YouTube.com/@NextGenTemplates
Watch the step-by-step video tutorial:
YouTube


Reviews
There are no reviews yet.