
Key Features of Debt-to-Equity Ratio KPI Dashboard in Google Sheets
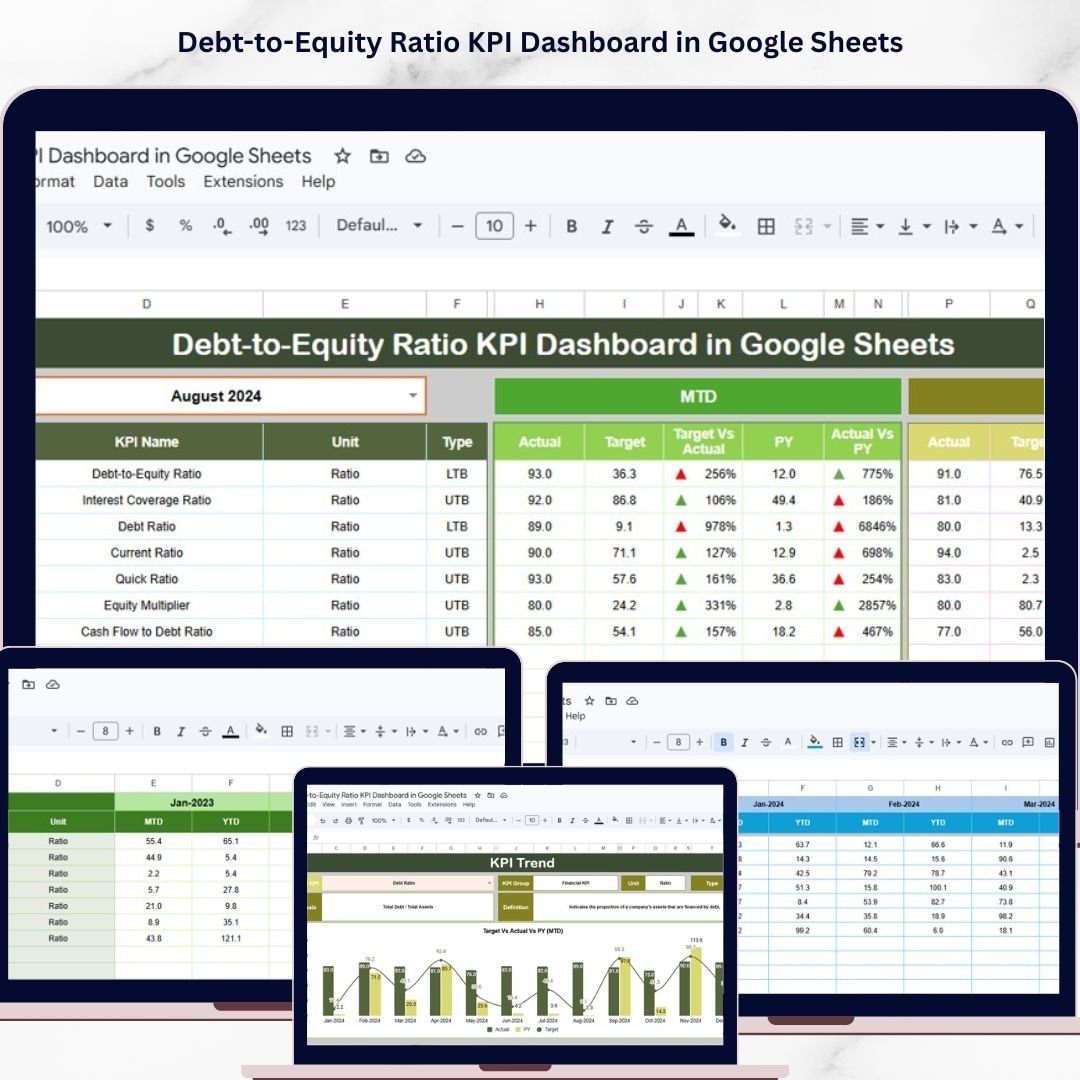
Unlock the power of financial clarity with our Debt-to-Equity Ratio KPI Dashboard in Google Sheets – a dynamic, ready-to-use template designed specifically to track, analyze, and visualize your company’s debt-to-equity ratio effortlessly. This dashboard provides a comprehensive snapshot of your financial health, empowering you to make informed decisions and optimize your capital structure.
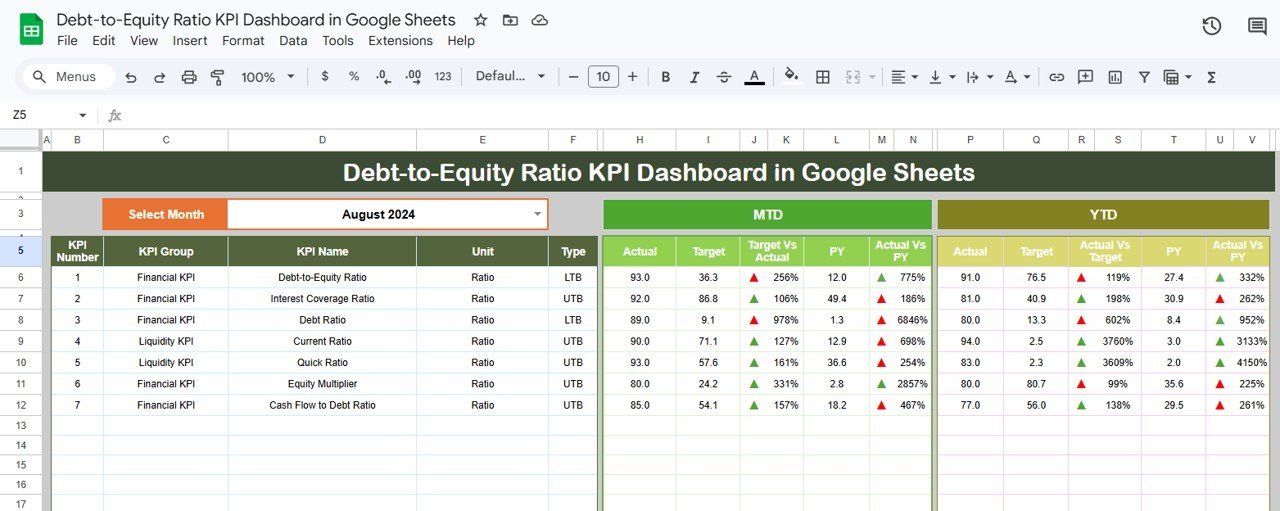
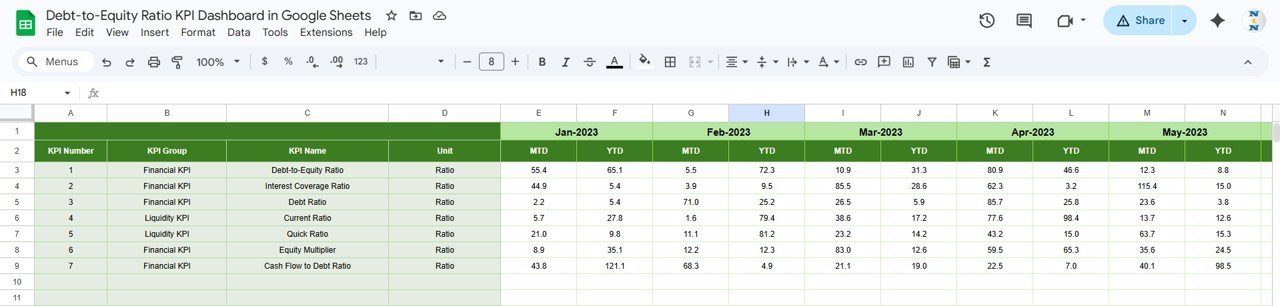
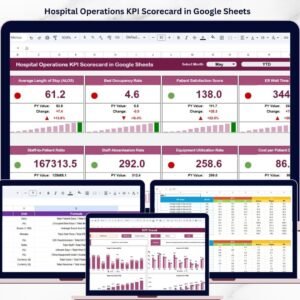
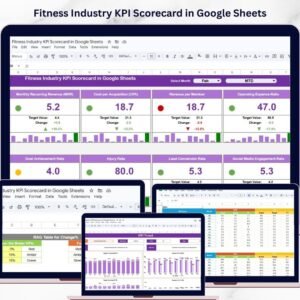
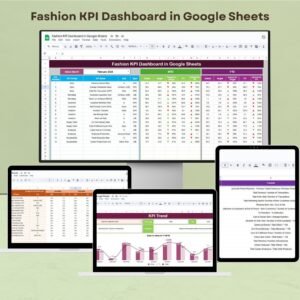
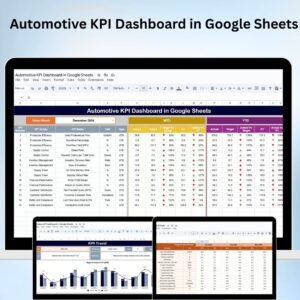
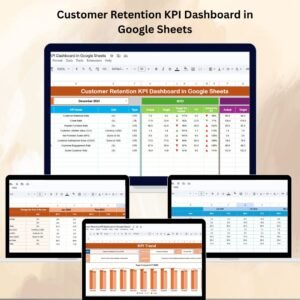
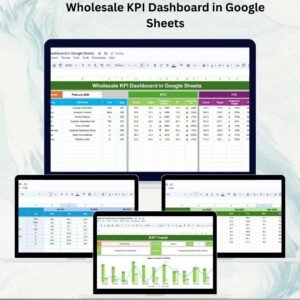
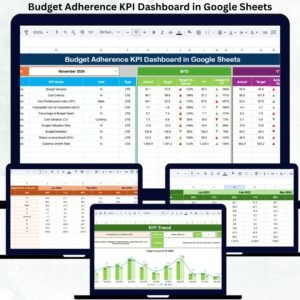
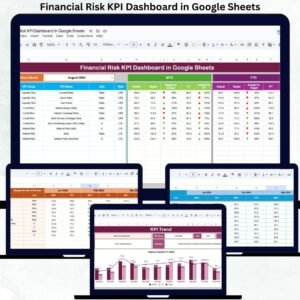
Featuring 6 interactive worksheets, this dashboard offers unparalleled flexibility and insight. The main Dashboard sheet allows you to select any month via an intuitive drop-down menu, instantly updating all KPI numbers. It displays Month-to-Date (MTD) actuals, targets, and previous year data, with conditional formatting and up/down arrows to highlight performance trends. Additionally, the dashboard includes Year-to-Date (YTD) comparisons, enabling you to monitor progress and spot potential issues early.
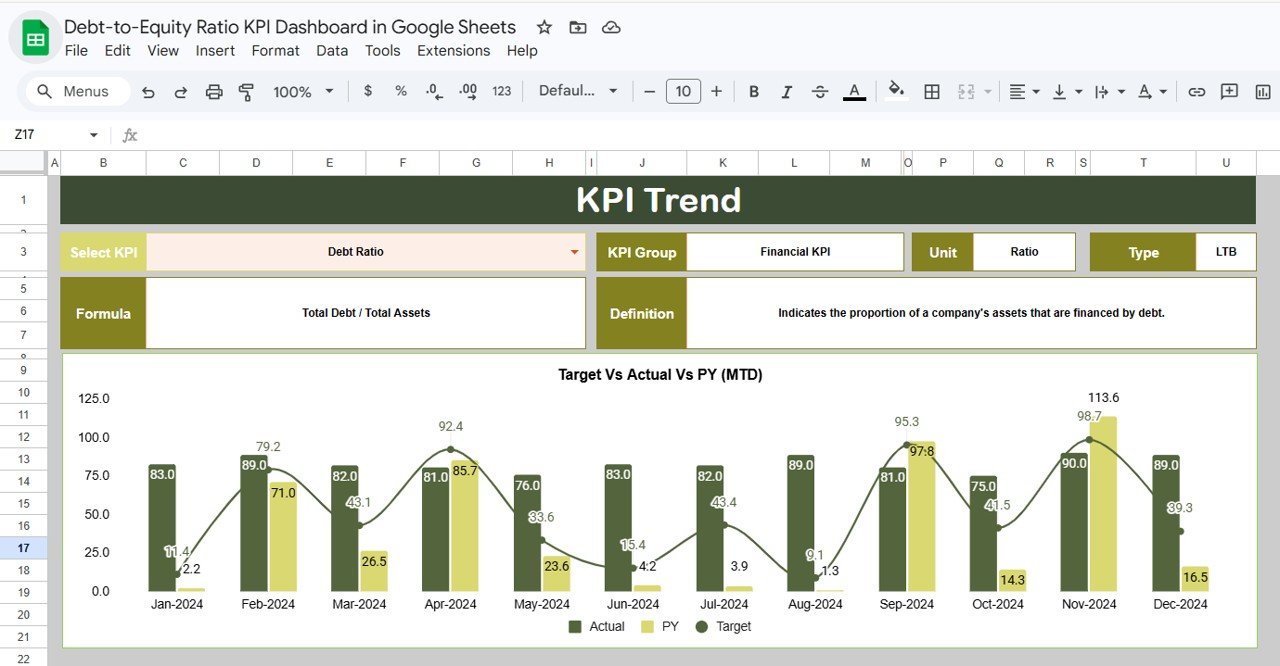
The KPI Trend sheet provides a deep dive into individual KPIs. Select any KPI from the drop-down to view its group, unit, formula, and definition. You’ll also find compelling MTD and YTD trend charts showing actual, target, and previous year figures side-by-side, helping you track performance over time visually.
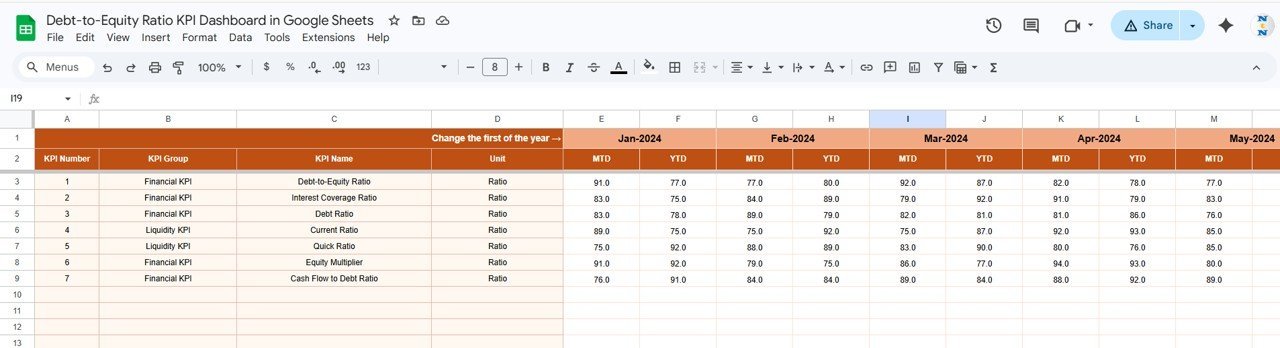
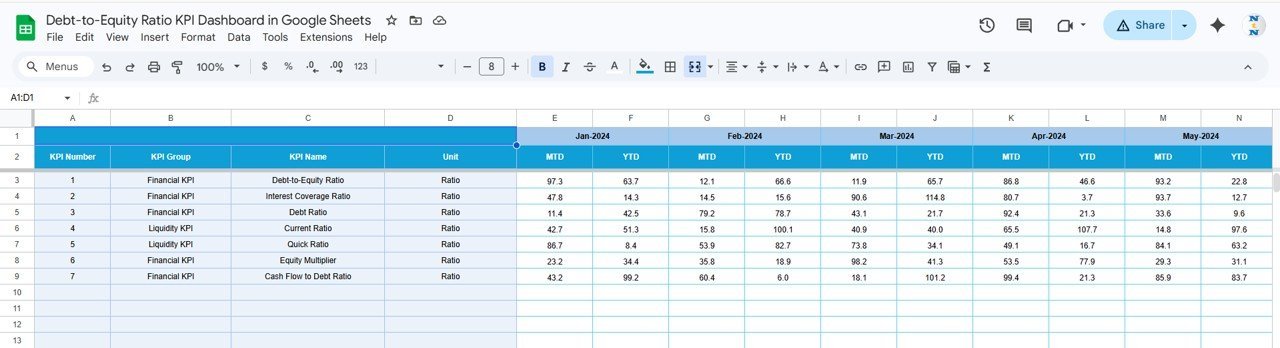
Data entry is seamless with dedicated sheets for Actual Numbers Input, Target Number Input, and Previous Year Number Input. Simply enter your monthly figures, and the dashboard dynamically updates. The Actual Numbers Input sheet lets you set the first month of the year, ensuring accurate date alignment. The Target Number Input sheet captures your goals for each KPI, while the Previous Year Number sheet stores last year’s data for meaningful comparisons.
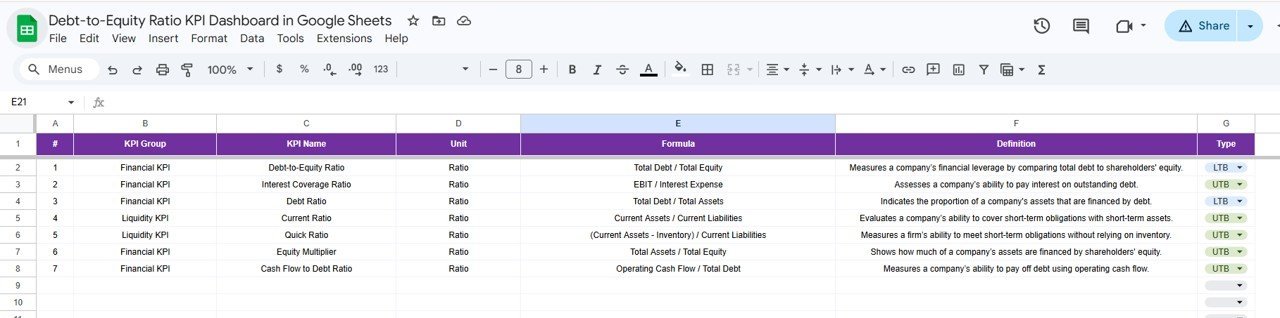
Finally, the KPI Definition sheet serves as your reference guide, where you can define KPI names, groups, units, formulas, and specify whether the KPI is Lower The Better (LTB) or Upper The Better (UTB). This clarity ensures your team understands each metric’s importance and target direction.
What’s Inside the Debt-to-Equity Ratio KPI Dashboard in Google Sheets
- 📊 Dashboard Sheet: Main control panel with interactive month selection and comprehensive MTD/YTD KPI stats with conditional formatting.
- 📈 KPI Trend Sheet: Pick any KPI to view detailed data, definitions, and trend charts showcasing performance over time.
- ✍️ Actual Numbers Input Sheet: Enter monthly actual results efficiently with customizable start month.
- 🎯 Target Number Input Sheet: Define your monthly goals for each KPI to monitor progress against expectations.
- 📅 Previous Year Number Input Sheet: Input last year’s data for accurate year-over-year comparison and trend analysis.
- 📚 KPI Definition Sheet: Clear descriptions, formulas, units, and KPI types (LTB or UTB) to keep your team aligned.
How to Use the Debt-to-Equity Ratio KPI Dashboard in Google Sheets
- 🚀 Step 1: Open the dashboard and set your fiscal year’s first month in the Actual Numbers Input sheet.
- 📥 Step 2: Input your actual monthly debt and equity figures, targets, and previous year data in the respective sheets.
- 📅 Step 3: Use the Dashboard sheet’s drop-down menu to select the month you want to analyze.
- 📊 Step 4: Review KPIs on the Dashboard with clear visual cues like conditional formatting and trend arrows to identify performance gaps.
- 📈 Step 5: Dive deeper into specific KPIs via the KPI Trend sheet to understand trends and adjust strategies accordingly.
- 📝 Step 6: Update KPI definitions as needed in the KPI Definition sheet to keep your metrics relevant and well-understood.
Who Can Benefit from This Debt-to-Equity Ratio KPI Dashboard in Google Sheets
- 🏢 Finance Managers: Gain instant insights into your company’s leverage to optimize capital structure.
- 📊 Business Analysts: Use visual trends and comparisons to support strategic financial recommendations.
- 💼 Small & Medium Businesses: Easily track your debt-to-equity ratio without complex software.
- 📈 Startups & Entrepreneurs: Monitor financial health and impress investors with clear data presentations.
- 👥 Consultants & Advisors: Provide clients with a professional, ready-to-use tool for financial KPI tracking.
This Debt-to-Equity Ratio KPI Dashboard in Google Sheets is your all-in-one solution to streamline financial monitoring, improve decision-making, and elevate business performance. Its user-friendly interface combined with powerful analytics makes it the perfect digital product for anyone serious about financial management.
Debt-to-Equity Ratio KPI Dashboard in Google Sheets
Click here to read the Detailed blog post.
Visit our YouTube channel to learn step-by-step video tutorials.


Reviews
There are no reviews yet.