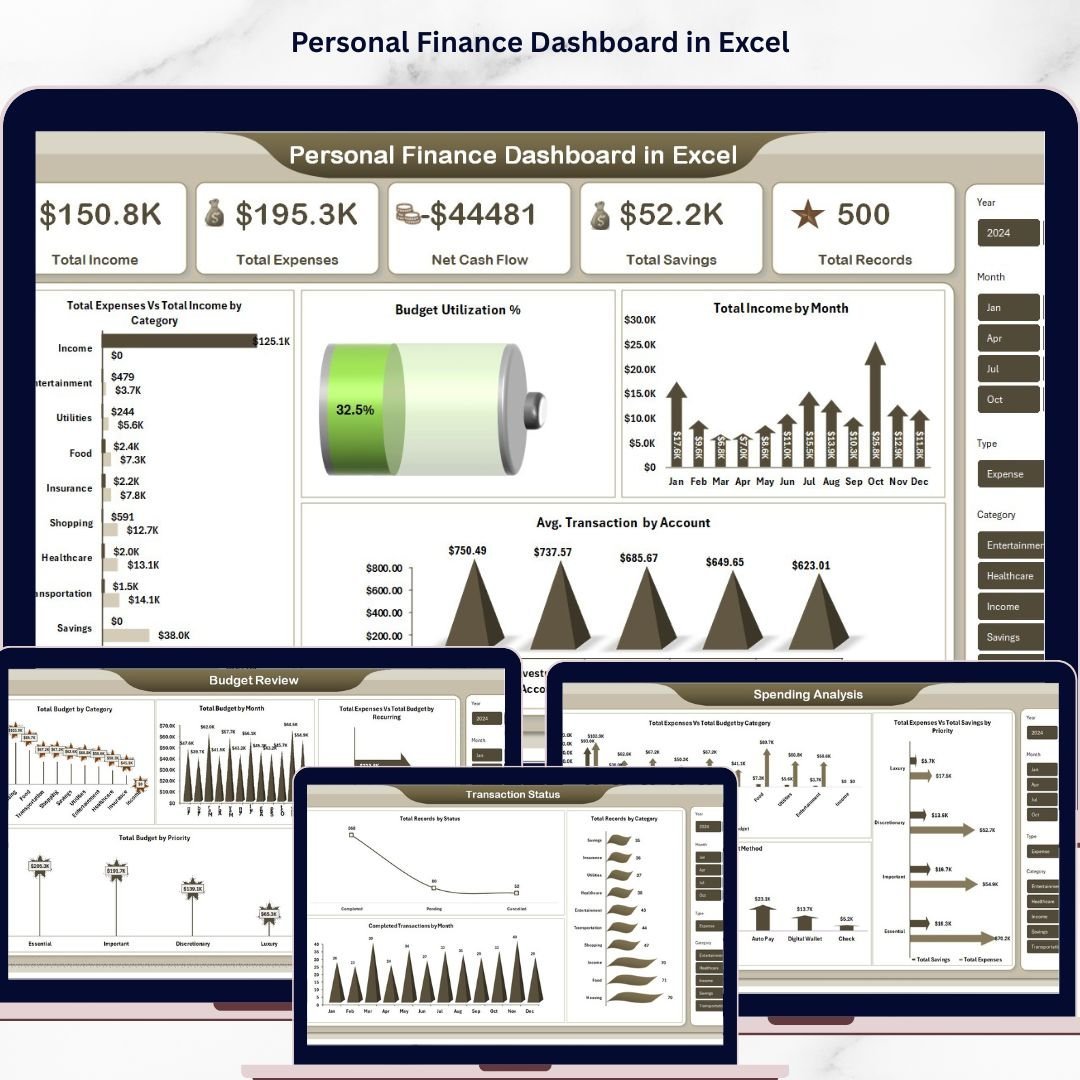


Personal Finance Dashboard in Excel is a powerful, ready-to-use financial analytics template designed to help individuals track income, expenses, savings, budgets, and transaction status from one interactive Excel dashboard. This template includes 5 dynamic dashboard pages, a structured data sheet, and a support sheet with pivot tables — all built to auto-refresh when you update your data 📊💰.
Whether you are managing household finances, tracking monthly budgets, or monitoring your overall financial health, this Excel Dashboard Template transforms raw financial data into clear, visual insights. Instead of juggling multiple spreadsheets, you can now see your complete financial picture in one centralized dashboard. If you prefer a KPI-based approach, check out the Personal Finance KPI Scorecard in Excel for detailed performance monitoring.
 Personal Finance Dashboard in Excel
🔑 Key Features of Personal Finance Dashboard in Excel
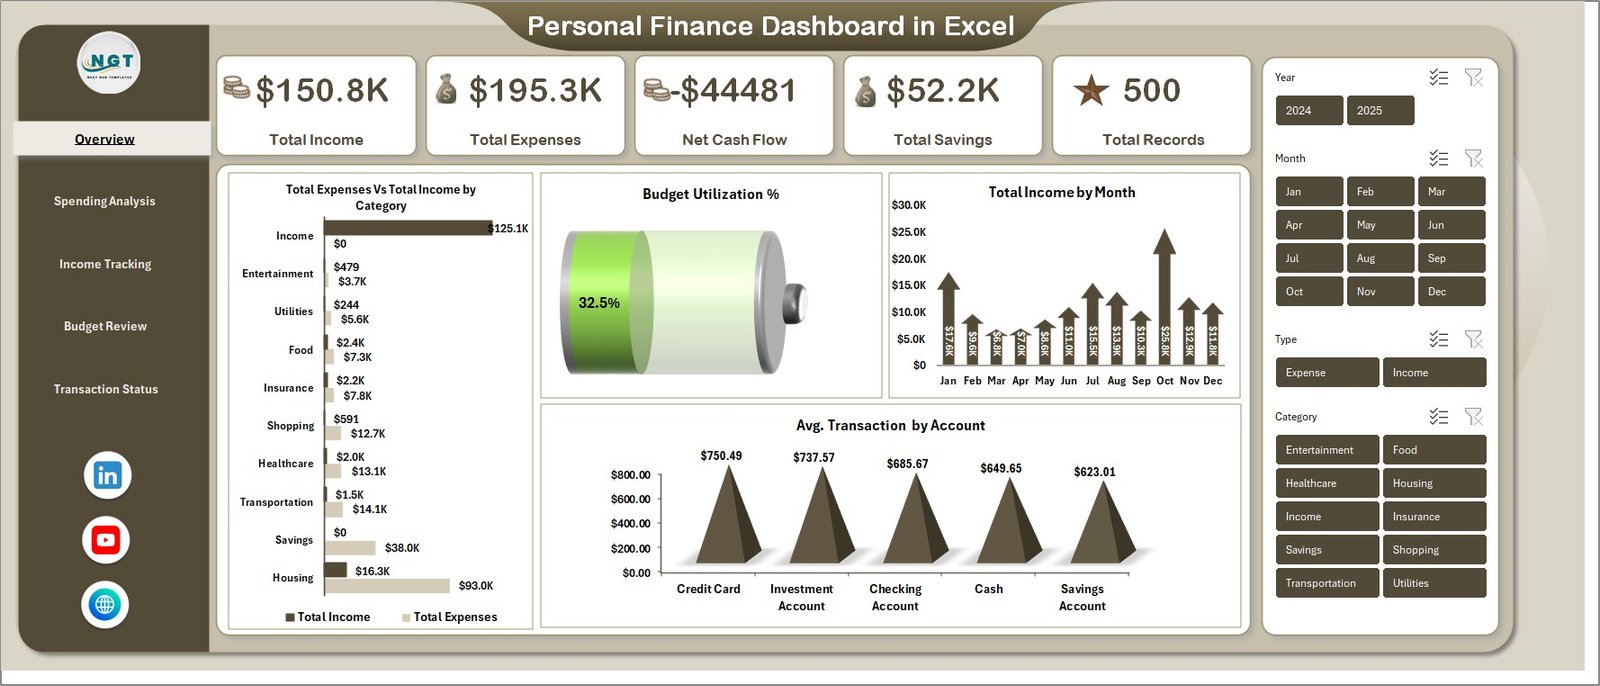
📊 5 Interactive Dashboard Pages — Overview, Spending Analysis, Income Tracking, Budget Review, and Transaction Status pages give you 360-degree visibility into your personal finances. This dashboard tracks 5 key metrics including Total Income, Total Expenses, Net Cash Flow, Total Savings, and Total Records.
📈 Dynamic KPI Cards on Overview — Instantly view Total Income, Total Expenses, Net Cash Flow, Total Savings, and Total Records at the top of the Overview page for a quick executive summary of your financial health.
🎛 Multiple Slicers for Quick Filtering — Apply dynamic filters across the dashboard to drill down into specific categories, accounts, payment methods, and time periods instantly.
💰 Comprehensive Budget Tracking — The Budget Review page features Total Budget by Category, Total Budget by Month, Total Expenses Vs Total Budget by Recurring, and Total Budget by Priority for complete budgeting visibility.
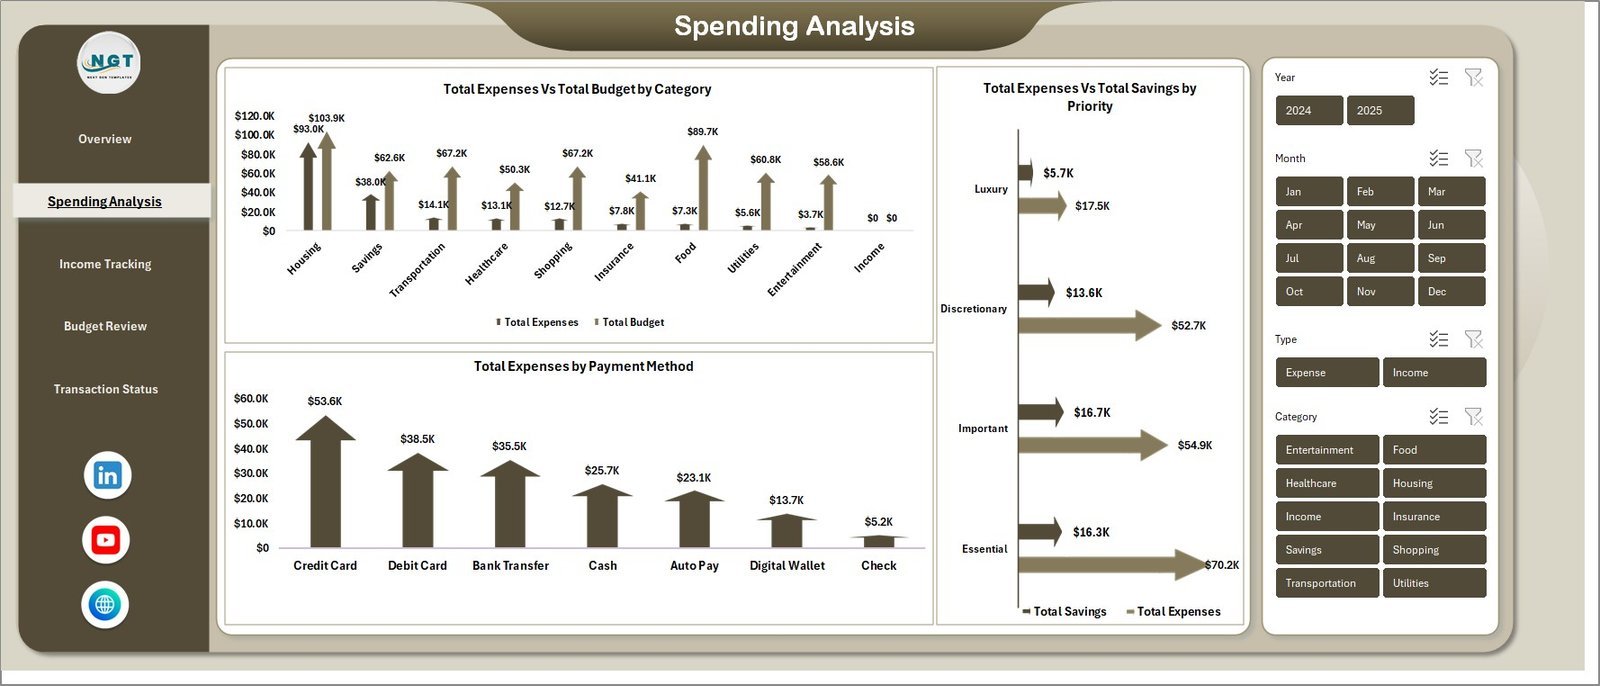
📉 Spending Pattern Analysis — The Spending Analysis page provides Total Expenses Vs Total Budget by Category, Total Expenses Vs Total Savings by Priority, and Total Expenses by Payment Method to identify where your money goes.
📅 Income Monitoring Over Time — Track Total Income Vs Total Savings by Month, Total Income Vs Total Expenses by Year, and Total Income Vs Total Expenses by Account for long-term financial planning.
✅ Transaction Status Tracking — Monitor Total Records by Status, Total Records by Category, and Completed Transactions by Month to stay on top of every financial transaction.
⚡ Pivot-Powered Auto-Refresh — All charts are connected to pivot tables. Simply refresh data and every visual updates automatically. No VBA or macros required.
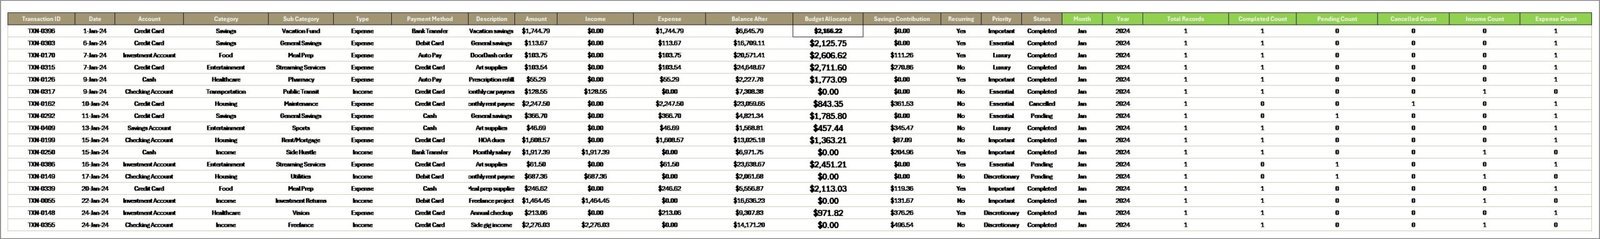
🔧 Plug-and-Play Data Sheet — Replace sample data with your own records in the structured Data Sheet and refresh all dashboards with one click.
Looking to build an emergency fund alongside your budgeting? Explore our Emergency Fund Tracker in Excel and Savings Goal Planner in Excel for complementary financial planning tools.
📦 What’s Inside the Personal Finance Dashboard in Excel
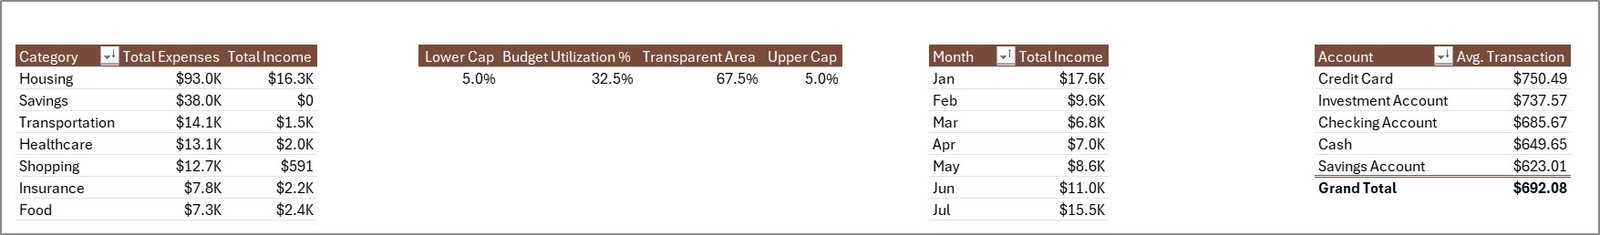
📊 Overview Page — Displays 5 KPI cards (Total Income, Total Expenses, Net Cash Flow, Total Savings, Total Records) alongside visual charts showing Total Expenses Vs Total Income by Category comparing spending against earnings, Budget Utilization % tracking how well you stick to your budget, Total Income by Month revealing monthly earning patterns, and Avg. Transaction by Account showing average transaction sizes across different accounts. Multiple slicers allow instant filtering across all dimensions.
Personal Finance Dashboard in Excel📊 Spending Analysis Page — Deep-dive into your spending patterns with Total Expenses Vs Total Budget by Category revealing overspending areas, Total Expenses Vs Total Savings by Priority helping you understand how priorities affect your savings, and Total Expenses by Payment Method tracking which payment channels you use most.
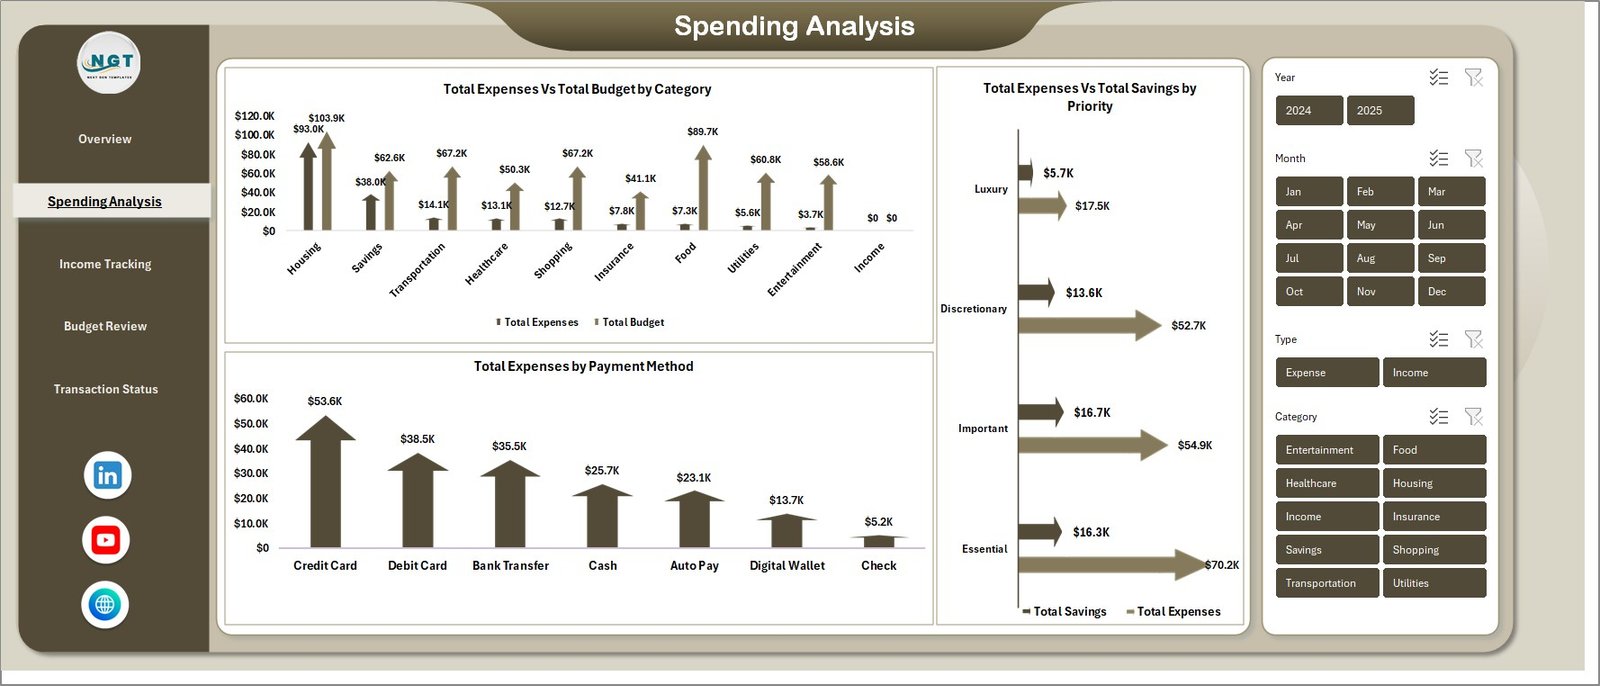 Spending Analysis
📊 Income Tracking Page — Covers Total Income Vs Total Savings by Month to see how savings grow with income, Total Income Vs Total Expenses by Year for annual comparisons, and Total Income Vs Total Expenses by Account for account-level performance tracking.
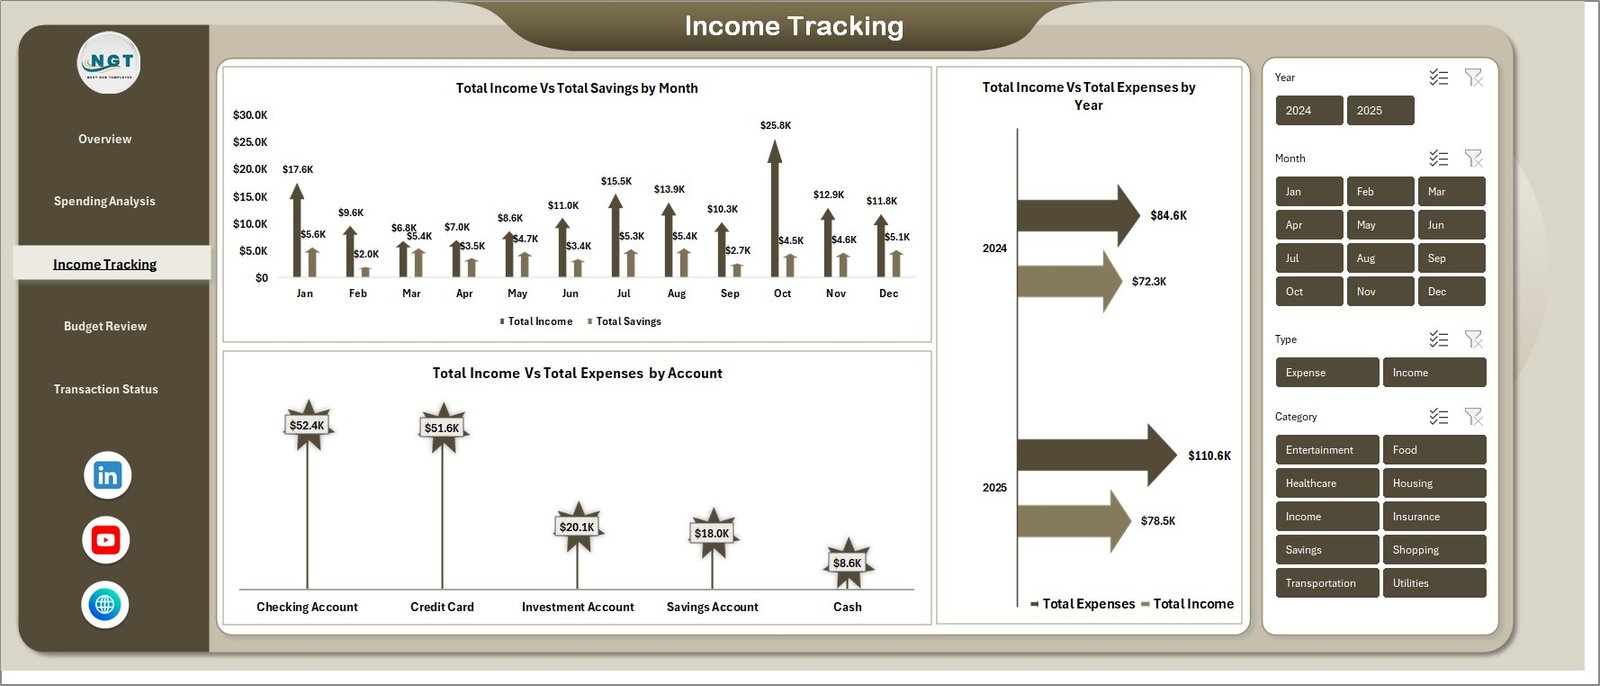 Income Tracking
📊 Budget Review Page — Covers Total Budget by Category showing allocation across spending categories, Total Budget by Month for monthly budgeting visibility, Total Expenses Vs Total Budget by Recurring separating fixed from variable expenses, and Total Budget by Priority ranking budget items by importance.
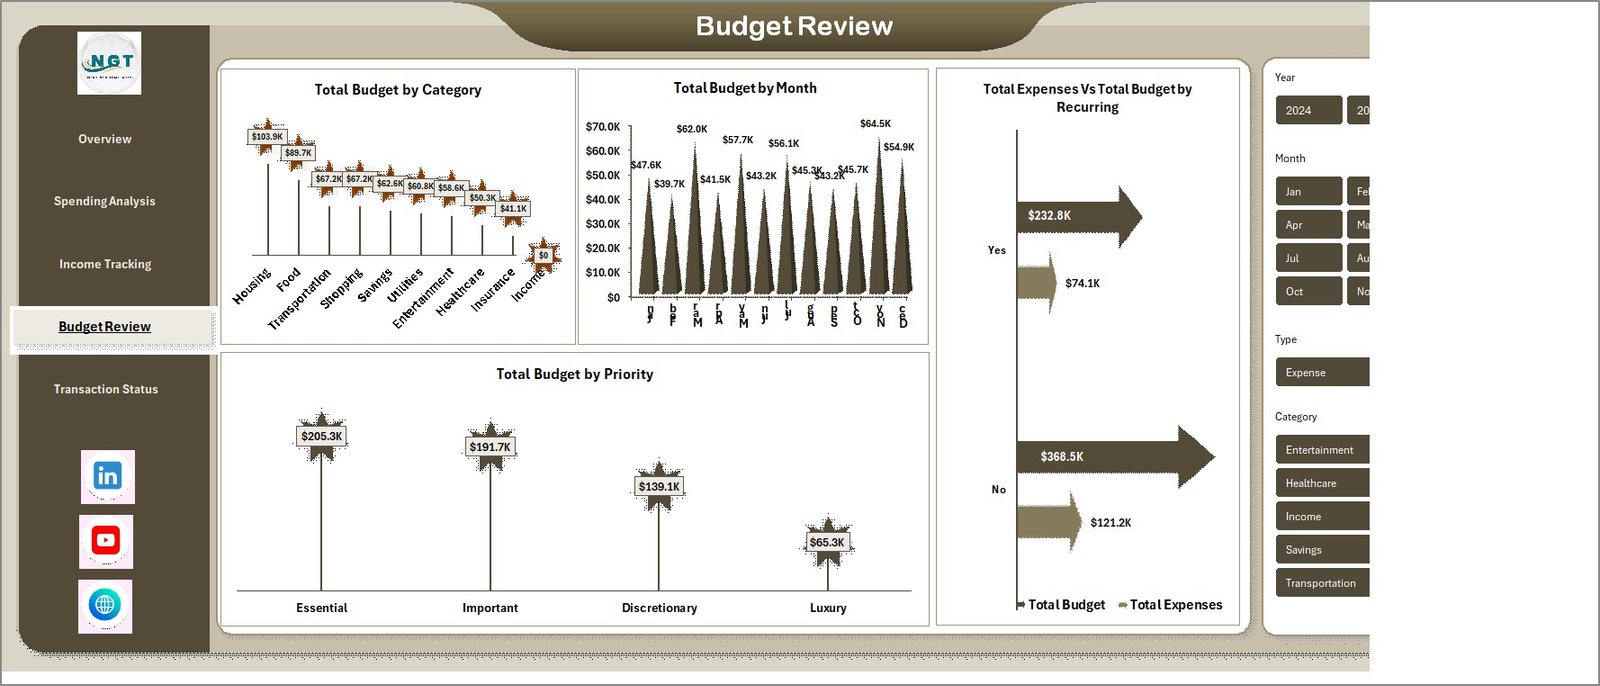 Budget Review
📊 Transaction Status Page — Analyzes Total Records by Status tracking completed, pending, and cancelled transactions, Total Records by Category for category-level counts, and Completed Transactions by Month monitoring transaction completion trends over time.
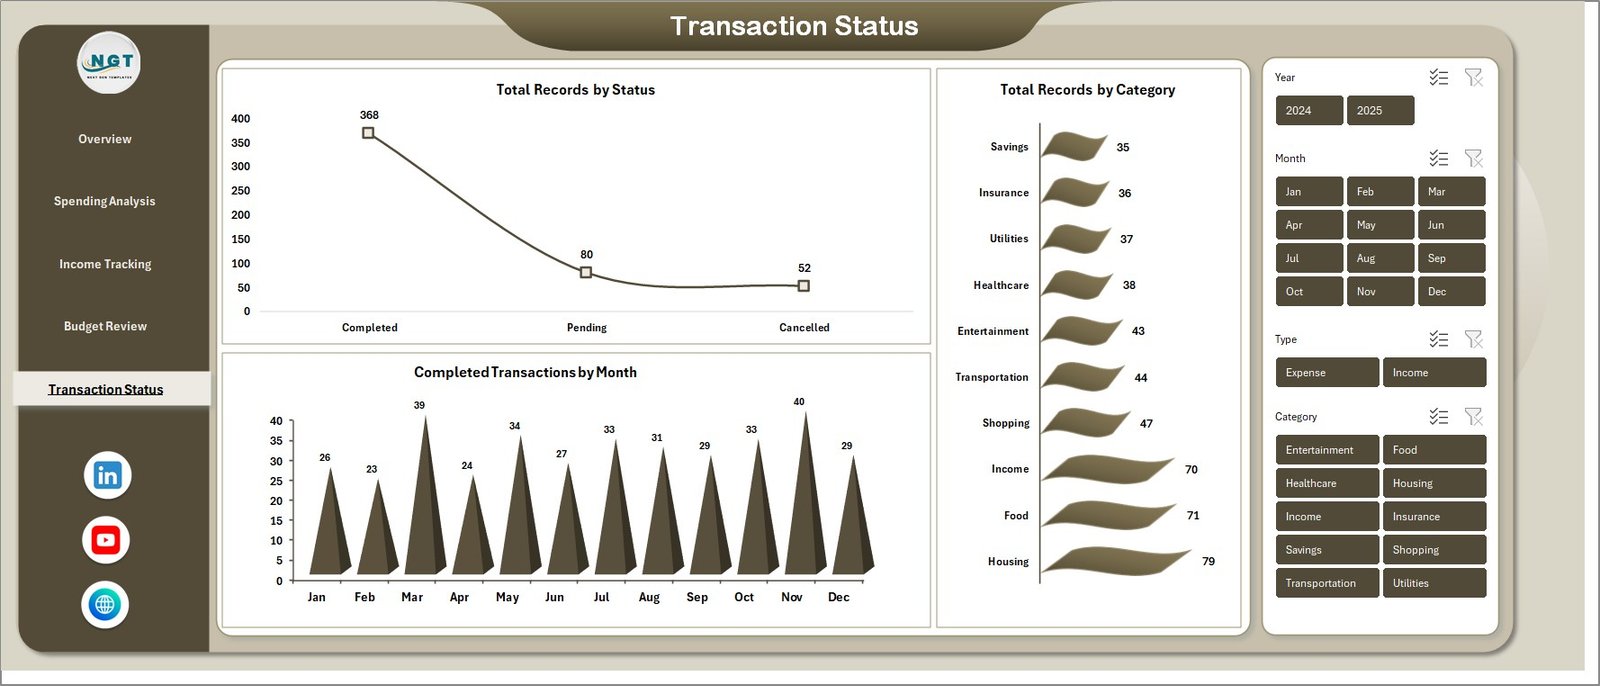 Transaction Status
📊 Data Sheet — This is your data entry point. Add your personal finance transaction records in the same format, and the entire dashboard auto-updates upon refresh.
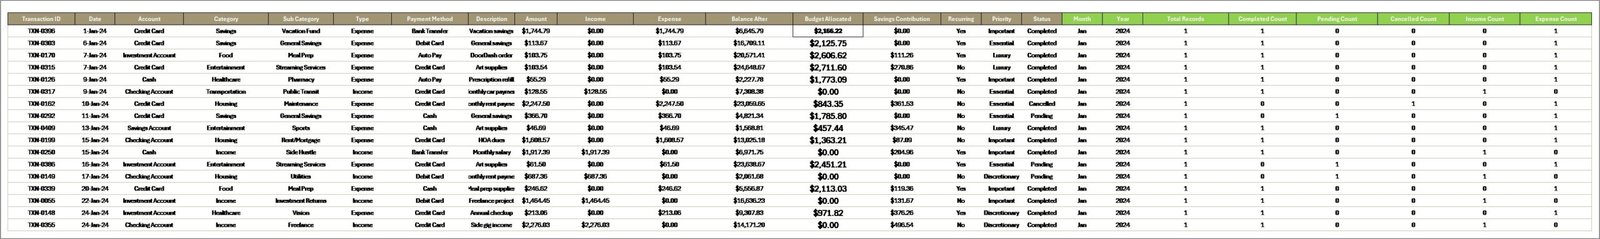 Data Sheet tab
📊 Support Sheet — Contains all pivot tables that power the dashboard charts. After updating data, go to the Data tab in the Excel Ribbon and click Refresh All. All pivots and charts update instantly. You can keep this sheet hidden during regular use.
 Support sheet tab
⚙️ How to Use the Personal Finance Dashboard in Excel
1️⃣ Download and Open — Download the ZIP file, extract it, and open the Excel file in Microsoft Excel (2016 or later recommended).
2️⃣ Go to the Data Sheet — Navigate to the Data Sheet tab and replace the sample data with your own personal finance records in the same column format.
3️⃣ Refresh the Dashboard — Click on the Data tab in the Excel Ribbon and select Refresh All. All pivot tables and charts will update automatically.
4️⃣ Use Slicers for Filtering — On the Overview page, use the built-in slicers to filter data by specific categories, accounts, or time periods.
5️⃣ Explore All 5 Pages — Navigate through Overview, Spending Analysis, Income Tracking, Budget Review, and Transaction Status tabs for complete financial analytics.
👥 Who Can Benefit from This Personal Finance Dashboard in Excel
💼 Working Professionals — Track salary, expenses, and savings with clear visual insights to build better financial habits.
👨👩👧 Families — Monitor household budgets, spending patterns, and savings goals in one organized dashboard.
🎓 Students and Young Professionals — Develop strong money management skills with structured expense tracking from an early stage.
💰 Freelancers and Self-Employed Individuals — Track income from multiple sources alongside expenses and savings for financial stability.
📊 Financial Coaches — Use this template as a client-ready tool to help individuals organize and improve their personal finances.
Anyone looking to take control of their money and build long-term financial security will benefit from this structured Excel Dashboard. Also explore our Net Worth Tracker in Excel and Debt Payoff Calculator Template in Excel for additional financial planning tools.
❓ Frequently Asked Questions
What metrics does the Personal Finance Dashboard in Excel track?
The Personal Finance Dashboard in Excel tracks 5 key metrics on the Overview page: Total Income, Total Expenses, Net Cash Flow, Total Savings, and Total Records. Additional analysis across 5 interactive pages includes budget utilization, spending by category and payment method, income trends by month and year, and transaction completion status.
Do I need advanced Excel skills to use this dashboard?
No. This dashboard requires no advanced Excel skills. Simply replace the sample data in the Data Sheet with your own financial records and click Refresh All in the Data tab. All charts and KPI cards update automatically through pivot tables.
Can I track multiple bank accounts in this dashboard?
Yes. The data structure supports multiple accounts, and the dashboard includes account-level analysis in the Income Tracking page showing Total Income Vs Total Expenses by Account and Avg. Transaction by Account on the Overview page.
Does this template work without VBA or macros?
Yes. The Personal Finance Dashboard in Excel is 100% formula and pivot-table based. No VBA or macros are required. It works in Microsoft Excel 2016 and later versions without needing to enable macros.
Can I customize the budget categories?
Absolutely. Since the dashboard is built on pivot tables, you can add new categories, modify existing ones, or adjust budget allocations in the Data Sheet. All charts will reflect your changes after refreshing.
How is this different from the Personal Finance KPI Scorecard?
The Personal Finance Dashboard focuses on visual analysis with 5 interactive chart pages covering spending, income, budgets, and transaction status. The KPI Scorecard focuses on KPI-based performance monitoring with Actual vs Target comparisons and trend analysis. Both complement each other — check our Personal Finance KPI Scorecard in Excel for KPI tracking.
🔗 Explore Related Templates
🔹 Personal Finance KPI Scorecard in Excel — KPI-based financial performance monitoring with Actual vs Target comparisons.
🔹 Savings Goal Planner in Excel — Plan and track savings goals with visual progress indicators.
🔹 Net Worth Tracker in Excel — Monitor assets, liabilities, and financial growth over 12 months.
📖 Click here to read the Detailed Blog Post
Watch the step-by-step video tutorial:


Reviews
There are no reviews yet.