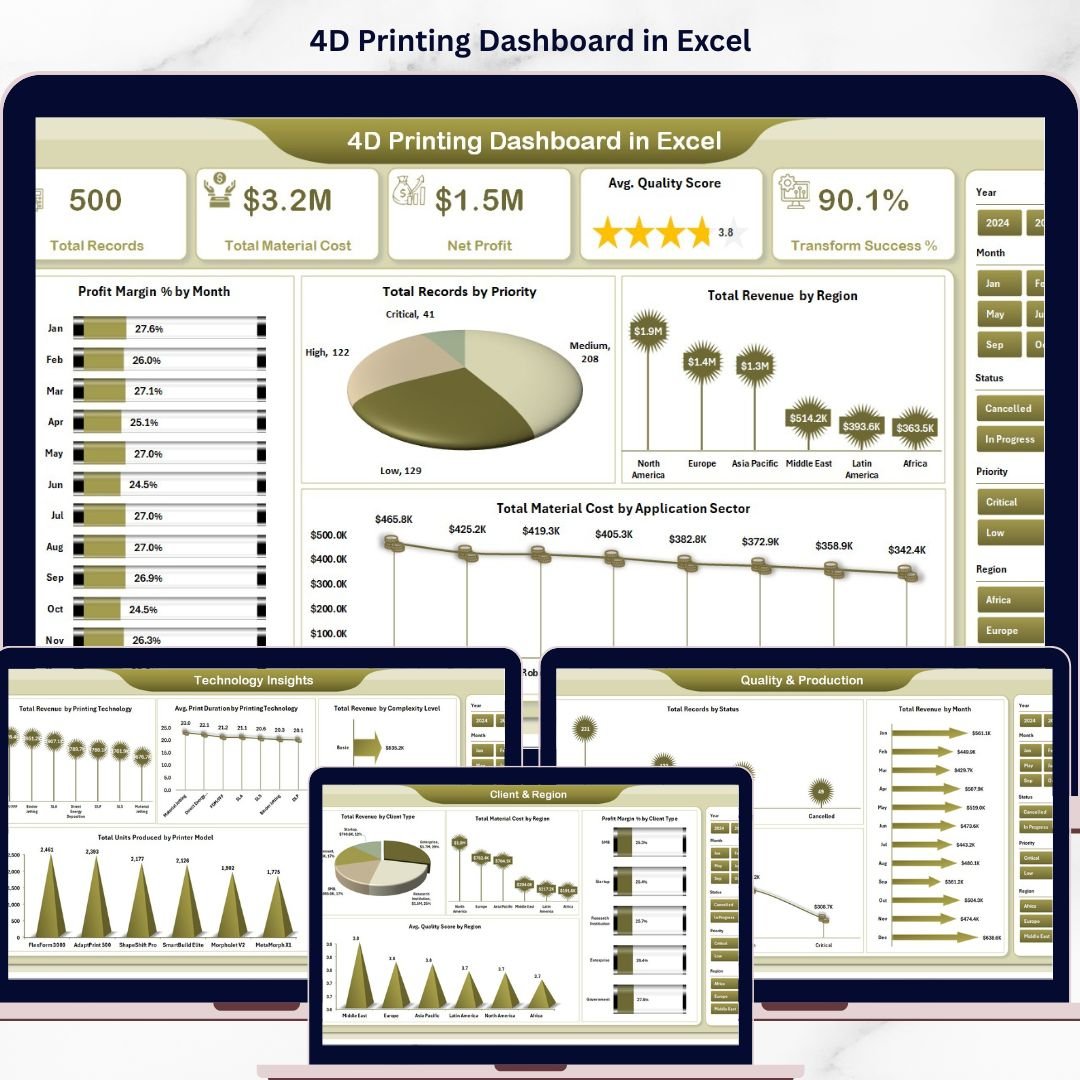

4D Printing Dashboard in Excel is a comprehensive, ready-to-use analytics template built for professionals managing 4D printing operations, material performance, and production quality. Whether you oversee advanced manufacturing lines, research labs, or commercial printing services, this dashboard transforms your raw production data into actionable visual insights — no coding or advanced Excel skills required.
This powerful Excel dashboard template features 5 interactive analysis pages, a structured data sheet, and a hidden support sheet with pivot tables that auto-refresh your entire dashboard whenever you update the data. It tracks key metrics such as Total Records, Total Material Cost, Net Profit, Average Quality Score, and Transform Success Percentage across every dimension of your 4D printing workflow.
🔑 Key Features of 4D Printing Dashboard in Excel
📊 5 Interactive Dashboard Pages – Overview, Material Analysis, Technology Insights, Client & Region, and Quality & Production pages give you a 360-degree view of your 4D printing operations.
📈 15+ Dynamic Charts – Analyze Profit Margin by Month, Revenue by Region, Material Cost by Application Sector, Revenue by Printing Technology, Quality Score by Material Type, and many more visual breakdowns.
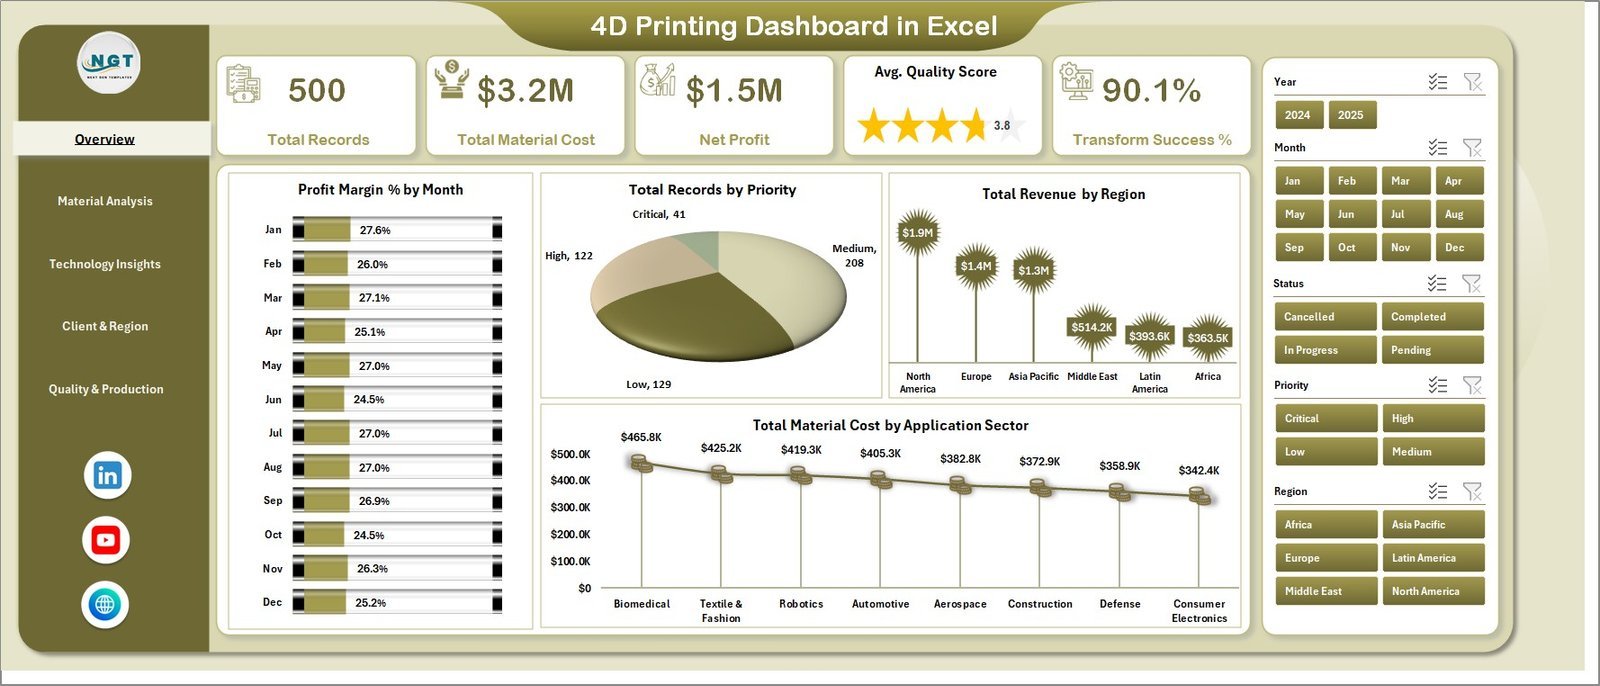
🎯 5 High-Level KPI Cards – Instantly view Total Records, Total Material Cost, Net Profit, Average Quality Score, and Transform Success % on the Overview page.
🔍 Multiple Slicers for Quick Filtering – Apply interactive slicer filters across the dashboard to drill down into specific data segments instantly.
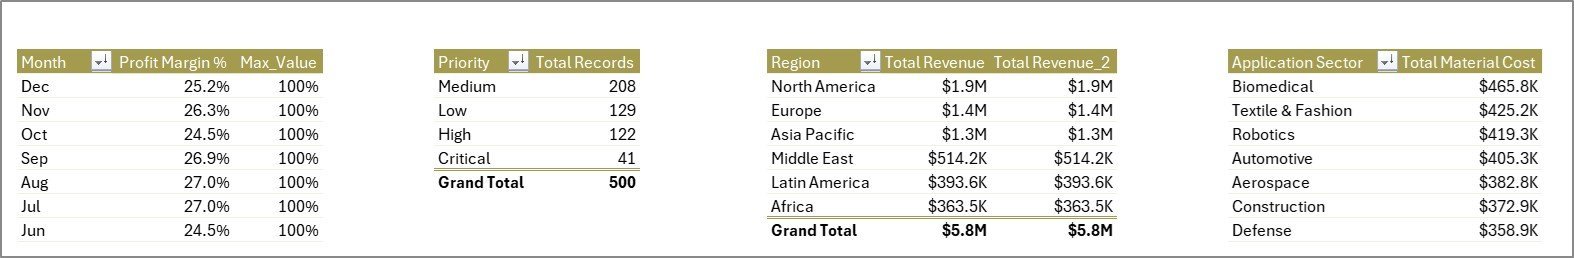
⚙️ Fully Automated Pivot Tables – The hidden Support sheet contains all pivot tables powering the dashboard. Just refresh and everything updates automatically.
🧪 4D Printing-Specific Metrics – Tracks unique 4D printing KPIs like Shape Memory Trigger success, Complexity Level analysis, Printer Model performance, and Printing Technology comparison.
🌍 Multi-Dimensional Analysis – Break down performance by Region, Client Type, Priority, Status, Application Sector, and Month for granular insights.
📦 What’s Inside the 4D Printing Dashboard in Excel
📋 Overview Page – Displays 5 KPI cards (Total Records, Total Material Cost, Net Profit, Avg. Quality Score, Transform Success %) along with charts showing Profit Margin % by Month, Total Records by Priority, Total Revenue by Region, and Total Material Cost by Application Sector. Multiple slicers allow instant data filtering.
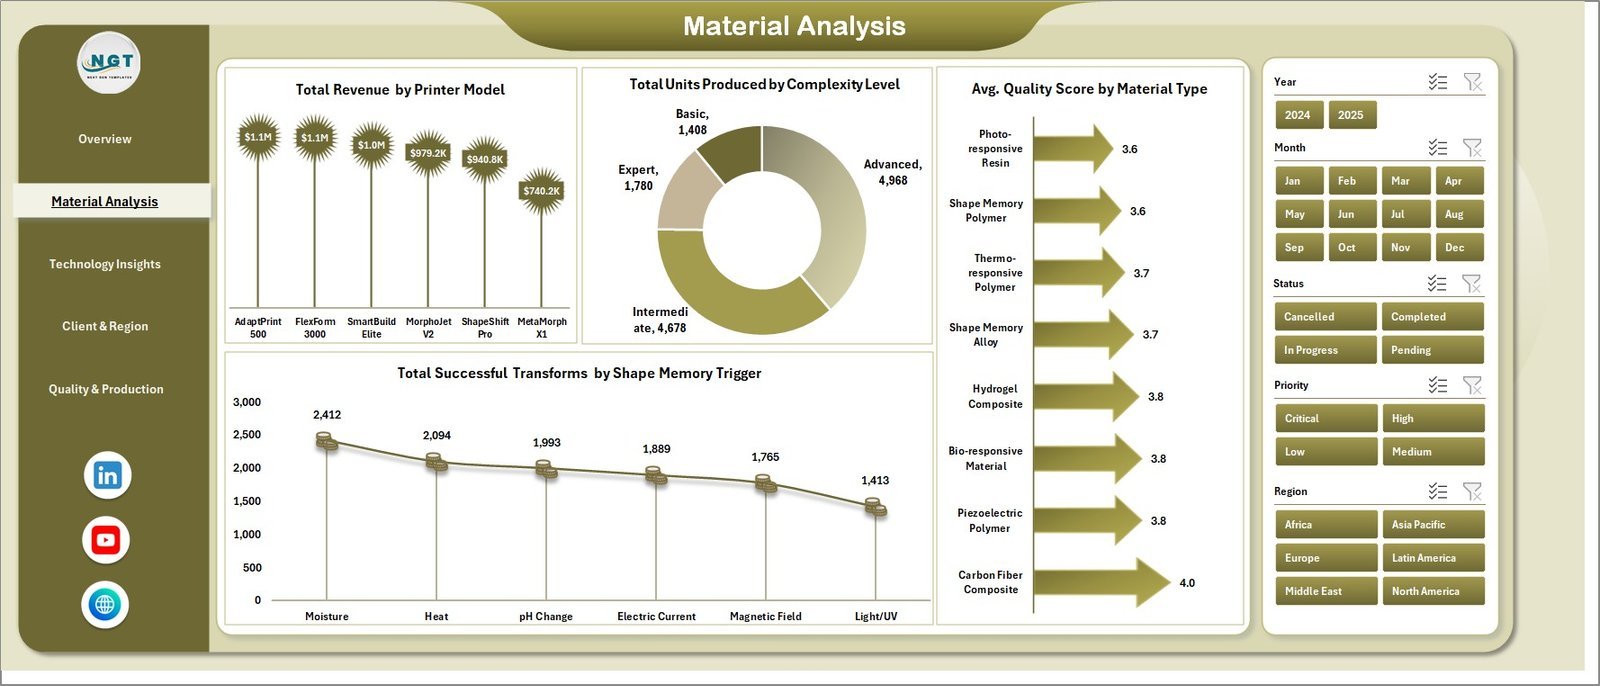
🧬 Material Analysis Page – Visualizes Total Revenue by Printer Model, Total Units Produced by Complexity Level, Average Quality Score by Material Type, and Total Successful Transforms by Shape Memory Trigger.
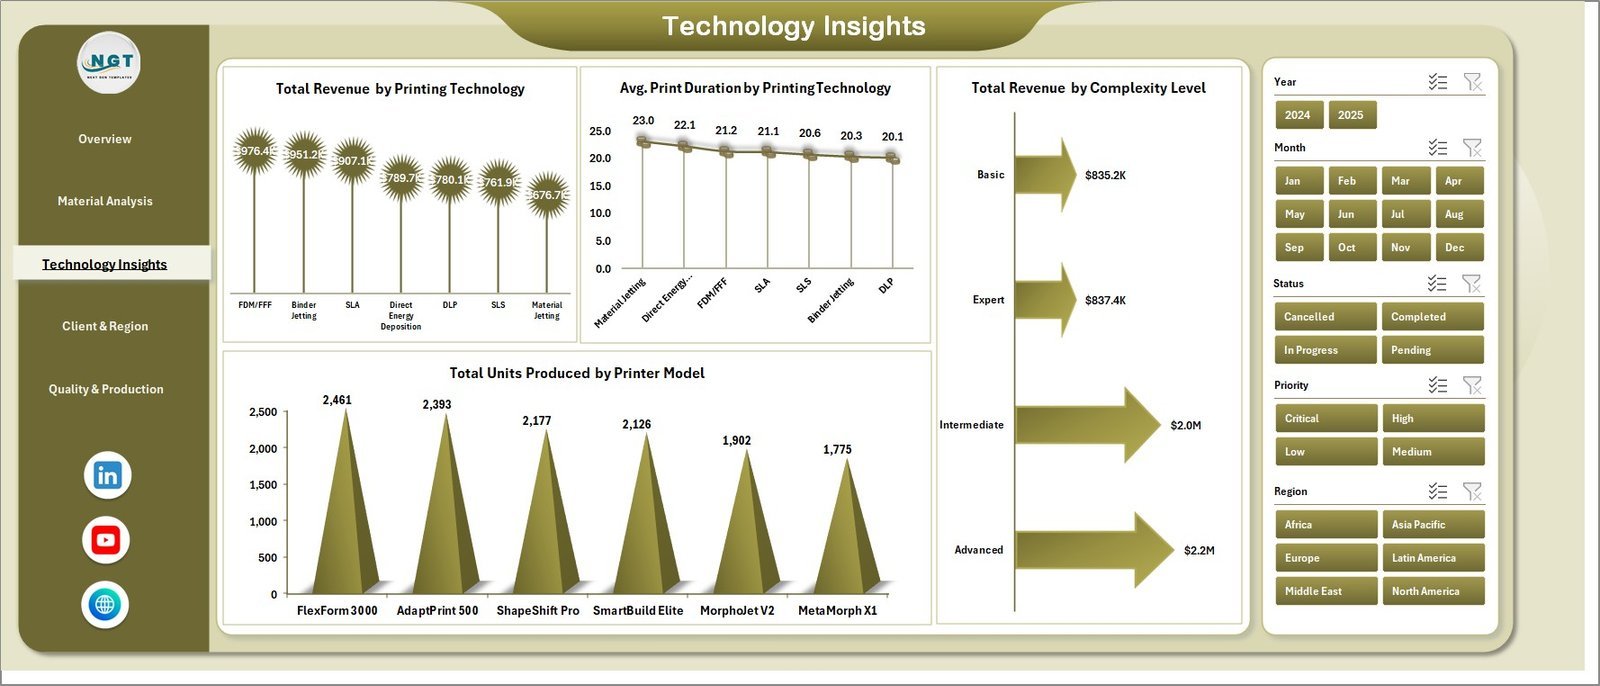
💡 Technology Insights Page – Presents Total Revenue by Printing Technology, Average Print Duration by Printing Technology, Total Revenue by Complexity Level, and Total Units Produced by Printer Model.
🌐 Client & Region Page – Shows Total Revenue by Client Type, Total Material Cost by Region, Profit Margin % by Client Type, and Average Quality Score by Region.
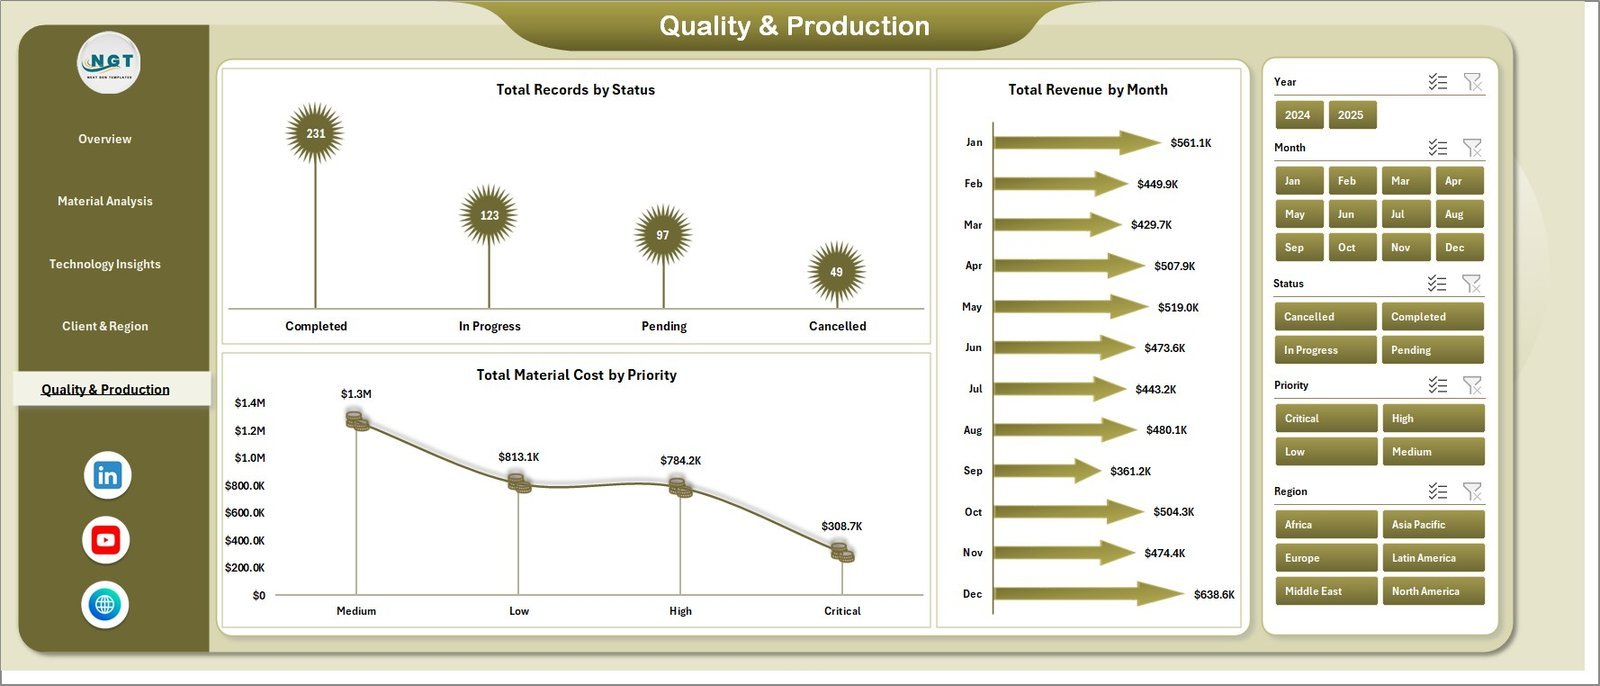
✅ Quality & Production Page – Tracks Total Records by Status, Total Revenue by Month, and Total Material Cost by Priority for production monitoring.
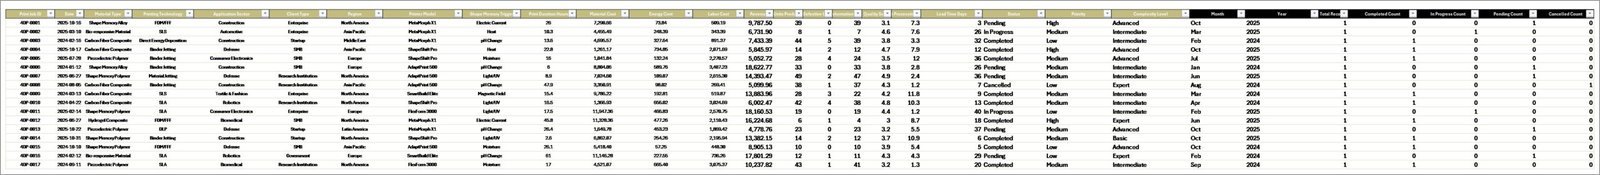
📂 Data Sheet – Add your production data in the structured format provided. This sheet feeds all pivot tables and charts automatically.
🔧 Support Sheet – Contains multiple pivot tables that power the entire dashboard. Go to Data tab → Refresh All after updating data to refresh everything. You can keep this sheet hidden.
⚙️ How to Use the 4D Printing Dashboard in Excel
1️⃣ Download and open the Excel file on your computer.
2️⃣ Navigate to the Data Sheet tab and replace the sample data with your own 4D printing production records.
3️⃣ Go to the Data tab in the Excel Ribbon and click Refresh All to update all pivot tables and charts.
4️⃣ Explore the 5 dashboard pages — use slicers on the Overview page to filter data by any dimension.
5️⃣ Keep the Support sheet hidden for a clean, professional look while presenting.
👥 Who Can Benefit from This 4D Printing Dashboard in Excel
🏭 Manufacturing Engineers – Monitor production quality and output across printer models and material types.
📊 Operations Managers – Track costs, revenue, and profit margins across regions and client types.
🔬 R&D Teams – Analyze printing technology performance and shape memory trigger success rates.
📋 Quality Assurance Professionals – Evaluate quality scores by material type and region for compliance.
💼 Business Analysts – Generate reports on 4D printing production trends and cost optimization.
Explore more templates in our Excel Dashboard Templates collection and discover powerful tools for every industry.
❓ Frequently Asked Questions
What KPIs does the 4D Printing Dashboard in Excel track?
The 4D Printing Dashboard in Excel tracks 5 key performance indicators on the Overview page: Total Records, Total Material Cost, Net Profit, Average Quality Score, and Transform Success Percentage. Additionally, it analyzes metrics across 15+ charts covering revenue, cost, quality, and production dimensions.
Do I need advanced Excel skills to use this dashboard?
No. Simply replace the sample data in the Data Sheet with your own records and click Refresh All in the Data tab. All charts, pivot tables, and KPI cards update automatically without any formulas or macros to configure.
Can I filter the dashboard by specific regions or client types?
Yes. The Overview page includes multiple interactive slicers that let you filter the entire dashboard by Region, Client Type, Priority, Status, and other dimensions instantly.
What is the difference between the 3D Printing and 4D Printing Dashboard?
The 3D Printing Manufacturing Dashboard focuses on standard additive manufacturing metrics, while the 4D Printing Dashboard in Excel includes specialized KPIs like Shape Memory Trigger analysis, Transform Success %, and Complexity Level tracking specific to 4D printing operations.
How many dashboard pages does this Excel template include?
This template includes 5 interactive dashboard pages: Overview, Material Analysis, Technology Insights, Client & Region, and Quality & Production, plus a Data Sheet and a hidden Support Sheet with pivot tables.
🔗 Explore Related Templates
📊 3D Printing Manufacturing Dashboard in Excel – A powerful analytics dashboard for tracking standard 3D printing production, quality, and cost metrics.
📊 Ceramic Manufacturing Dashboard in Excel – Monitor ceramic production performance, material costs, and quality scores across your manufacturing line.
📊 Battery Manufacturing Dashboard in Excel – Track battery production output, defect rates, and operational efficiency with this ready-to-use Excel template.
📊 Manufacturing Excellence Bundle – 8 Premium Templates – Get the complete manufacturing analytics toolkit with 8 premium Excel and Power BI templates at 44% savings.
📖 Click here to read the Detailed Blog Post
🎥 Visit our YouTube channel to learn step-by-step video tutorials
👉 YouTube.com/@NextGenTemplates
Watch the step-by-step video tutorial:
YouTube


Reviews
There are no reviews yet.