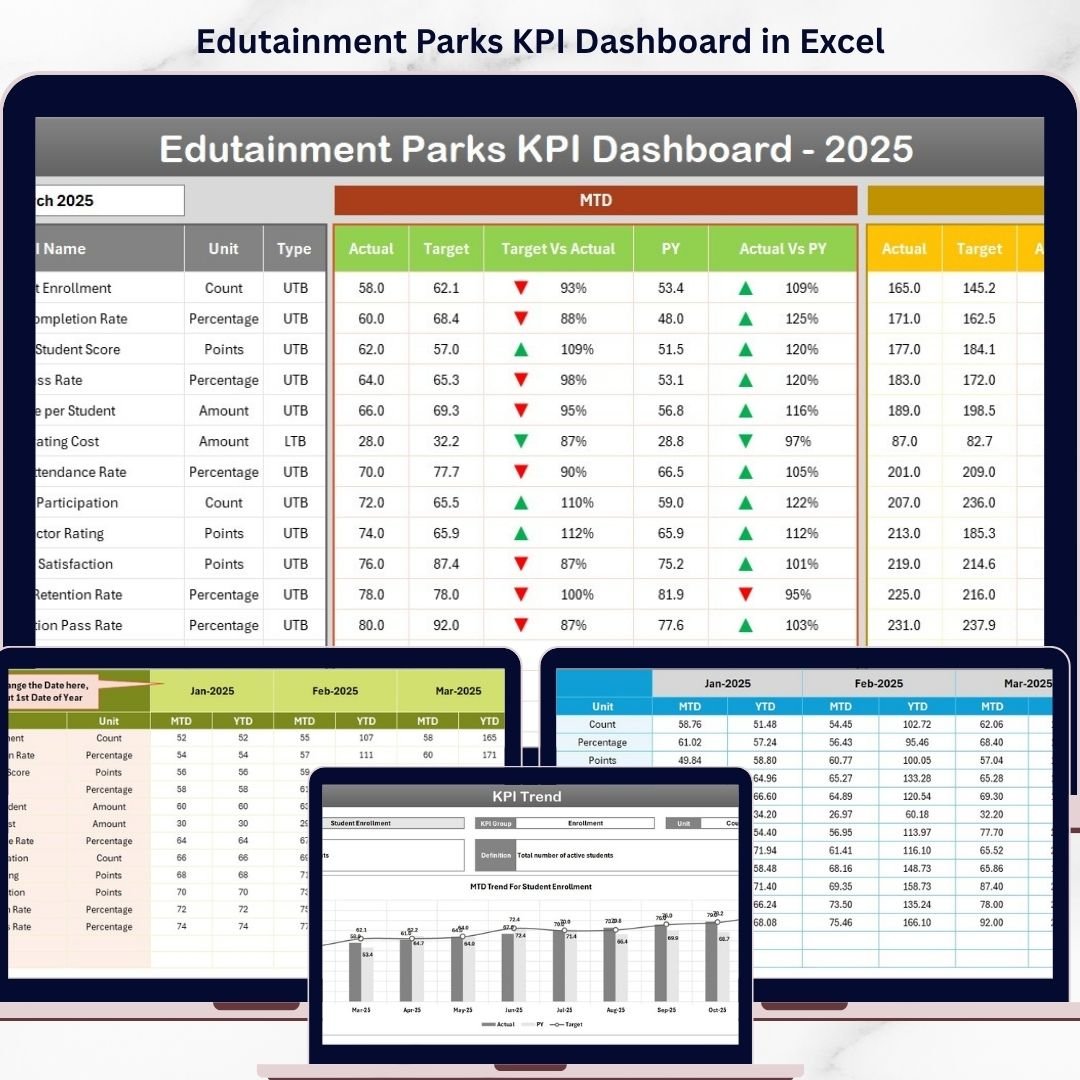

Key Features of Edutainment Parks KPI Dashboard
Unlock the true potential of your edutainment park operations with the Edutainment Parks KPI Dashboard-a comprehensive, intuitive, and dynamic digital tool designed to track, analyze, and optimize key performance indicators (KPIs) effortlessly. This dashboard comes packed with 7 meticulously crafted worksheets to give you total control over your park’s performance metrics.
- 🖥️ Home Sheet: Act as your command center with 6 easy-to-navigate buttons linking you to each essential worksheet, streamlining your workflow and saving you time.
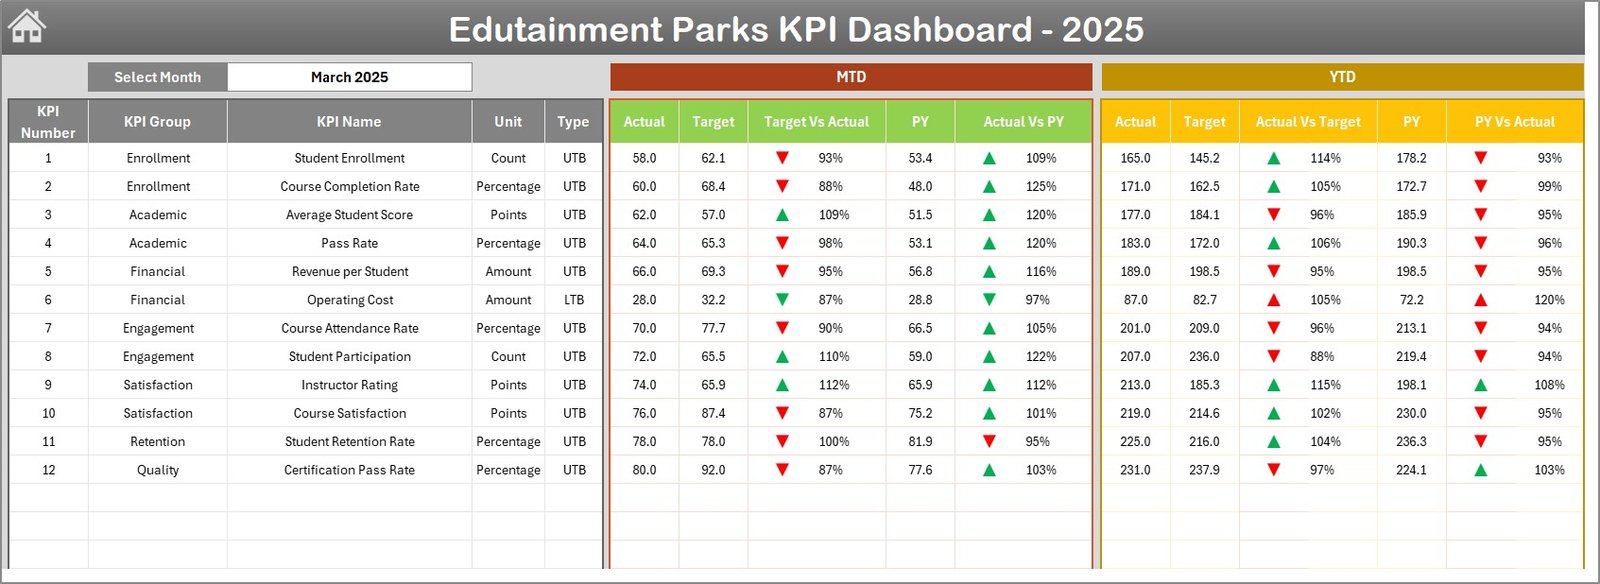
- 📊 Dashboard Sheet: The powerhouse of your KPI insights. Select any month from a drop-down menu to instantly update all key metrics. View MTD (Month-to-Date) and YTD (Year-to-Date) Actuals, Targets, Previous Year data, plus dynamic comparisons with conditional formatting arrows for quick visual analysis.
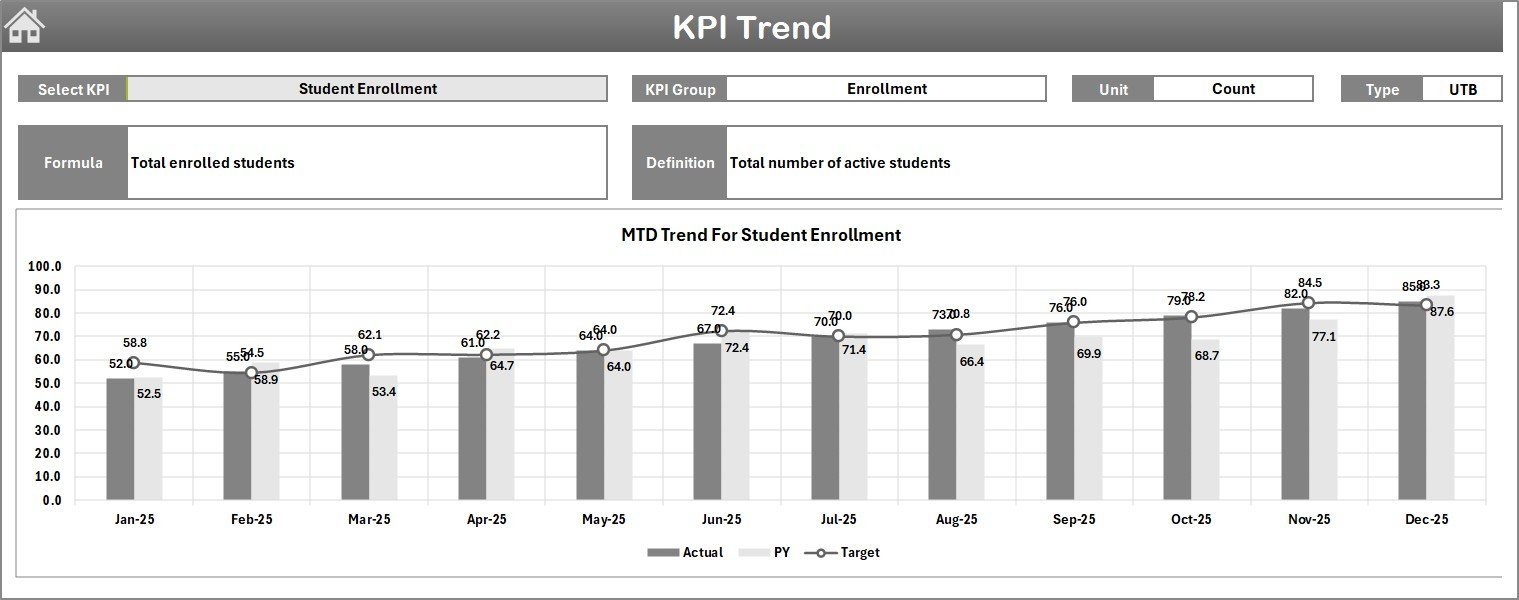
- 📈 KPI Trend Sheet: Dive into performance trends with selectable KPIs. Understand KPI groups, units, types (whether lower or upper is better), formulas, and definitions while viewing MTD and YTD trend charts for Actual, Target, and Previous Year numbers.
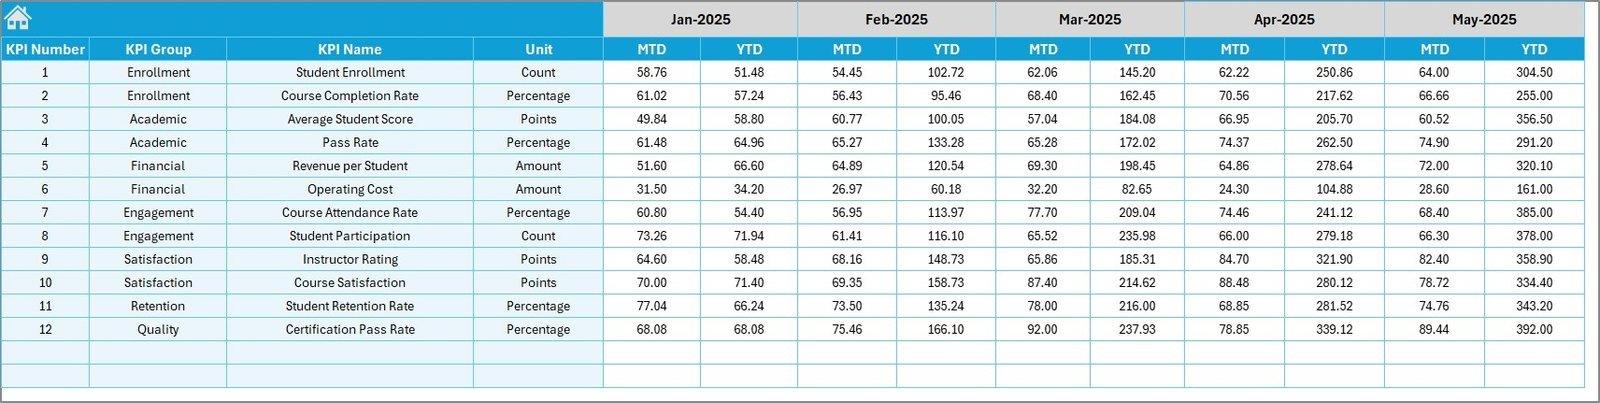
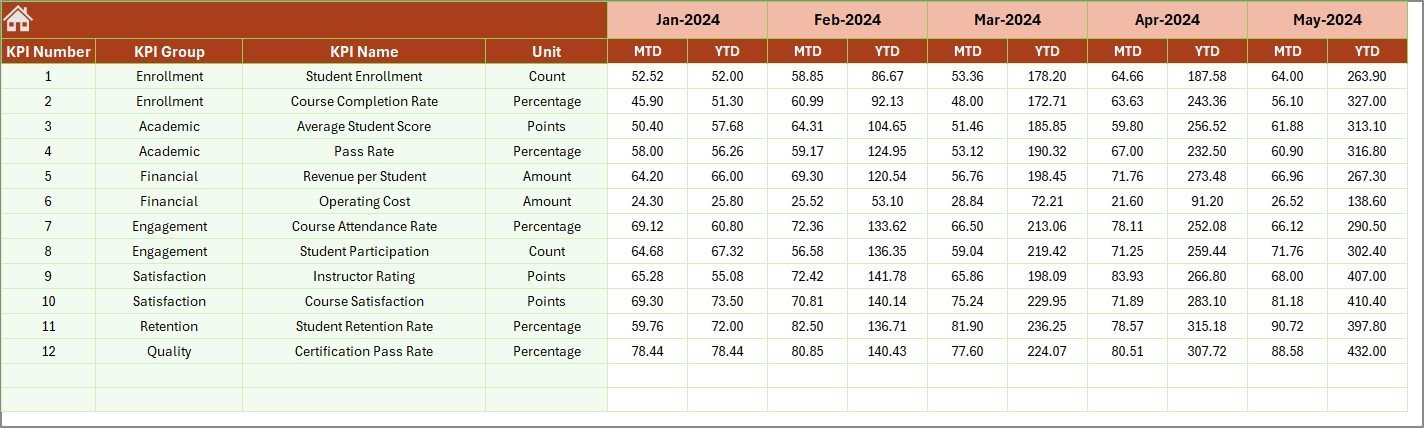
- 📝 Actual Numbers Input Sheet: Keep your data fresh by entering current month MTD and YTD actual figures. Easily shift months from the input cell to maintain accuracy.
- 🎯 Target Number Input Sheet: Set clear, measurable goals by inputting monthly target values for each KPI, both MTD and YTD.
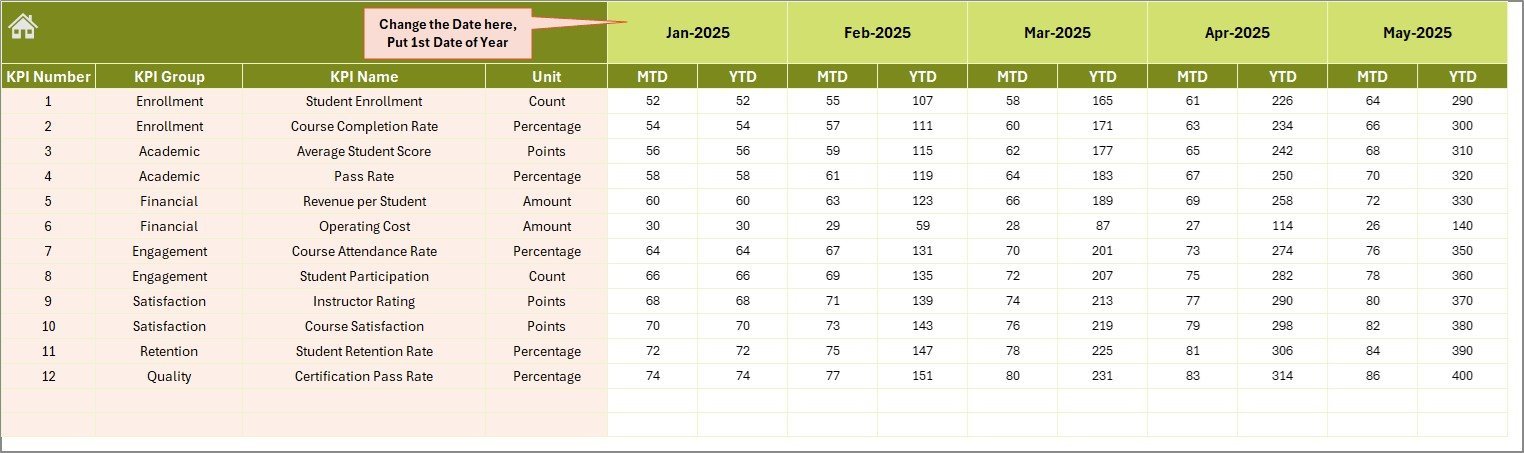
- 📅 Previous Year Numbers Sheet: Reference prior year performance by entering last year’s data, allowing for precise year-over-year comparisons.
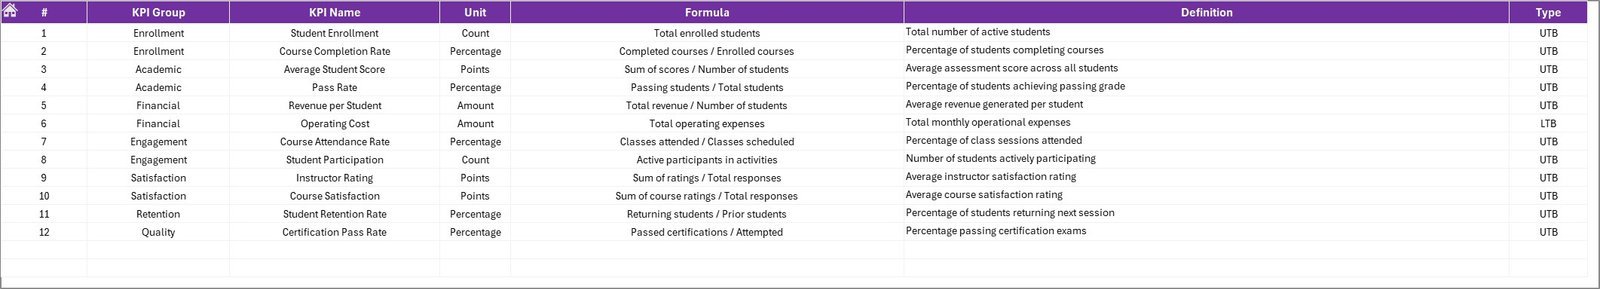
- 📚 KPI Definition Sheet: Define every KPI in detail with names, groups, units, formulas, definitions, and type (Lower the Better or Upper the Better), ensuring clarity and consistency across your team.
What’s Inside the Edutainment Parks KPI Dashboard
This all-in-one dashboard is crafted to provide a seamless experience with 7 powerful worksheets, each serving a distinct purpose:
- 🏠 Home Sheet: Central navigation hub with direct access buttons.
- 📊 Dashboard Sheet: Comprehensive KPI snapshot with dynamic monthly filtering.
- 📉 KPI Trend Sheet: In-depth trend analysis and KPI details.
- 📝 Actual Numbers Input Sheet: Easy data entry for current performance.
- 🎯 Target Number Input Sheet: Goal setting with monthly targets.
- 📆 Previous Year Number Sheet: Historical data for benchmarking.
- 📖 KPI Definition Sheet: Clear KPI descriptions and types for accurate interpretation.
How to Use the Edutainment Parks KPI Dashboard
Getting started is simple and efficient. Begin by entering your actual, target, and previous year data in their respective sheets. Use the Home Sheet to navigate quickly between sections. The Dashboard Sheet lets you select the month to analyze data dynamically, while the KPI Trend Sheet provides visual insights into performance over time. Update KPI definitions anytime to keep your metrics relevant and aligned with your park’s goals.
This dashboard is designed for ease of use, even if you’re not a data expert-empowering you to make smart decisions backed by real-time data.
Who Can Benefit from This Edutainment Parks KPI Dashboard
Whether you’re a park manager, business analyst, or strategic planner, this dashboard is tailored for you:
- 🎢 Park Managers: Monitor daily and monthly performance to optimize operations.
- 📊 Business Analysts: Analyze trends and identify growth opportunities.
- 🧑💼 Executives: Gain quick insights with at-a-glance KPIs to make informed strategic decisions.
- 📈 Marketing Teams: Track campaign effectiveness and customer engagement KPIs.
- 💼 Consultants: Provide clients with robust, customizable KPI tracking tools.
- 🎯 Finance Teams: Align financial targets with operational performance.
Designed for easy customization, it fits perfectly into any edutainment park’s existing workflow, helping you boost productivity, improve visitor experience, and maximize profitability.
Click here to read the Detailed blog post.
Visit our YouTube channel to learn step-by-step video tutorials.


Reviews
There are no reviews yet.