




Key Features of Occupational Therapy KPI Dashboard
Introducing the Occupational Therapy KPI Dashboard – your all-in-one digital solution designed to streamline, visualize, and optimize your occupational therapy performance metrics effortlessly. This powerful dashboard is crafted with precision to help therapists, managers, and healthcare administrators monitor key performance indicators (KPIs) with ease and clarity.
Our dashboard consists of 7 fully integrated worksheets that cover every aspect of KPI tracking, input, and analysis:
🏠 Home Sheet: Acts as the central navigation hub with 6 quick-access buttons, allowing you to jump instantly to any section of the dashboard. It offers a clean, user-friendly interface to keep your workflow smooth and efficient.
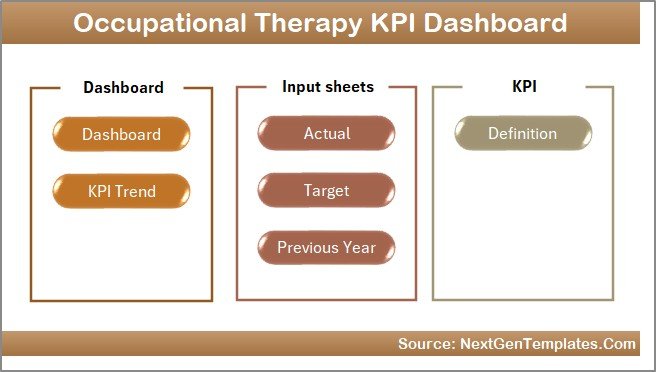
Caption: Home Page
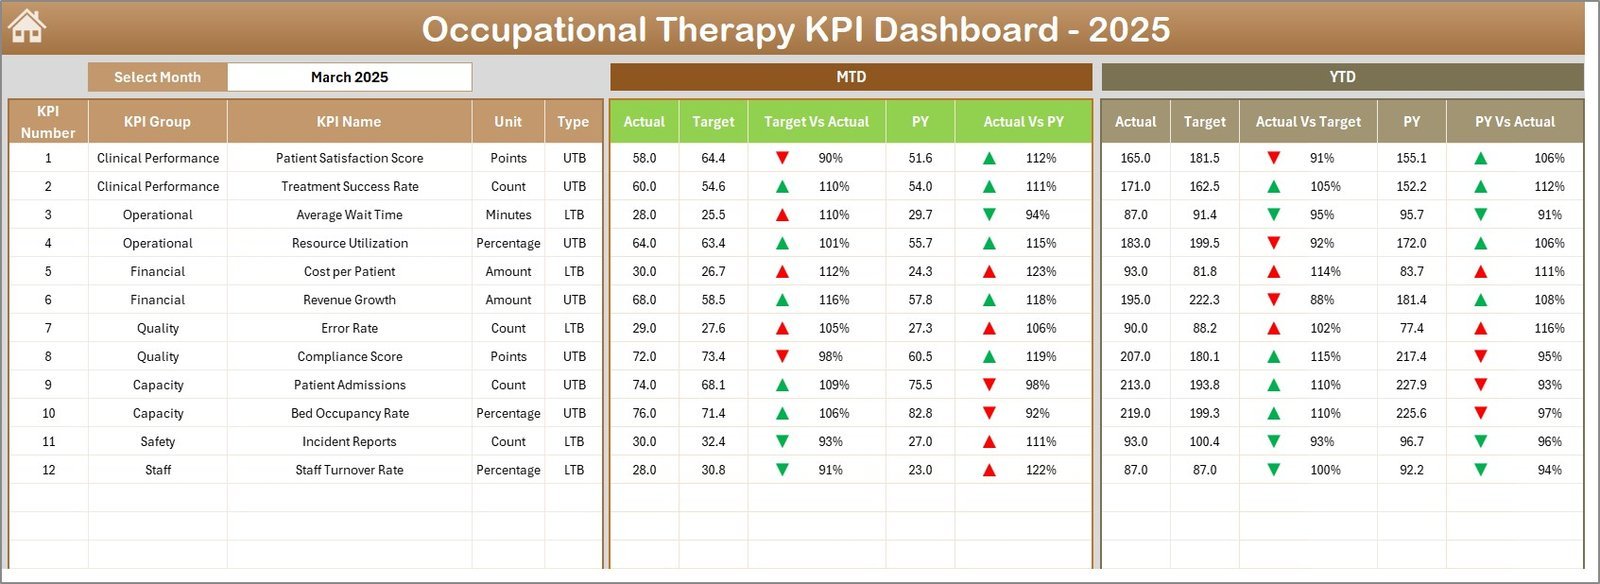
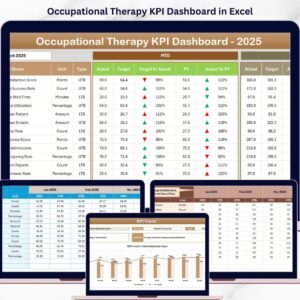
📊 Dashboard Sheet: The heart of the system showcasing comprehensive KPI data for any selected month. Easily select a month from the drop-down menu (cell D3) to dynamically update all metrics including Month-To-Date (MTD) Actual vs Target, Previous Year (PY) comparisons, and Year-To-Date (YTD) values. Conditional formatting with up/down arrows instantly highlights performance trends, making decision-making faster and more intuitive.
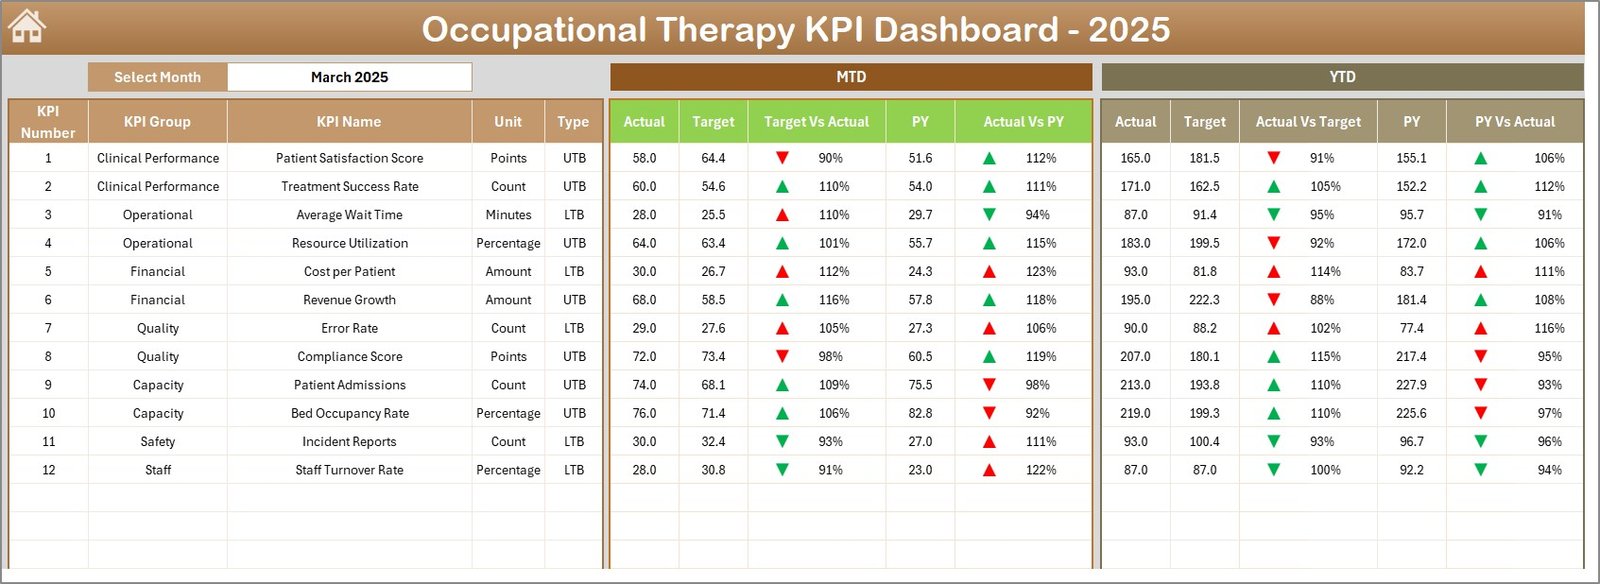
Caption: Occupational Therapy KPI Dashboard
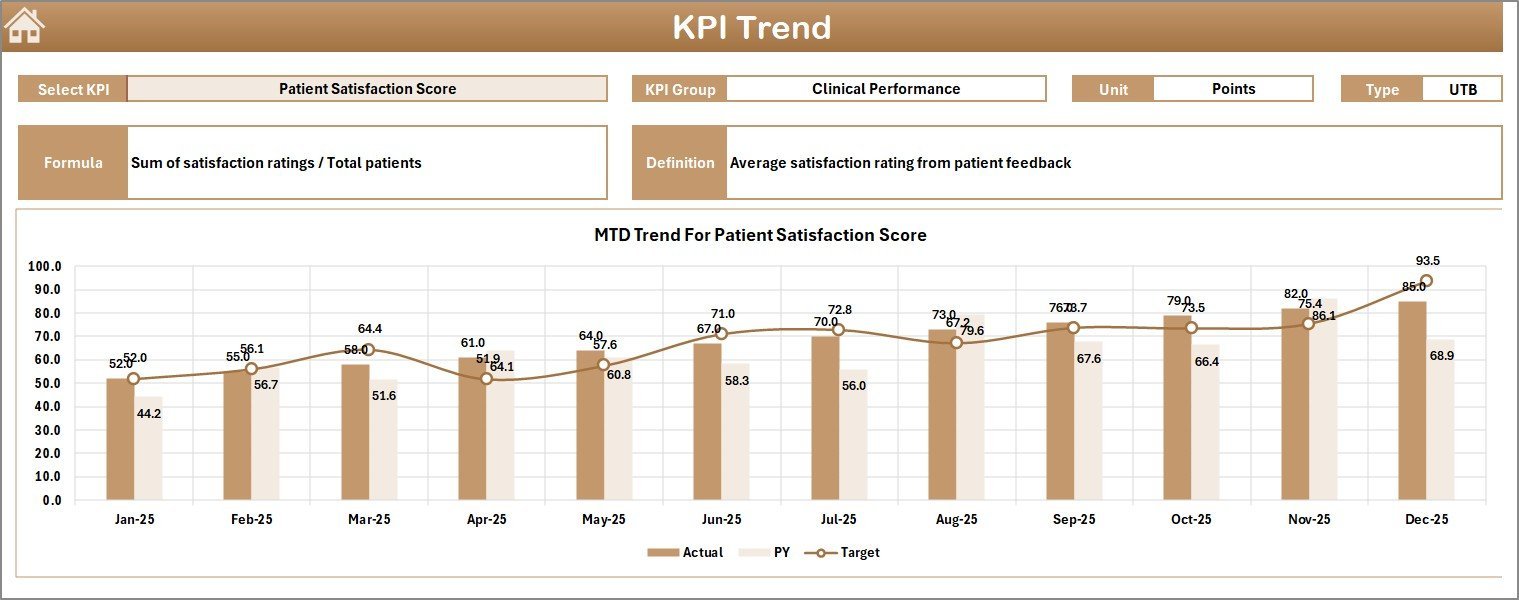
📈 KPI Trend Sheet: Visualize the trajectory of each KPI through dynamic charts. Select any KPI from the drop-down (cell C3) to view detailed information such as KPI Group, Unit, Type (Lower the Better or Upper the Better), Formula, and Definition. The MTD and YTD trend charts compare Actual, Target, and PY values, helping you identify performance patterns and areas for improvement quickly.
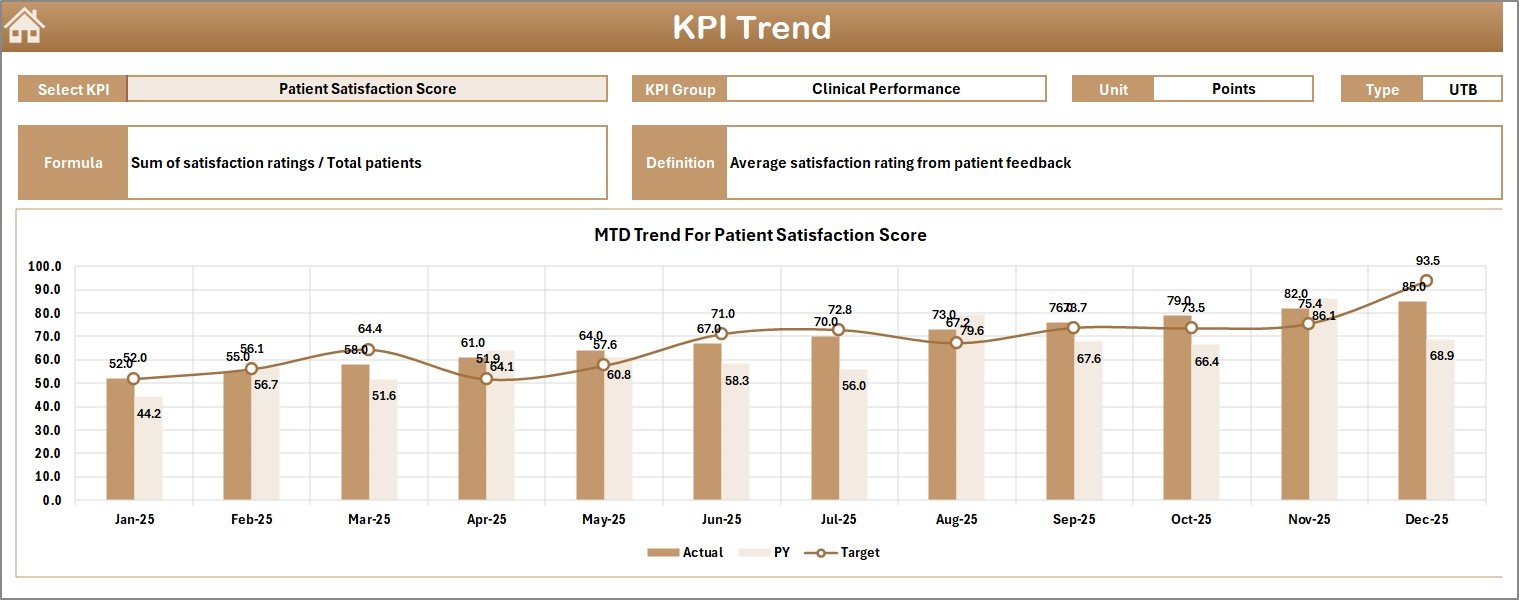
Caption: KPI Trend Sheet
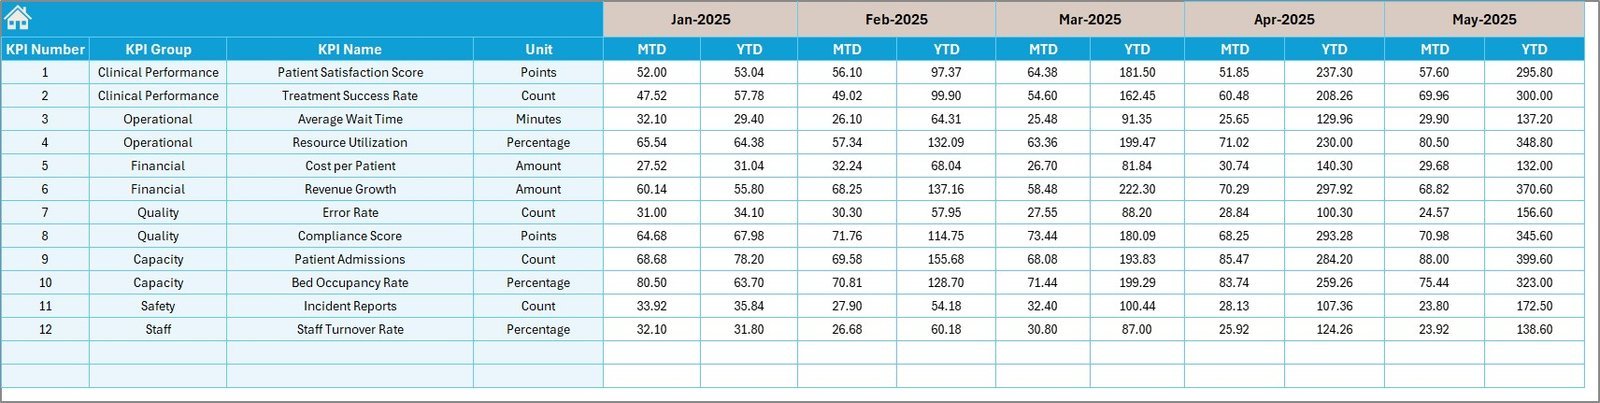
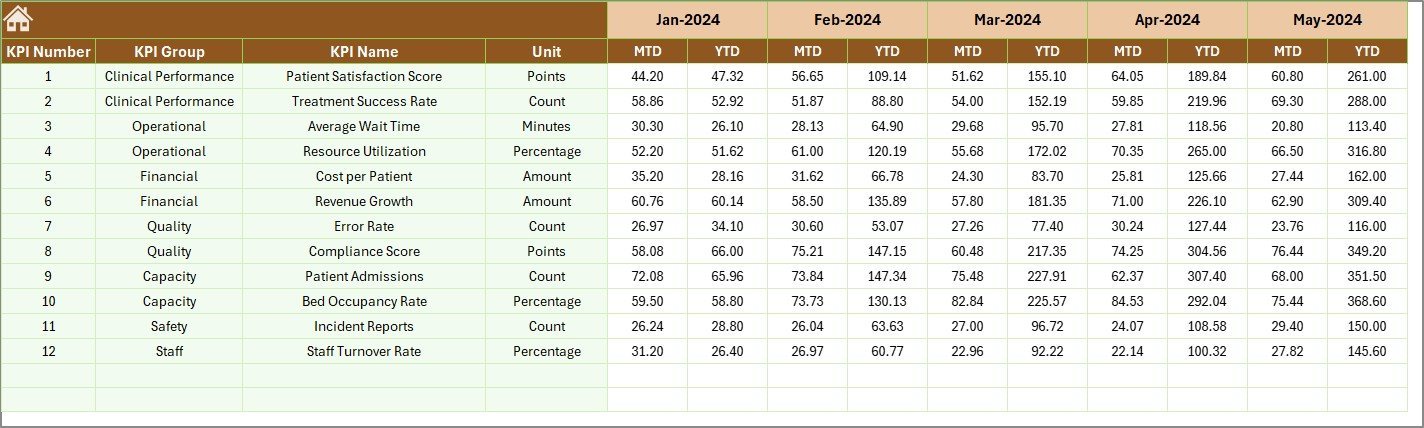
📝 Actual Numbers Input Sheet: Easily input your actual performance data for both MTD and YTD. You can set the starting month of the year in cell E1, and update monthly data as needed to keep your dashboard current and relevant.

Caption: Actual Numbers Input sheet
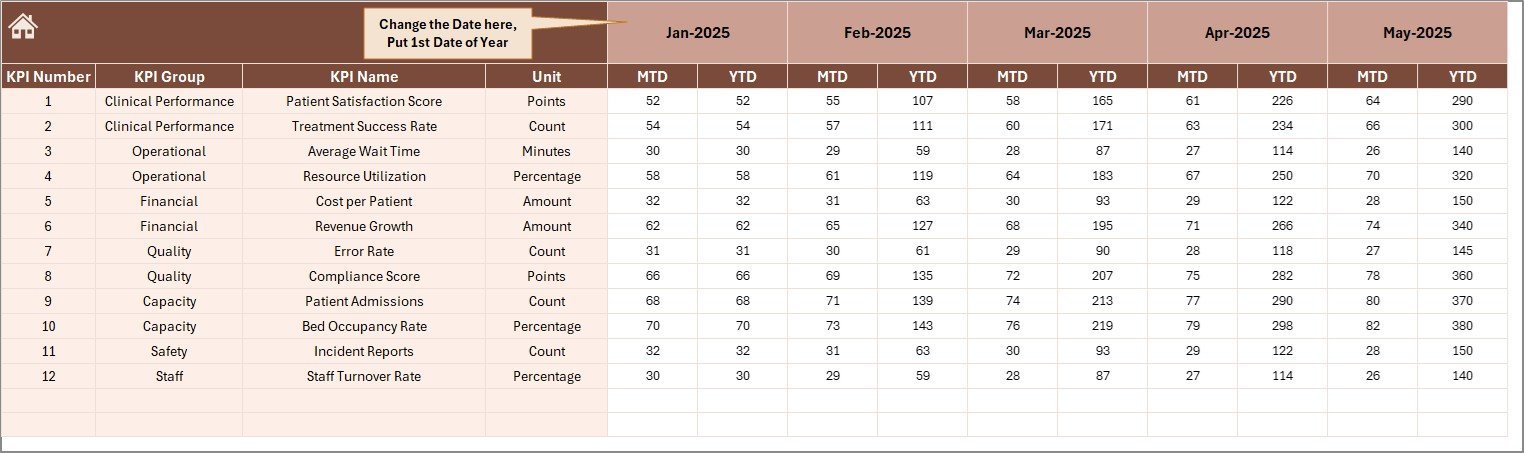
🎯 Target Number Input Sheet: Enter monthly target numbers for each KPI, both for MTD and YTD periods. This ensures your dashboard reflects realistic goals and helps track progress against benchmarks.
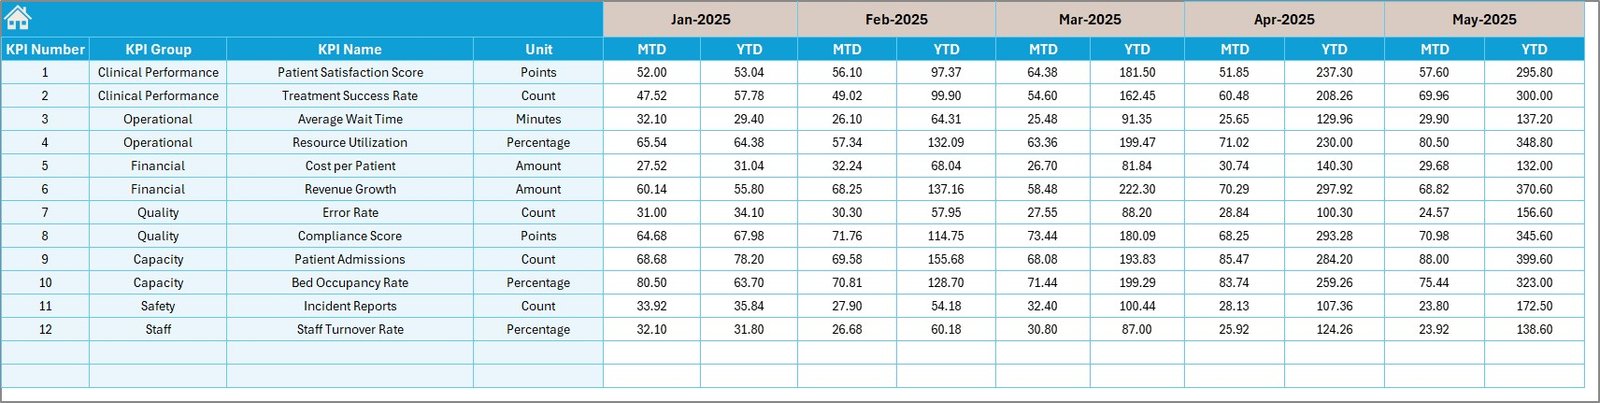
Caption: Target Number Input sheet
📅 Previous Year Number Sheet: Input last year’s KPI data to facilitate year-over-year comparisons, a critical component for identifying growth trends or performance dips.
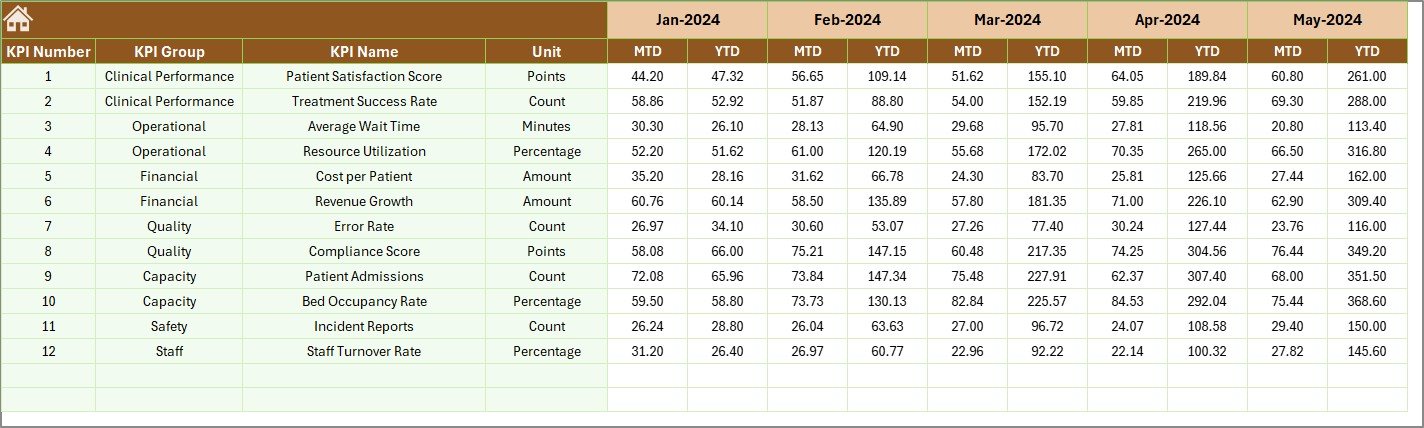
Caption: Previous Year Number Input sheet
📚 KPI Definition Sheet: Customize your dashboard by defining KPIs with detailed descriptions, formulas, units, groups, and KPI types (Lower the Better or Upper the Better). This sheet empowers you to tailor the dashboard precisely to your occupational therapy practice’s unique needs.

Caption: KPI Definition sheet
What’s Inside the Occupational Therapy KPI Dashboard
This comprehensive digital product includes:
📌 Seven fully editable worksheets designed to cover every aspect of KPI tracking and input.
📌 Interactive drop-down menus for easy month and KPI selection.
📌 Conditional formatting with intuitive arrows for quick visual performance assessment.
📌 Multiple trend charts for monthly and yearly data comparison.
📌 User-friendly input sheets for Actual, Target, and Previous Year data.
📌 Customizable KPI definitions with formulae and type specifications.
📌 A central Home sheet for seamless navigation across the dashboard.
📌 An Excel-compatible, ready-to-use digital file that works seamlessly on your computer.
How to Use the Occupational Therapy KPI Dashboard
✨ Start by opening the Home sheet, which acts as your dashboard control center.
✨ Select the month of interest in the Dashboard sheet to dynamically update all KPI data.
✨ Input your actual performance numbers in the Actual Numbers Input sheet, updating monthly as needed.
✨ Enter your target benchmarks in the Target Number Input sheet to maintain realistic performance goals.
✨ Update Previous Year data annually to enable year-over-year performance comparisons.
✨ Use the KPI Definition sheet to customize and add KPIs relevant to your practice.
✨ Analyze the trends and performance results visually on the KPI Trend sheet to make informed decisions.
✨ Leverage the conditional formatting on the Dashboard sheet to immediately identify KPIs that are on track or need attention.
Who Can Benefit from This Occupational Therapy KPI Dashboard
🎯 Occupational Therapists seeking to monitor patient outcomes and service efficiency.
🎯 Clinic Managers who want to track team performance and improve operational efficiency.
🎯 Healthcare Administrators aiming to align occupational therapy KPIs with broader organizational goals.
🎯 Data Analysts in healthcare who need a streamlined tool for KPI visualization and reporting.
🎯 Educators and students in occupational therapy programs looking for practical KPI tracking experience.
🎯 Consultants providing performance improvement services to therapy clinics.
🎯 Anyone responsible for quality control and process improvement in occupational therapy settings.
Click here to read the Detailed blog post.
Visit our YouTube channel to learn step-by-step video tutorials.
Compatibility and Requirements
- Works in Microsoft Excel desktop (Excel 2016 or later, or Microsoft 365).
- You pick the month and the KPI from dropdown lists. Microsoft explains them in Create a drop-down list.
Frequently Asked Questions
How many worksheets does the dashboard have?
Seven: Home, Dashboard, KPI Trend, Actual Numbers Input, Target Number Input, Previous Year Number and KPI Definition.
How do I change the month shown on the dashboard?
Select a month from the dropdown in cell D3 of the Dashboard sheet. The MTD Actual vs Target, Previous Year and YTD values update for that month.
Where do I enter my own data?
Enter actual MTD and YTD numbers in the Actual Numbers Input sheet, goals in the Target Number Input sheet and last year’s figures in the Previous Year Number sheet. You can set the starting month of the year in cell E1 of the Actual Numbers sheet.
Can I add or change KPIs?
Yes. The KPI Definition sheet holds the description, formula, unit, group and type (Lower the Better or Upper the Better) for each KPI, and you can edit them to fit your practice.
How do I see the trend for one KPI?
Open the KPI Trend sheet and choose a KPI from the dropdown in cell C3. The MTD and YTD charts compare Actual, Target and Previous Year values.
Is there a Power BI version?
Yes. See the Occupational Therapy KPI Dashboard in Power BI.
Related Occupational Therapy and Healthcare Templates
- Occupational Therapy KPI Dashboard in Power BI: the same KPIs in Power BI
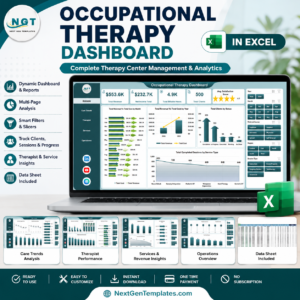
- Occupational Therapy Dashboard in Excel: another occupational therapy dashboard for Excel
- Speech Therapy KPI Dashboard in Excel: the same layout for speech therapy
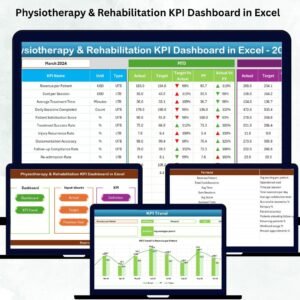
- Physiotherapy & Rehabilitation KPI Dashboard in Excel: KPI tracking for rehabilitation services
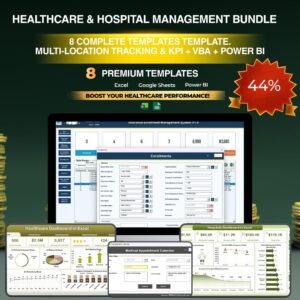
- Healthcare & Hospital Management Bundle: 8 templates for healthcare management in one download
Browse all Excel KPI dashboards.








Reviews
There are no reviews yet.