



Key Features of Hearing Aid Services KPI Dashboard
Introducing the Hearing Aid Services KPI Dashboard, a comprehensive digital tool designed to streamline the monitoring and management of key performance indicators (KPIs) for hearing aid service providers. This powerful dashboard includes 7 dynamic worksheets that provide an intuitive, all-in-one solution for tracking performance metrics, analyzing trends, and making data-driven decisions.
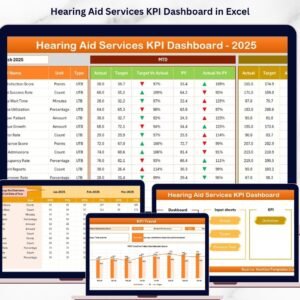
Start with the Home Sheet, an easy-to-navigate index featuring six interactive buttons that instantly guide you to the respective sheets. The Dashboard Sheet serves as the core hub, offering detailed monthly and year-to-date (YTD) performance data. Users can select any month via a drop-down menu in cell D3, dynamically updating all KPI figures including actuals, targets, and previous year comparisons. Visual aids like conditional formatting with up/down arrows instantly indicate performance trends versus targets and historical data.
The KPI Trend Sheet allows users to deep-dive into specific KPIs by selecting from a drop-down in cell C3. Here, you’ll find essential details including KPI groupings, units, types (whether lower or upper values are better), formulas, and clear definitions. This sheet also features insightful MTD and YTD trend charts, displaying actual, target, and prior year data to help identify patterns and opportunities for improvement.
For data input, the dashboard includes dedicated sheets: the Actual Numbers Input Sheet for entering monthly and YTD actual figures, and the Target Number Input Sheet for defining monthly and YTD goals. Additionally, the Previous Year Number Sheet enables easy entry of last year’s metrics to facilitate meaningful year-over-year comparisons.
Finally, the KPI Definition Sheet provides a structured space to maintain a master list of KPIs, detailing their names, groups, units, formulas, and descriptions. You can also specify KPI types here as either LTB (Lower the Better) or UTB (Upper the Better), ensuring clarity and consistency across reports.
What’s Inside the Hearing Aid Services KPI Dashboard
🗂️ 7 Comprehensive Worksheets: Including Home, Dashboard, KPI Trend, Actual Numbers Input, Target Numbers Input, Previous Year Numbers, and KPI Definitions for a complete performance tracking system.
📊 Interactive Month Selector: Easily switch between months in the Dashboard sheet to view tailored KPI results.
🔍 Dynamic Conditional Formatting: Visual up/down arrows highlight performance shifts for quick insights.
📈 Trend Analysis Charts: Compare MTD and YTD Actual, Target, and Previous Year KPIs visually for actionable insights.
✍️ Flexible Data Entry Sheets: Seamlessly input actuals, targets, and previous year data to keep your dashboard updated.
📚 Clear KPI Definitions: Understand every KPI’s purpose, calculation, and ideal direction (lower or upper better).
🖱️ Easy Navigation: Use the Home sheet’s buttons to jump between sections with ease.
💻 User-Friendly Interface: Designed for professionals without advanced technical skills.
🔄 Year-to-Date & Month-to-Date Tracking: Monitor short-term and cumulative performance effectively.
🎯 Performance Targets & Comparisons: Align goals and assess progress against previous years.
How to Use the Hearing Aid Services KPI Dashboard
🗓️ Step 1: Enter Data – Begin by inputting your actual monthly and YTD numbers in the Actual Numbers Input Sheet, setting the starting month in cell E1.
🎯 Step 2: Set Targets – Define your monthly and YTD target figures in the Target Number Input Sheet to establish benchmarks for success.
📅 Step 3: Update Previous Year Data – Fill in last year’s corresponding figures in the Previous Year Number Sheet for meaningful comparisons.
🔎 Step 4: Review KPI Definitions – Familiarize yourself with the KPIs in the KPI Definition Sheet to ensure clarity and context.
📊 Step 5: Analyze Dashboard – Use the Dashboard Sheet to select the desired month and instantly view all KPIs with visual trend indicators.
📈 Step 6: Explore Trends – Dive into the KPI Trend Sheet to track specific KPI progress with detailed charts and definitions.
🖱️ Step 7: Navigate Easily – Use the Home Sheet buttons for quick access to any section.
🔄 Step 8: Regular Updates – Keep your data current by updating input sheets monthly to maintain accurate performance insights.
💡 Step 9: Make Data-Driven Decisions – Leverage insights from trends and comparisons to optimize hearing aid service operations.
📢 Step 10: Share and Report – Use dashboard visuals to communicate performance with stakeholders effectively.
Who Can Benefit from This Hearing Aid Services KPI Dashboard
👂 Hearing Aid Clinics & Providers: Monitor service quality and operational KPIs to improve patient outcomes.
📈 Business Analysts: Gain detailed insights to support strategic planning within hearing aid service organizations.
👩💼 Operations Managers: Track performance metrics, identify bottlenecks, and optimize resource allocation.
📊 Executives & Decision Makers: Access clear, consolidated KPI data for informed leadership decisions.
🧑💻 Data Professionals: Utilize a ready-made, customizable dashboard to save time on KPI tracking.
🎯 Sales & Marketing Teams: Understand performance trends to tailor campaigns and improve customer engagement.
👥 Healthcare Consultants: Evaluate hearing aid service metrics to recommend process improvements.
📅 Project Managers: Align project targets with actual performance through detailed monthly and YTD analysis.
📚 Training & Development Coordinators: Use KPI trends to identify areas needing staff training.
💼 Small to Medium Hearing Aid Businesses: Leverage affordable, easy-to-use analytics for competitive advantage.
Click here to read the Detailed blog post.
Visit our YouTube channel to learn step-by-step video tutorials.

Compatibility and Requirements
- Works in Microsoft Excel desktop (Excel 2016 or later, or Microsoft 365).
- You pick the month and the KPI from drop-down lists. Microsoft’s guide to creating a drop-down list explains how they work.
Frequently Asked Questions
How many worksheets are in the Hearing Aid Services KPI Dashboard?
Seven: Home, Dashboard, KPI Trend, Actual Numbers Input, Target Numbers Input, Previous Year Numbers and KPI Definition. The Home sheet has six buttons that open the other sheets.
How do I change the month on the Dashboard?
Select the month in the drop-down in cell D3. The MTD and YTD actual, target and previous year figures update, with up and down arrows for each KPI.
Where do I set the starting month?
Enter it in cell E1 of the Actual Numbers Input sheet, then add your monthly and YTD actuals.
Can I add my own hearing aid KPIs?
Yes. Add the KPI name, group, unit, formula and description on the KPI Definition sheet and mark it as LTB (Lower the Better) or UTB (Upper the Better).
Related Clinic and Healthcare KPI Templates
- Hearing Aid Services KPI Dashboard in Power BI: the same KPIs in Power BI.
- Clinics KPI Dashboard in Excel: KPIs for general clinics.
- Healthcare KPI Dashboard In Excel: broader healthcare KPIs in Excel.
- Healthcare KPI Dashboard in Google Sheets: for teams that work in Google Sheets.
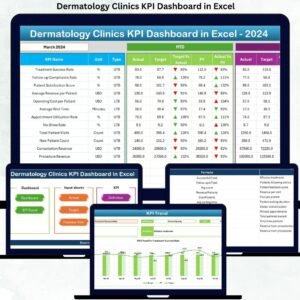
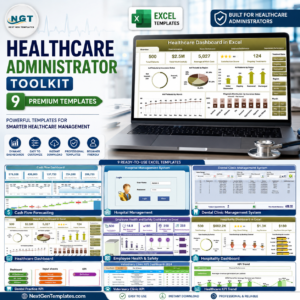
- Healthcare Administrator Toolkit: 9 Excel healthcare templates in one pack.
Browse all Excel KPI dashboards or the Excel health and safety templates.








Reviews
There are no reviews yet.