



The Digital Learning KPI Dashboard in Excel is a powerful and user-friendly tool designed for education providers, training managers, and e-learning professionals who want to track, analyze, and optimize the performance of digital learning programs. This customizable dashboard allows you to monitor key performance indicators (KPIs) such as course completion rates, learner engagement, assessment scores, and content effectiveness.
With real-time data tracking and insightful visualizations, this dashboard provides comprehensive insights into your digital learning programs, helping you make informed decisions, improve learner outcomes, and enhance the overall effectiveness of your e-learning initiatives. Whether you’re running online courses, corporate training programs, or digital educational content, this tool simplifies performance tracking and empowers you to optimize your digital learning efforts.
Key Features of the Digital Learning KPI Dashboard in Excel
🎓 Comprehensive Learning Performance Tracking
Track essential KPIs such as course completions, learner engagement, assessment scores, and content effectiveness. Monitor every aspect of your digital learning programs in one place for a holistic view.
⚡ Real-Time Learner Monitoring
Monitor the progress of learners in real time. Track course completions, quiz results, and engagement metrics, allowing you to quickly identify underperforming areas and take corrective actions.
📈 Course Effectiveness Insights
Analyze the effectiveness of your digital courses by visualizing metrics like learner retention, completion rates, and feedback scores. Identify the most effective courses and areas where learners may need additional support.
📅 Customizable KPIs for Digital Learning
Tailor the dashboard to track KPIs specific to your digital learning program, such as assessment scores, learner satisfaction, and course ratings. Adjust it to match your program’s goals and objectives.
🖥️ Interactive & User-Friendly Interface
The Excel-based dashboard is designed for ease of use, offering interactive features like slicers, filters, and drill-down capabilities. This makes it easy to explore data and gain deeper insights into your digital learning programs.
Why You’ll Love the Digital Learning KPI Dashboard in Excel

✅ Track Key Learning Metrics
Monitor performance metrics such as learner engagement, course completion, and assessment results in real-time, ensuring that you’re always aware of how your digital learning programs are performing.
✅ Optimize Learning Outcomes
Analyze course effectiveness and learner engagement to identify opportunities to improve your digital learning programs, increase completion rates, and boost learner satisfaction.
✅ Improve Content & Course Design
Track learner feedback and performance to continuously improve your digital content. Focus on the areas that need attention and create a better learning experience for your audience.
✅ Enhance Learner Engagement
Measure engagement levels by monitoring participation rates, quiz scores, and course completions. Use this data to optimize learning strategies and encourage higher engagement from learners.
✅ Make Data-Driven Learning Decisions
Leverage insights from KPIs to make informed decisions about course design, content updates, and learner support initiatives, ensuring that your digital learning programs are always aligned with educational goals.
What’s Inside the Digital Learning KPI Dashboard Template?
- Course & Learner Tracking: Track course completions, learner progress, and engagement metrics.
- Assessment & Quiz Performance: Monitor assessment scores, quiz results, and learner feedback.
- Learner Engagement Insights: Visualize engagement metrics such as participation rates and active learning.
- Customizable KPIs: Tailor the dashboard to your specific digital learning objectives and metrics.
- Interactive Reporting: Use charts, slicers, and graphs to visualize performance trends and make data-driven decisions.
How to Use the Digital Learning KPI Dashboard in Excel
1️⃣ Download the Template: Access the Digital Learning KPI Dashboard instantly.
2️⃣ Enter Learning Data: Input data such as course completions, learner engagement, assessment results, and feedback.
3️⃣ Track & Analyze KPIs: Use the dashboard to monitor real-time performance across courses and learners.
4️⃣ Optimize Learning Programs: Use insights from the dashboard to enhance course content, improve learner engagement, and increase completion rates.
Who Can Benefit from the Digital Learning KPI Dashboard in Excel?
🔹 Educational Institutions & E-Learning Providers
🔹 Training Managers & Learning Coordinators
🔹 HR & Corporate Training Teams
🔹 Instructional Designers & Content Developers
🔹 Business Owners & Organizations Offering Online Courses
🔹 Anyone Looking to Optimize Digital Learning Programs
Track, analyze, and optimize your digital learning programs with the Digital Learning KPI Dashboard in Excel. Monitor learner engagement, course performance, and educational outcomes to improve learning experiences and drive success.
Click here to read the Detailed blog post
Visit our YouTube channel to learn step-by-step video tutorials
Youtube.com/@PKAnExcelExpert
Compatibility and Requirements
- Works in Microsoft Excel desktop (Excel 2016 or later, or Microsoft 365).
- Slicers filter the dashboard. Microsoft explains them in Use slicers to filter data.
Frequently Asked Questions
Which KPIs does it track?
Course completions, learner progress and engagement, assessment scores, quiz results, learner feedback and participation rates.
Can I filter and drill down?
Yes. The dashboard has slicers, filters and drill-down.
Can I change the KPIs?
Yes. You can track your own KPIs, such as assessment scores, learner satisfaction and course ratings.
Is there a Power BI or Google Sheets version?
Yes. See the Digital Learning KPI Dashboard in Power BI and the Digital Learning KPI Dashboard in Google Sheets.
Related Digital Learning Templates
- Digital Learning KPI Scorecard in Excel: a scorecard view
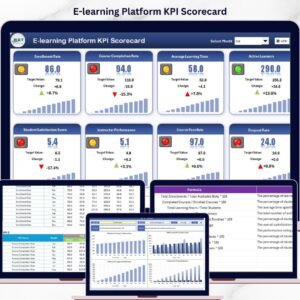
- E-learning Platform KPI Dashboard in Excel: KPIs for an e-learning platform
- Online Learning Platforms KPI Dashboard in Excel: compare learning platforms
- E-learning Course Calendar in Excel: schedule courses
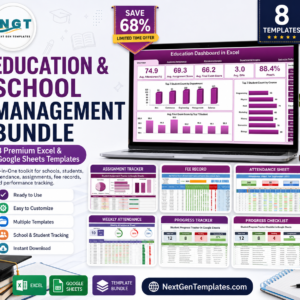
- Education & School Management Bundle: 8 education templates in one bundle
Browse all Excel KPI dashboards or the Excel education templates.



















Reviews
There are no reviews yet.