In today’s rapidly evolving financial ecosystem, microfinance institutions (MFIs) play a vital role in supporting small businesses, empowering rural entrepreneurs, and providing financial access to underserved communities. However, managing thousands of microloans, monitoring repayment behavior, tracking interest income, and evaluating branch performance can quickly become complex without structured analytics.
The Microfinance Institutions Dashboard in Excel is a powerful, ready-to-use analytical solution designed to simplify financial monitoring and portfolio management. Instead of relying on scattered spreadsheets and manual reporting, this dashboard transforms raw loan data into clear, visual insights that help institutions make faster and smarter decisions.
Built entirely in Microsoft Excel, this dashboard provides an affordable yet professional analytics platform suitable for both small and large microfinance organizations. With automated calculations, interactive charts, KPI cards, and dynamic slicers, users can monitor lending performance from a centralized interface.
The dashboard enables decision-makers to track loan distribution, repayment performance, outstanding balances, and interest trends across branches, regions, and loan types. As a result, management teams gain real-time visibility into operational health while improving financial planning and risk management.
Because Excel is widely accessible and easy to customize, organizations can implement this solution immediately without investing in expensive business intelligence software. Consequently, teams spend less time preparing reports and more time analyzing performance and improving lending strategies.
🚀 Key Feature of Microfinance Institutions Dashboard in Excel
📊 Centralized Loan Portfolio Monitoring
Track loans, repayments, balances, and interest performance in one dashboard.
🎛️ Interactive Slicers & Filters
Analyze performance instantly by branch, region, or loan category.
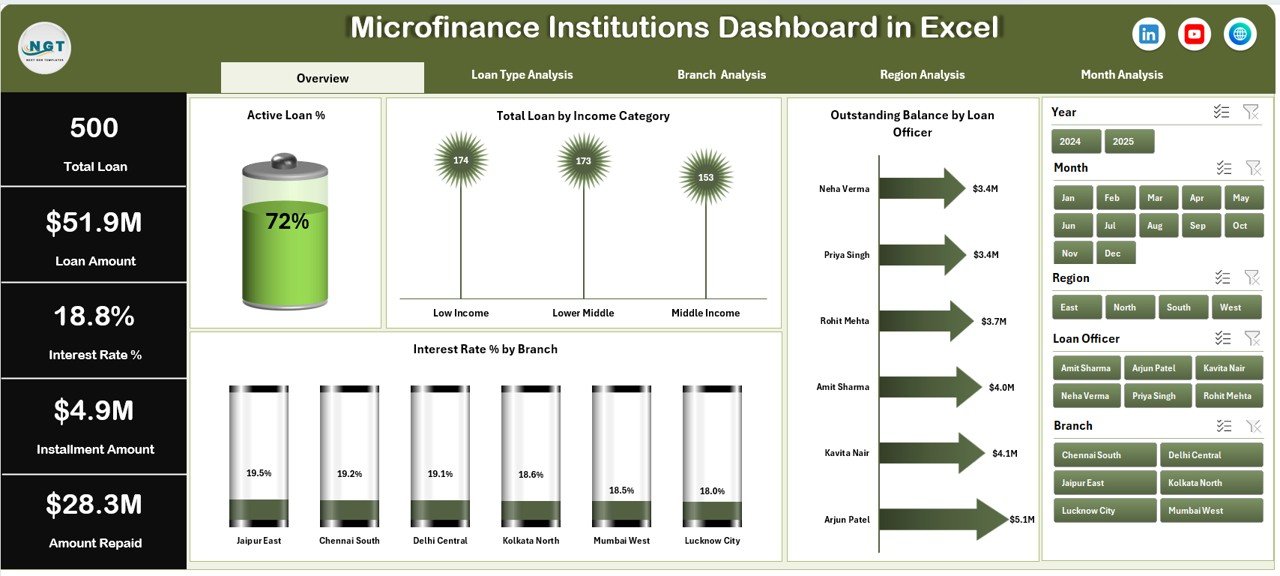
📈 Dynamic KPI Cards
Quickly understand institutional health using visual performance indicators.
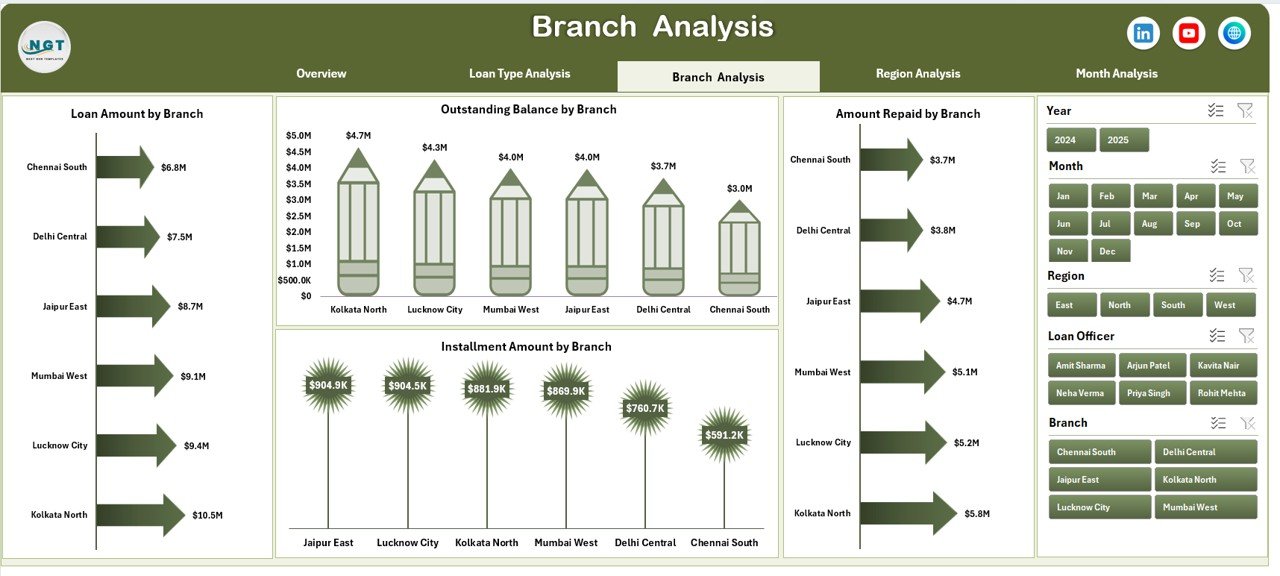
🏦 Branch Performance Analysis
Compare loan amounts, interest income, and instalments across branches.
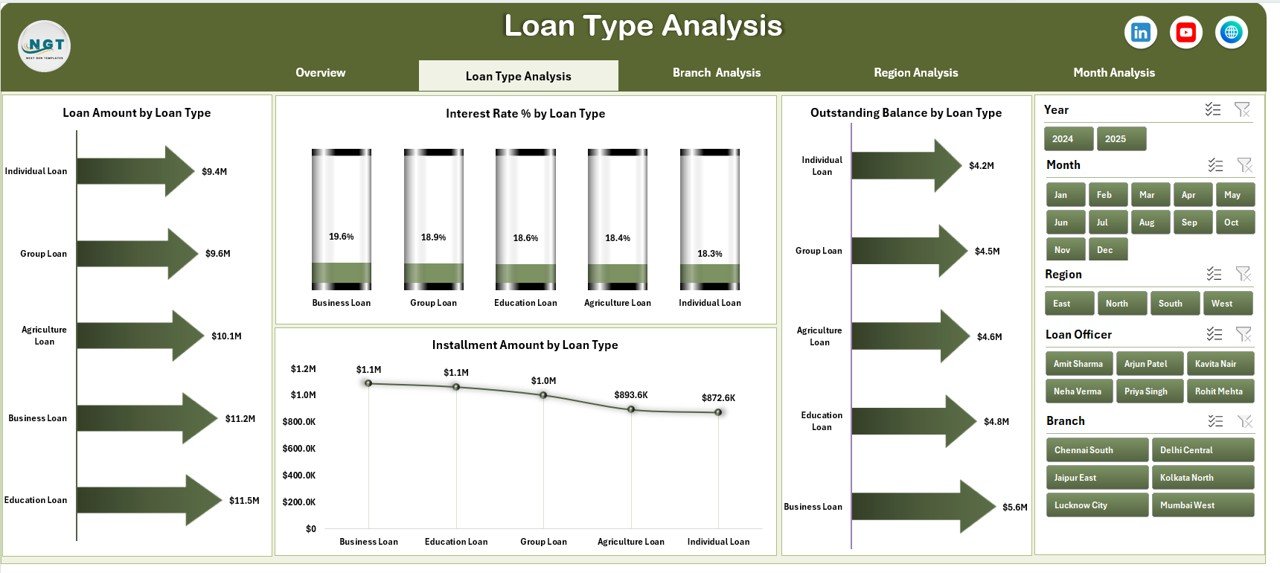
💼 Loan Product Evaluation
Identify profitable loan types and optimize lending strategies.
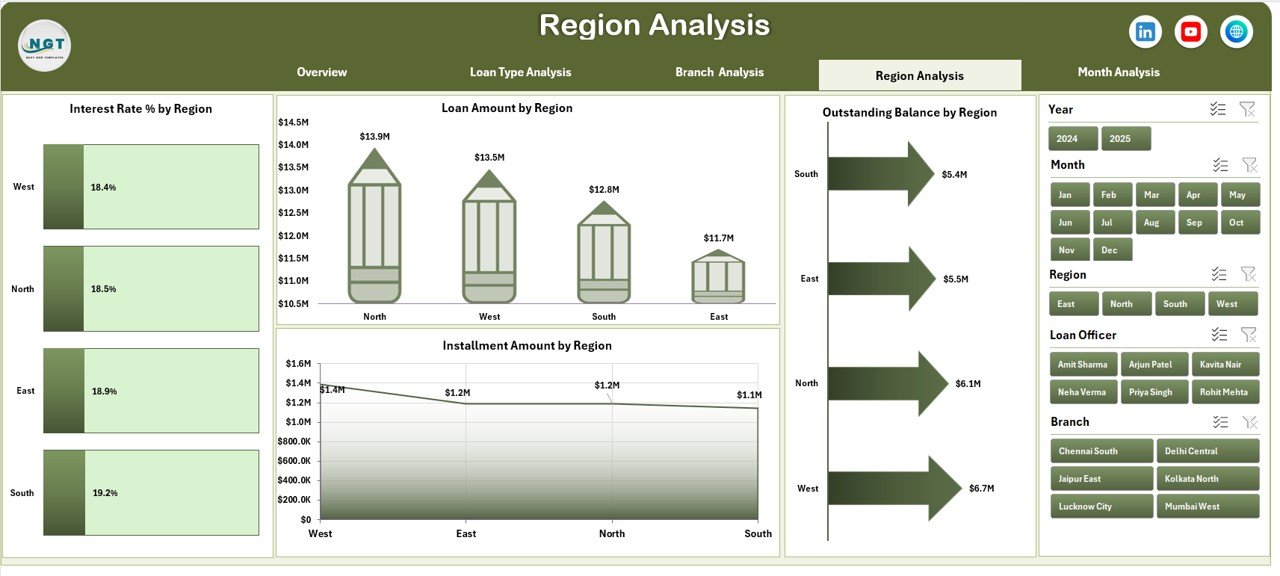
🌍 Regional Performance Insights
Understand geographic trends and borrower behavior patterns.
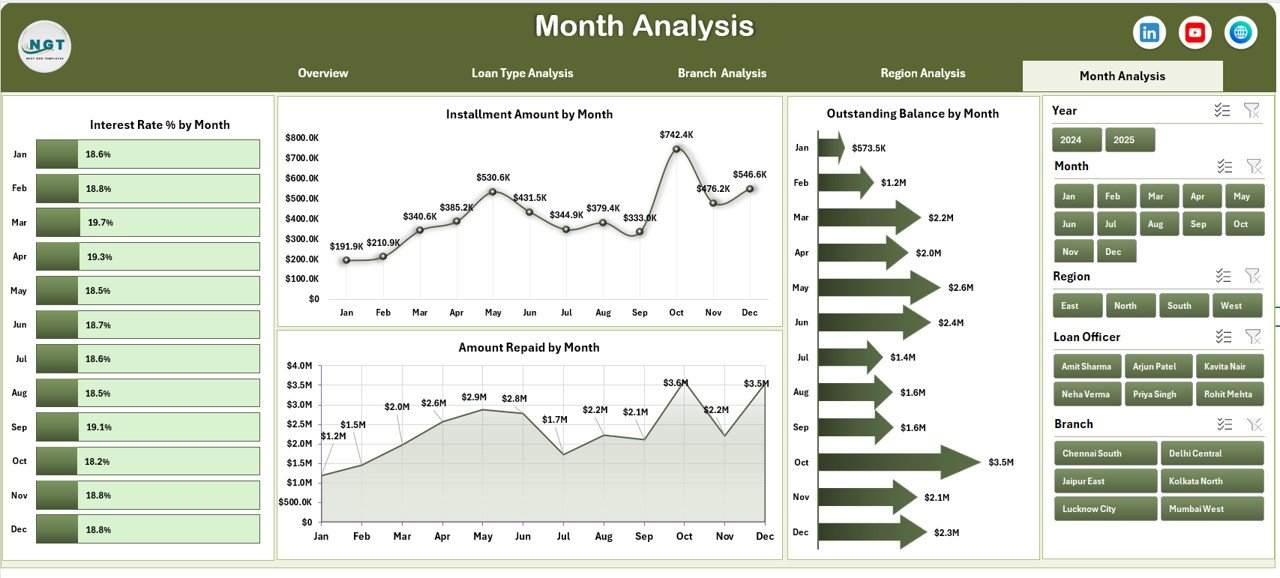
📅 Monthly Trend Analysis
Monitor repayment and financial performance over time.
⚡ Automated Excel Calculations
Update data once and refresh the entire dashboard automatically.
📦 What’s Inside the Microfinance Institutions Dashboard in Excel
This ready-to-use Excel dashboard includes a complete financial analytics structure:
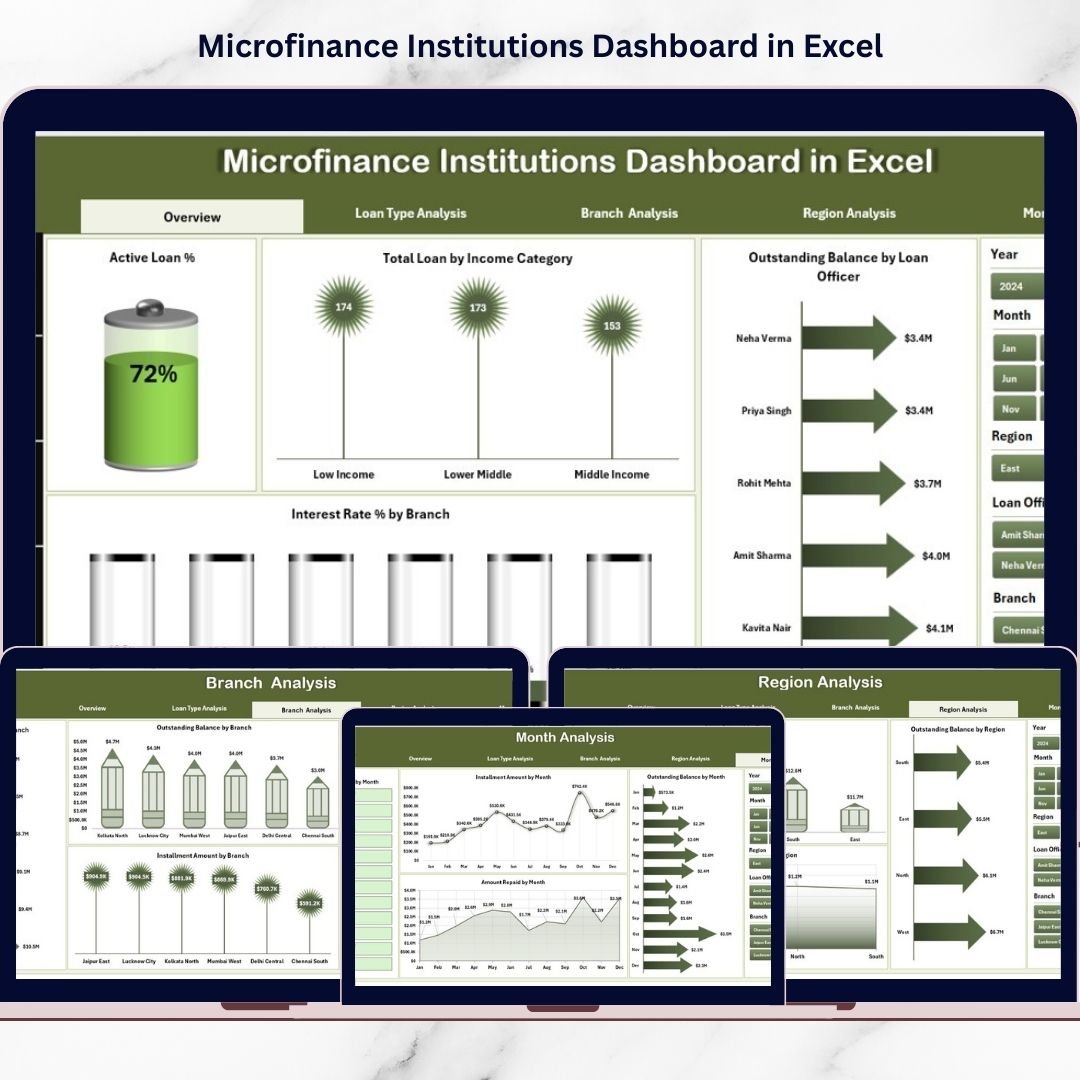
✅ 5 Analytical Dashboard Pages
-
Overview Page
-
Loan Type Analysis
-
Branch Analysis
-
Region Analysis
-
Month Analysis
✅ Interactive Page Navigator for easy navigation
✅ Dynamic Charts & KPI Cards
✅ Automated Calculations & Reporting
✅ Support Sheet for backend processing
✅ Data Sheet for structured data entry
Simply enter your loan data and begin analyzing performance immediately.
🛠️ How to Use the Microfinance Institutions Dashboard in Excel
The dashboard is designed for simplicity and quick adoption:
1️⃣ Enter loan data in the Data Sheet.
2️⃣ Verify automated calculations in the Support Sheet.
3️⃣ Use slicers to filter branches, regions, or loan categories.
4️⃣ Review KPI cards on the Overview page.
5️⃣ Navigate across analytical pages using the Page Navigator.
6️⃣ Analyze trends and make informed lending decisions.
Because all charts update automatically, reporting becomes faster and error-free.
👥 Who Can Benefit from This Microfinance Institutions Dashboard in Excel
This dashboard supports multiple stakeholders within financial institutions:
🏦 Microfinance Institutions (MFIs)
📊 Financial Analysts
📍 Branch Managers
💰 NGO Finance Teams
📈 Portfolio Managers
🤝 Investors & Stakeholders
Any organization managing loan portfolios or financial inclusion programs can benefit from this solution.
By implementing this dashboard, institutions improve transparency, strengthen repayment monitoring, and enhance operational efficiency. Instead of reacting to problems late, management teams identify risks early and take proactive action.
### Click here to read the Detailed blog post
Visit our YouTube channel to learn step-by-step video tutorials:
👉 https://youtube.com/@PKAnExcelExpert


