In today’s fast-paced innovation environment, managing research initiatives without real-time insights can slow down growth and increase risk. Many organizations still rely on fragmented spreadsheets and delayed reports, which makes it difficult to monitor budgets, timelines, and innovation performance.That is exactly why the Research and Development Dashboard in Power BI is designed to be your ultimate command center.This powerful, ready-to-use Power BI dashboard transforms complex R&D data into clear, interactive, and decision-ready insights. Instead of manually compiling reports, your team can instantly track project health, control spending, monitor risks, and evaluate innovation output — all from one centralized interface.
Whether you manage multiple research projects or oversee strategic innovation initiatives, this dashboard helps you move from reactive reporting to proactive decision-making.
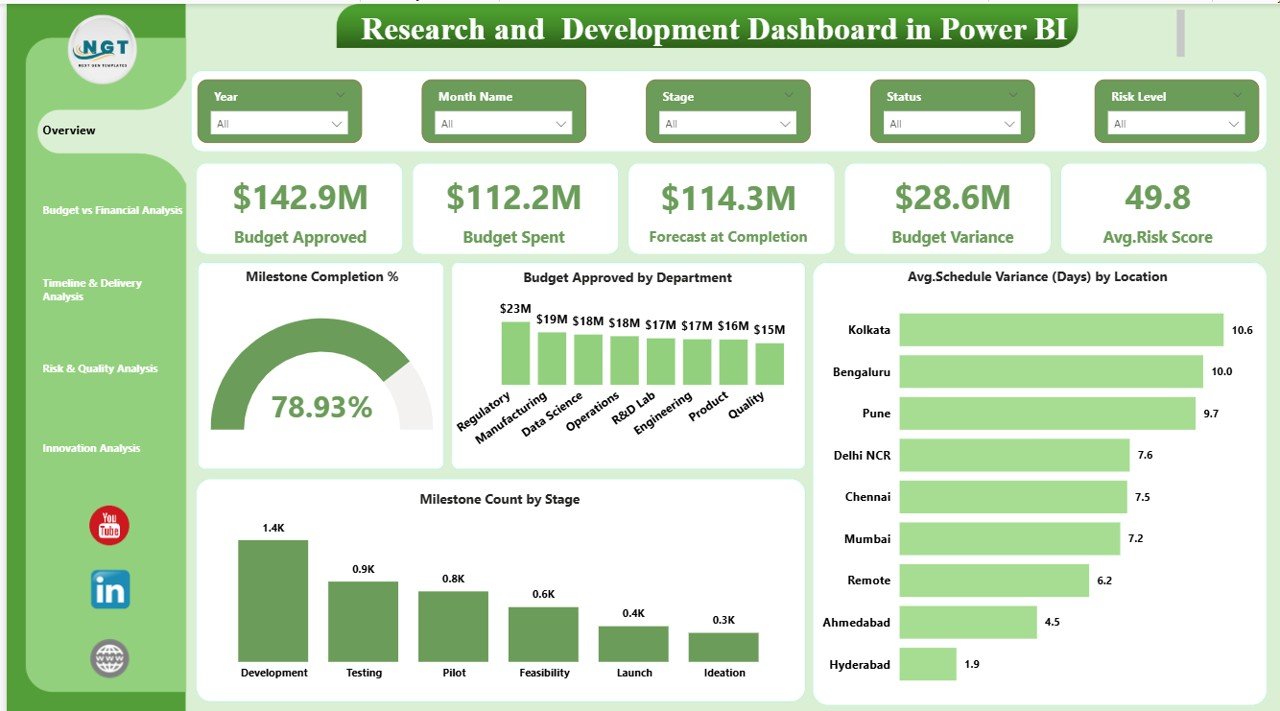
🔥 Key Feature of Research and Development Dashboard in Power BI
✨ Executive KPI Cards – Instantly monitor Budget Approved, Budget Spent, Forecast at Completion, Budget Variance, Average Risk Score, and Milestone Completion %.
📊 Five Powerful Analytical Pages – Get deep insights across Overview, Financial, Timeline, Risk, and Innovation performance areas.
🎯 Interactive Slicers – Filter data by Department, Product Line, Priority, Location, and Sponsor for instant drill-down analysis.
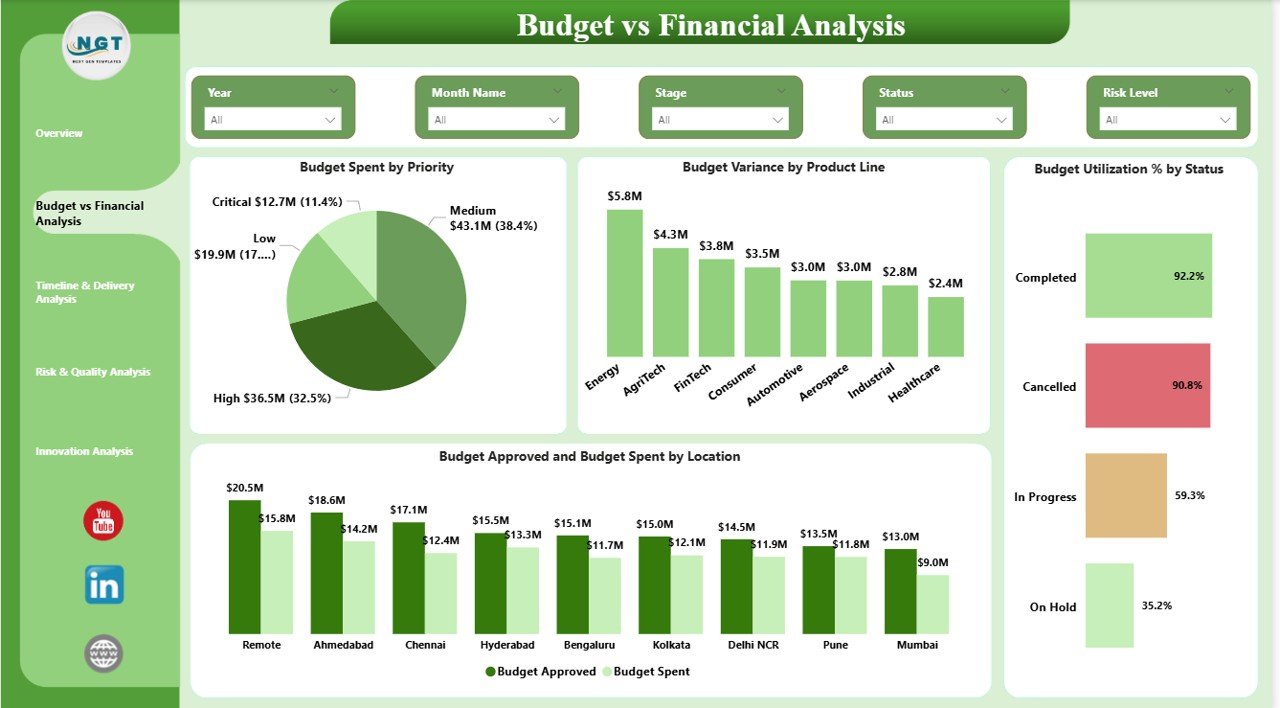
💰 Advanced Budget Monitoring – Track budget utilization, variance, and spending efficiency to prevent cost overruns.
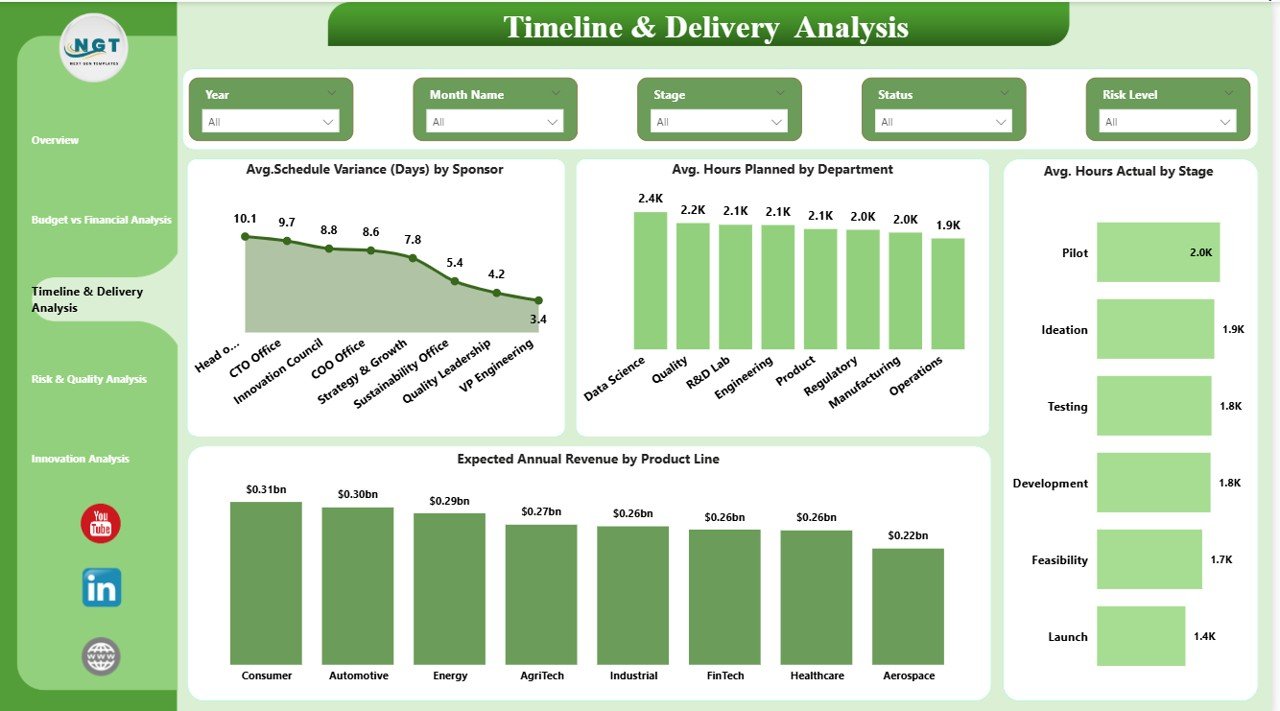
⏳ Timeline & Delivery Insights – Compare planned vs actual hours and identify schedule delays early.
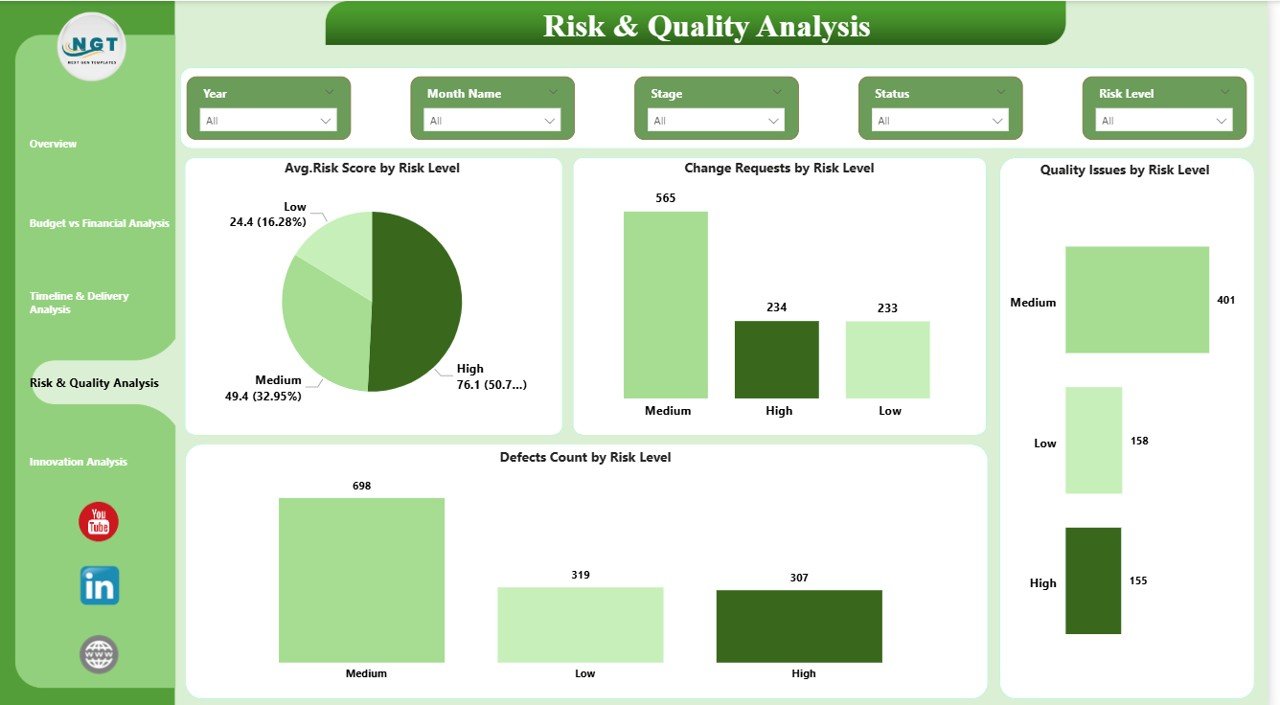
⚠️ Risk & Quality Visibility – Monitor defects, change requests, and risk scores to reduce project failures.
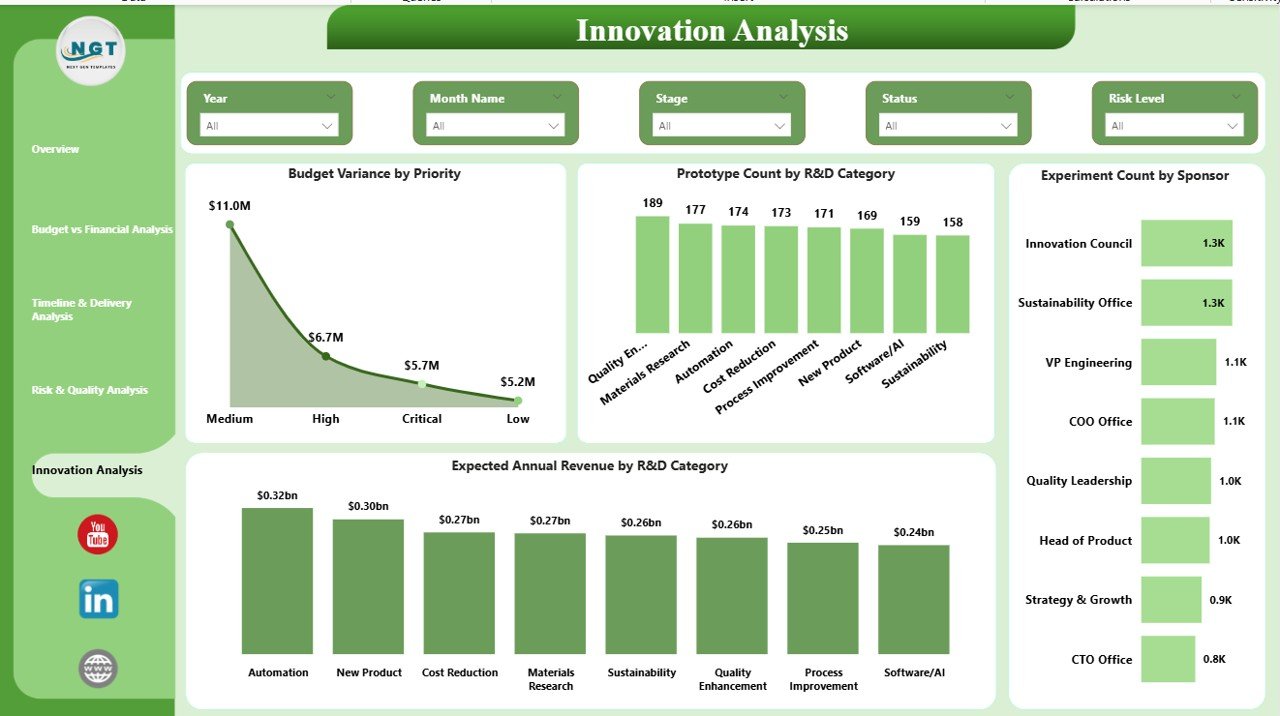
🚀 Innovation Performance Tracking – Measure prototype pipeline, experiments, and expected revenue impact.
🖥️ Fully Dynamic Power BI Visuals – Built using best-practice visuals for fast and intuitive navigation.
📦 What’s Inside the Research and Development Dashboard in Power BI
When you download this template, you get a professionally designed Power BI solution ready for immediate use.
✔️ Interactive Overview Dashboard
✔️ Budget vs Financial Analysis Page
✔️ Timeline & Delivery Analysis Page
✔️ Risk & Quality Analysis Page
✔️ Innovation Analysis Page
✔️ Fully functional slicers and filters
✔️ Clean and structured data model
✔️ Easy customization capability
Everything is pre-built so you can plug in your data and start analyzing within minutes.
🛠️ How to Use the Research and Development Dashboard in Power BI
Using this dashboard is simple and user-friendly.
Step 1: Load your R&D dataset into Power BI.
Step 2: Connect the data to the dashboard model.
Step 3: Refresh the visuals.
Step 4: Use slicers to filter by Department, Priority, Location, or Sponsor.
Step 5: Monitor KPIs and take data-driven actions.
Because the dashboard is fully dynamic, your visuals update automatically whenever data changes.
🎯 Who Can Benefit from This Research and Development Dashboard in Power BI
This dashboard is ideal for multiple business roles:
👨🔬 R&D Managers – Track project progress, milestones, and risks.
💰 Finance Teams – Monitor budget utilization and variance.
🧪 Innovation Leaders – Evaluate prototype and experiment performance.
🏢 Executives & Decision Makers – Get high-level visibility into R&D health.
📊 Project Managers – Improve delivery timelines and resource planning.
🚀 Strategy Teams – Align innovation investments with business goals.
If your organization runs research programs, product development, or innovation initiatives, this dashboard will deliver immediate value.
Click hare to read the Detailed blog post
Visit our YouTube channel to learn step-by-step video tutorials:
👉 https://Youtube.com/@PKAnExcelExpert