
Precision drives profit in tool and die manufacturing. A slight rise in material cost can shrink margins. A small drop in quality rating can risk major contracts. And delayed reporting can cost you competitive advantage.
If you are still managing performance through scattered spreadsheets, you are reacting — not leading.
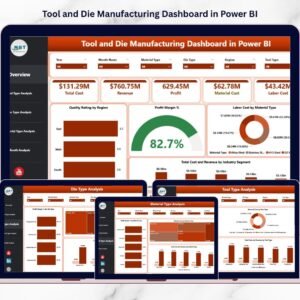
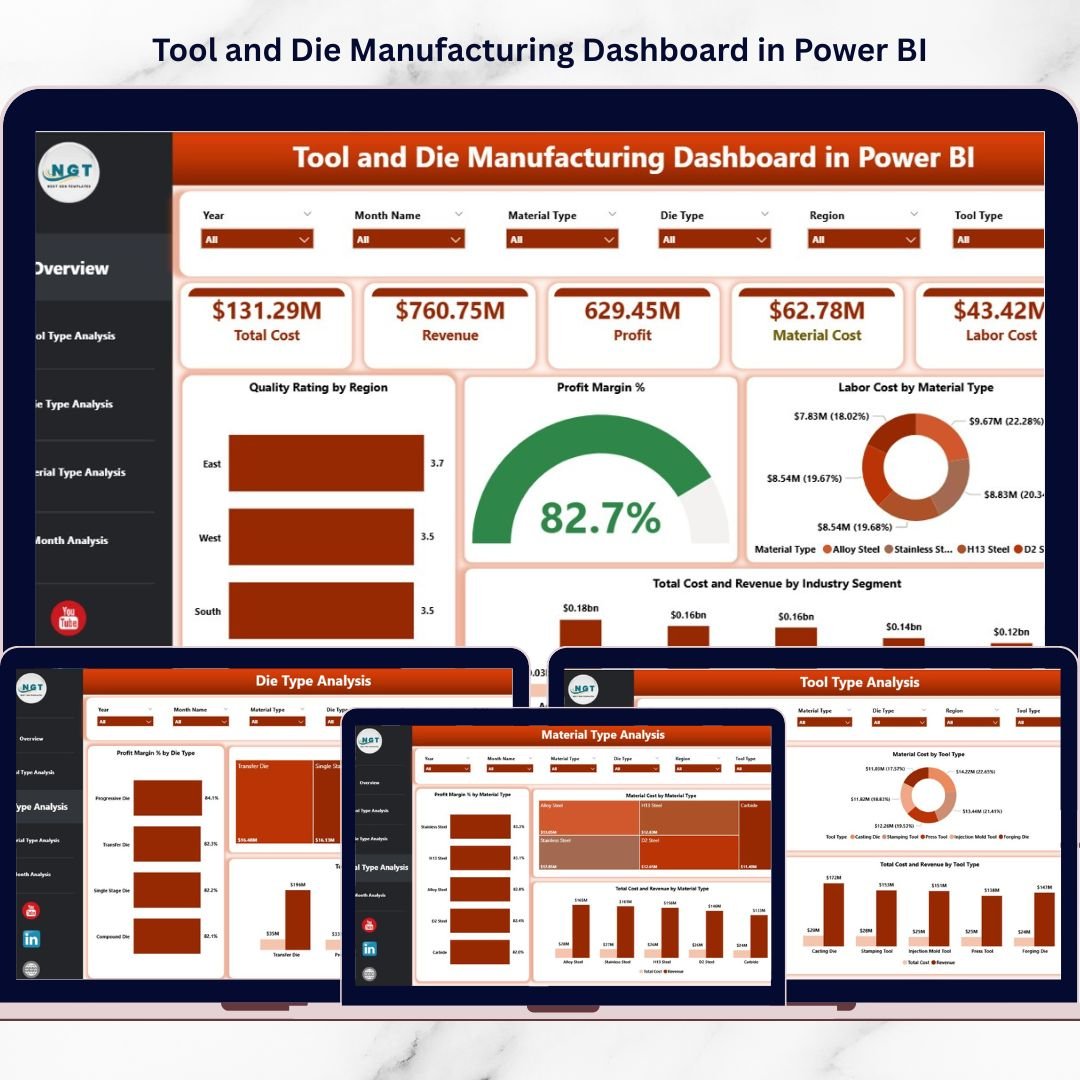
Introducing the Tool and Die Manufacturing Dashboard in Power BI — a ready-to-use, interactive analytics solution built specifically for tool rooms, die manufacturers, mold makers, and precision engineering companies.
This dashboard transforms raw production and financial data into dynamic KPI cards, slicers, and powerful visuals — all inside one centralized system.
No manual consolidation. No guesswork. Just real-time, data-driven clarity.
🚀 Key Feature of Tool and Die Manufacturing Dashboard in Power BI
📊 5 Interactive Dashboard Pages – Overview, Tool Type, Die Type, Material Type, and Month Analysis.
🎯 Powerful KPI Cards – Track Profit Margin %, Total Cost, Revenue, Labor Cost, and Quality Rating instantly.
💰 Cost vs Revenue Comparison – Detect low-margin categories quickly.
🧩 Dynamic Slicers – Filter by Tool Type, Die Type, Material Type, Industry Segment, Region, and Month.
🛠 Material & Labor Cost Analysis – Monitor cost drivers separately for better control.
📈 Monthly Trend Tracking – Identify seasonal fluctuations and profit patterns.
⚡ Interactive Power BI Visuals – Executive-ready insights with real-time filtering.
📦 What’s Inside the Tool and Die Manufacturing Dashboard in Power BI
This structured Power BI solution includes 5 fully analytical pages:
1️⃣ Overview Page – Complete Operational Snapshot

The command center of your manufacturing analytics.
Includes:
-
5 KPI Cards:
-
Quality Rating by Region
-
Profit Margin %
-
Labor Cost by Material Type
-
Total Cost
-
Revenue by Industry Segment
-
-
Multi-dimensional visuals comparing cost and revenue across categories.
This page provides instant clarity for plant heads and finance teams.
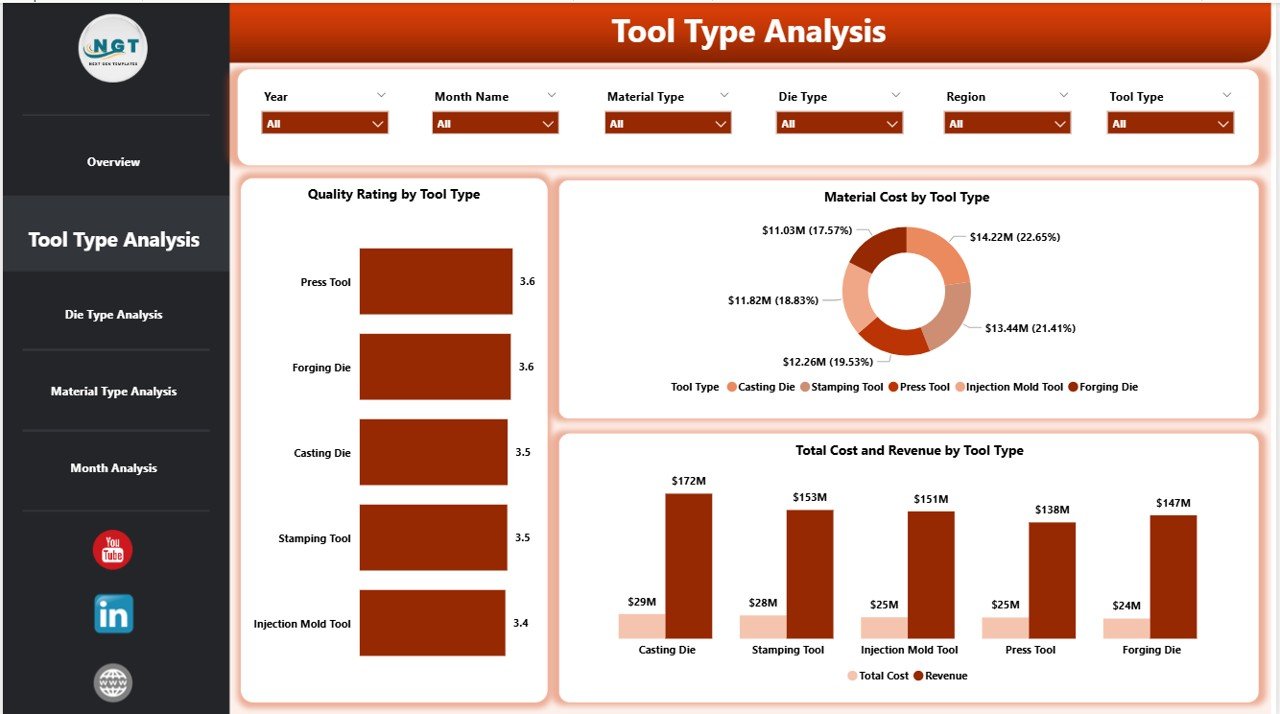
2️⃣ Tool Type Analysis
-
Quality Rating by Tool Type
-
Total Cost & Revenue by Tool Type
-
Material Cost by Tool Type
Quickly identify high-performing tool categories and optimize pricing strategies.
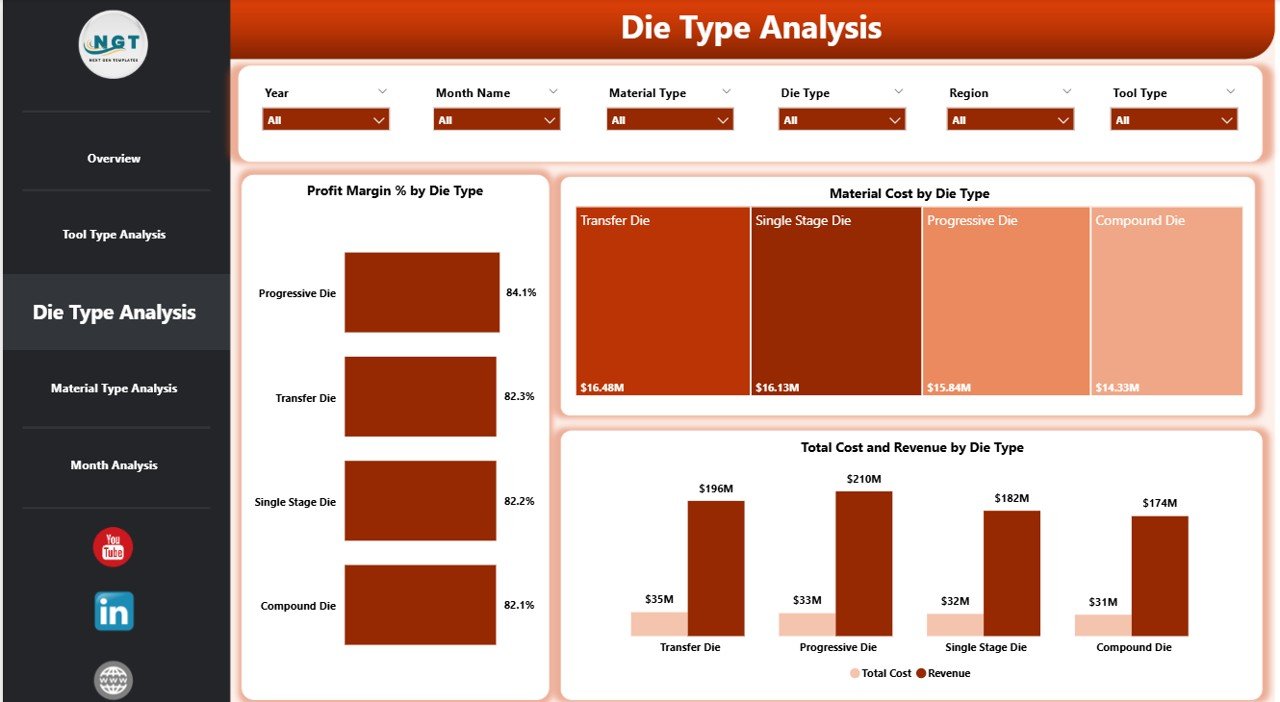
3️⃣ Die Type Analysis
-
Profit Margin % by Die Type
-
Total Cost & Revenue by Die Type
-
Material Cost by Die Type
Analyze complexity-driven cost structures and improve die-level profitability.
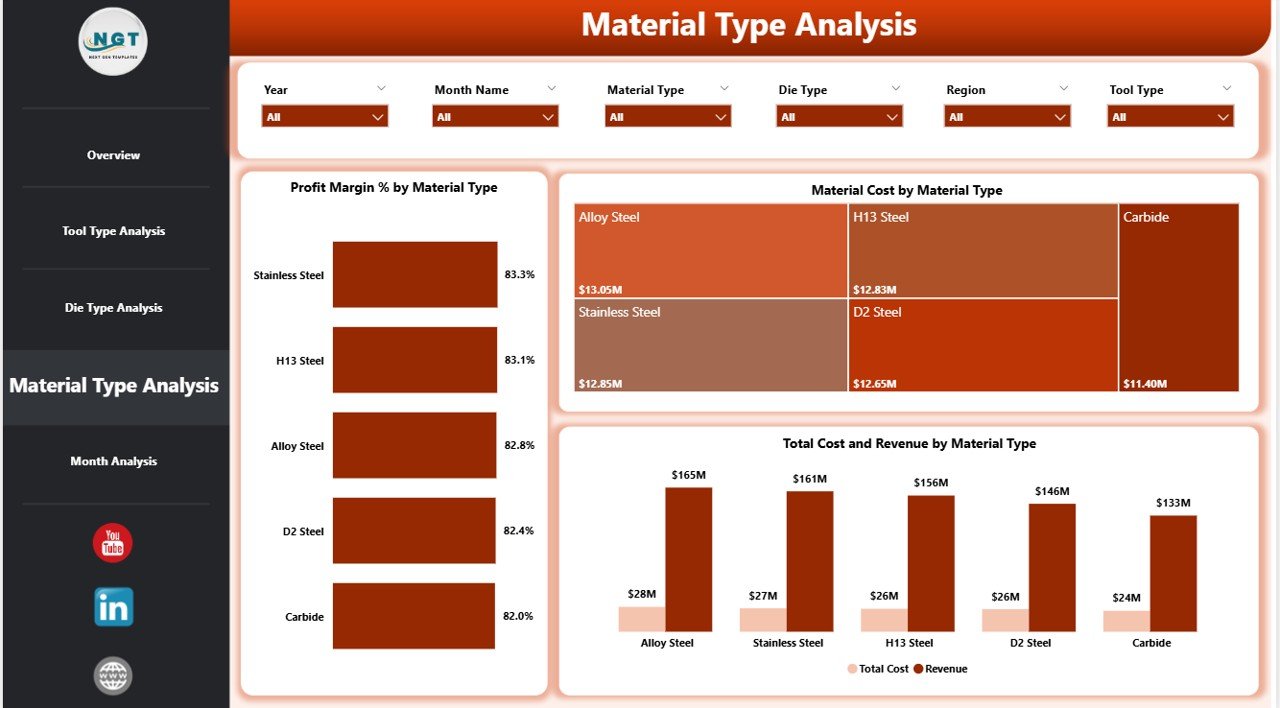
4️⃣ Material Type Analysis
-
Profit Margin % by Material Type
-
Total Cost & Revenue by Material Type
-
Material Cost by Material Type
Control raw material expenses and strengthen supplier negotiations.
5️⃣ Month Analysis
-
Profit by Month
-
Total Cost & Revenue by Month
-
Material Cost by Month
Monitor monthly trends and forecast production performance accurately.
🛠 How to Use the Tool and Die Manufacturing Dashboard in Power BI
Using the dashboard is simple:
1️⃣ Import structured Excel data (Tool Type, Die Type, Material Type, Cost, Revenue, Quality Rating, Month).
2️⃣ Refresh the Power BI file.
3️⃣ Use slicers to filter performance by category.
4️⃣ Analyze KPI cards and charts for insights.
5️⃣ Present executive-ready reports instantly.
Because Power BI handles large datasets efficiently, the dashboard scales with business growth.
👥 Who Can Benefit from This Tool and Die Manufacturing Dashboard in Power BI
✔ Tool Room Managers
✔ Die Manufacturing Units
✔ Plant Heads
✔ Finance Managers
✔ Cost Accountants
✔ Manufacturing Directors
✔ Operations Analysts
Whether you run a small precision unit or a large industrial plant, this dashboard provides structured visibility.
Why This Dashboard Transforms Manufacturing Strategy
Instead of guessing which die type generates profit, you see exact margin percentages.
Instead of reacting to rising material cost, you detect trends early.
Instead of manually preparing reports, you use interactive visuals for leadership meetings.
From tool-level performance to industry-segment revenue — every KPI becomes measurable and actionable.
If you want stronger cost control, improved quality monitoring, and higher profitability, this dashboard becomes your competitive advantage.
Click here to read the Detailed blog post
Visit our YouTube channel to learn step-by-step video tutorials
👉 YouTube Channel – PKAnExcelExpert