Tool and die manufacturing runs on precision. A small cost increase in material or labor can quietly shrink your margins. A drop in quality rating can impact long-term contracts. And delayed reporting can cost you opportunities.
If you are still managing production performance in scattered spreadsheets, you are reacting instead of controlling.
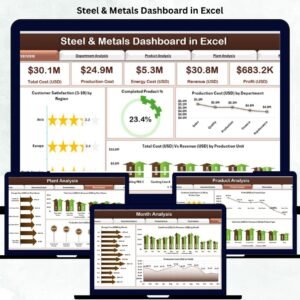
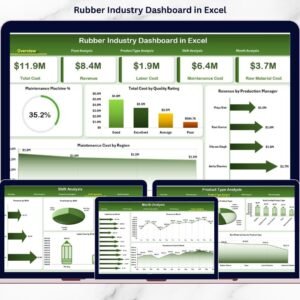
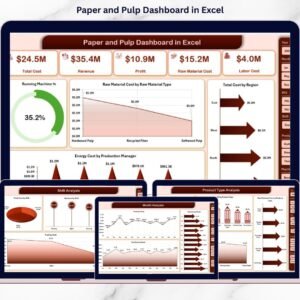
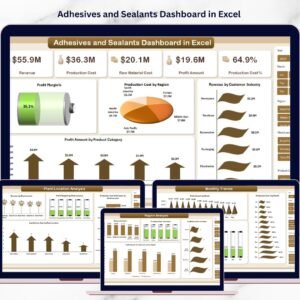
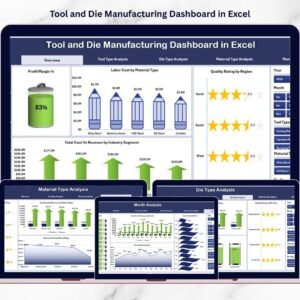
Introducing the Tool and Die Manufacturing Dashboard in Excel — a ready-to-use, interactive reporting system designed specifically for tool rooms, die manufacturers, mold makers, CNC shops, and industrial component units.
This powerful Excel dashboard converts raw production data into dynamic KPI cards, pivot charts, and visual insights — all inside one structured file.
No complex software. No manual consolidation. Just clear, actionable performance visibility.
🚀 Key Feature of Tool and Die Manufacturing Dashboard in Excel
📊 5 Fully Interactive Dashboard Pages – Overview, Tool Type, Die Type, Material Type, and Month Analysis.
💰 Profit Margin % Tracking – Instantly monitor profitability across categories.
🧾 Labor & Material Cost Monitoring – Separate cost tracking for better control.
📈 Total Cost vs Revenue Comparison – Identify profit leaks early.
⭐ Quality Rating Analysis – Track performance by region and product category.
🧩 Dynamic Right-Side Slicers – Filter data by Tool Type, Die Type, Material Type, Region & Industry Segment.
🧭 Page Navigator (Left Panel) – Smooth navigation across analytical pages.
📦 What’s Inside the Tool and Die Manufacturing Dashboard in Excel
This structured Excel file includes:
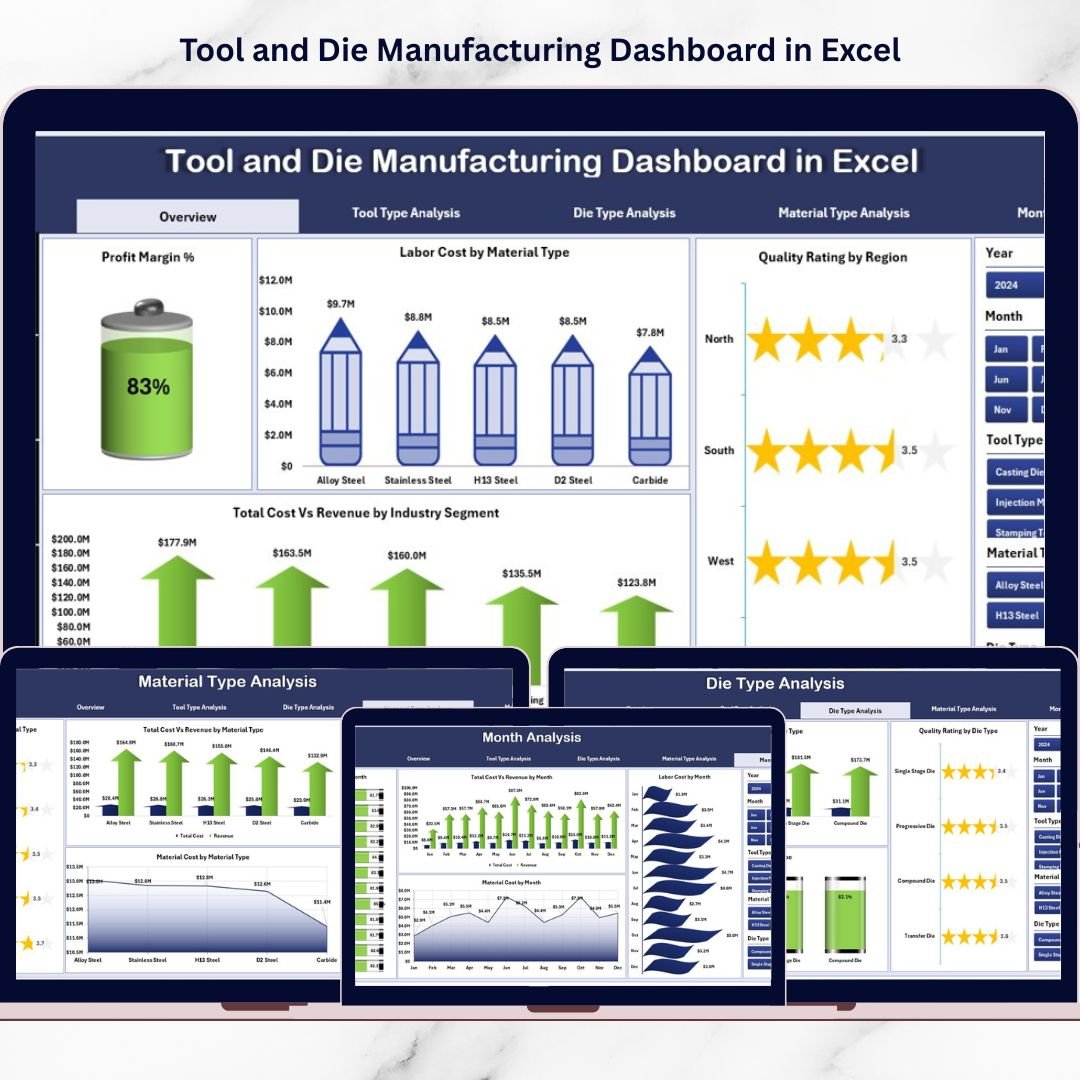
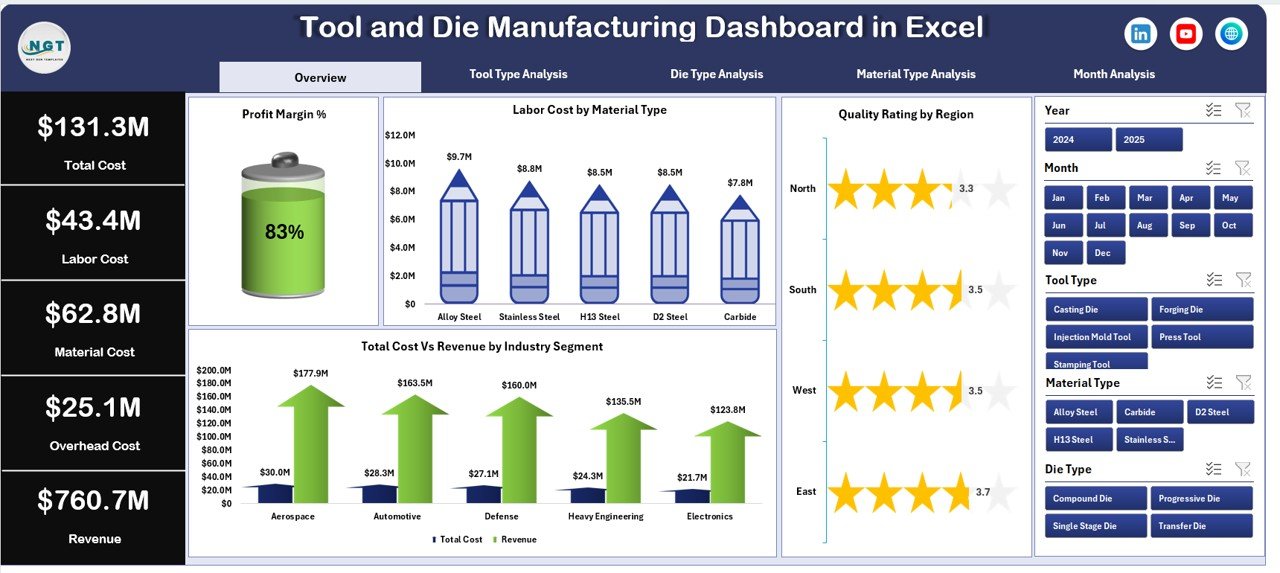
1️⃣ Overview Page – Complete Financial Snapshot
Includes:
-
4 KPI Cards:
-
Profit Margin %
-
Labor Cost
-
Total Cost
-
Revenue
-
-
4 Analytical Charts:
-
Profit Margin %
-
Labor Cost by Material Type
-
Quality Rating by Region
-
Total Cost vs Revenue by Industry Segment
-
This page gives management a quick health check of operations.
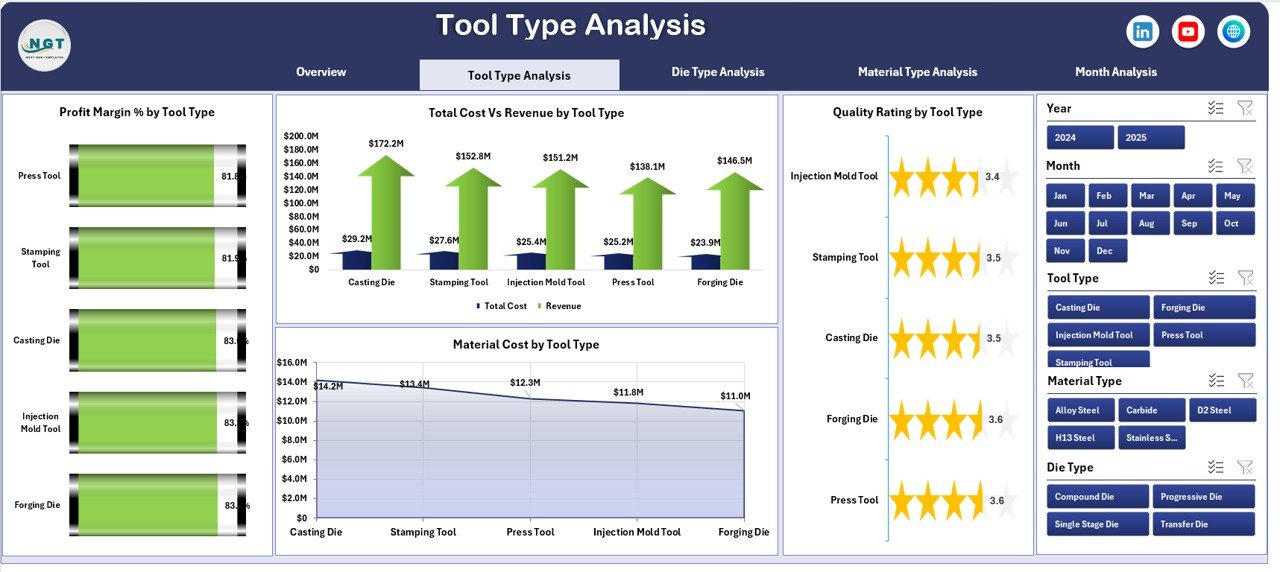
2️⃣ Tool Type Analysis
-
Profit Margin % by Tool Type
-
Quality Rating by Tool Type
-
Total Cost vs Revenue by Tool Type
-
Material Cost by Tool Type
Identify which tool category generates the highest return and which requires cost control.
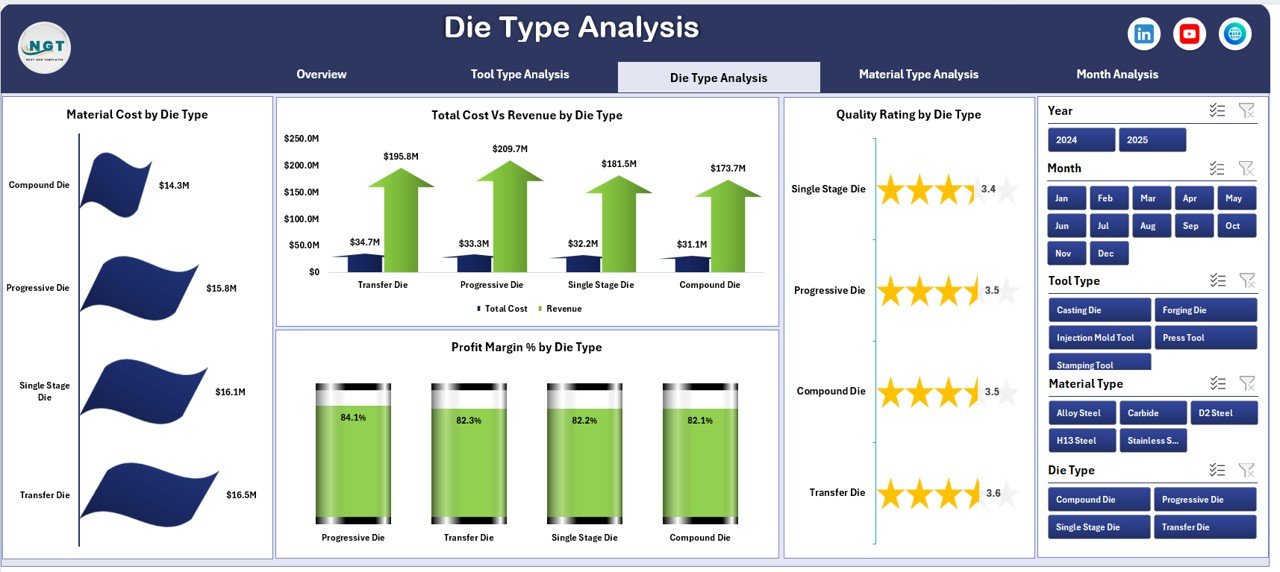
3️⃣ Die Type Analysis
-
Profit Margin % by Die Type
-
Quality Rating by Die Type
-
Total Cost vs Revenue by Die Type
-
Material Cost by Die Type
Compare progressive, compound, and other die types to optimize profitability.
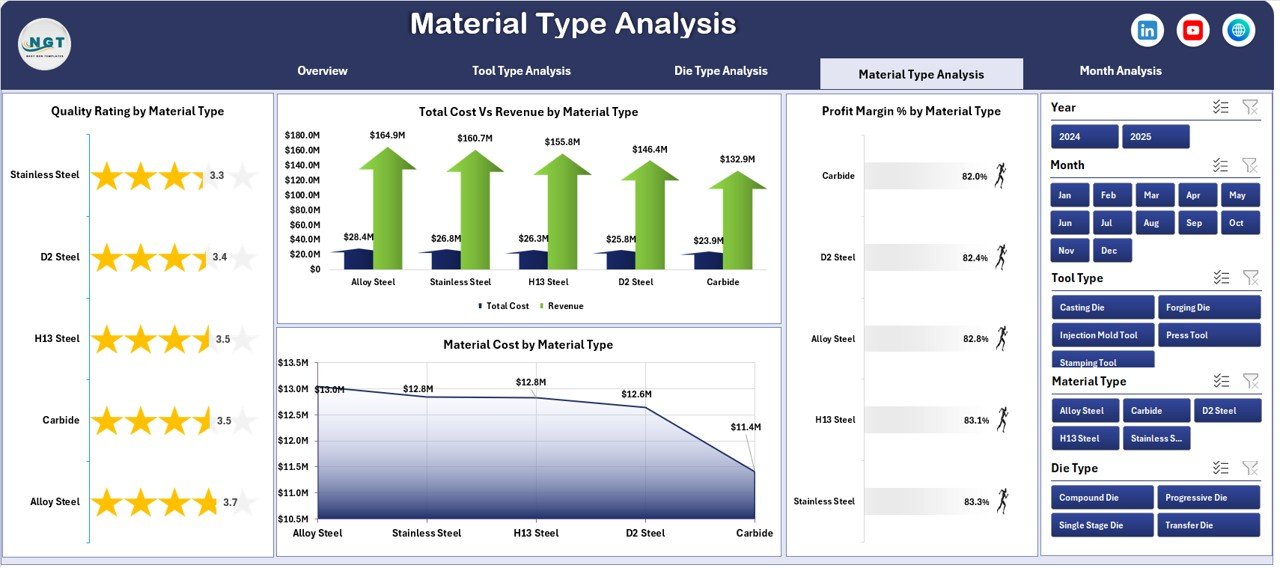
4️⃣ Material Type Analysis
-
Profit Margin % by Material Type
-
Quality Rating by Material Type
-
Total Cost vs Revenue by Material Type
-
Material Cost by Material Type
Control raw material fluctuations and improve supplier negotiations.
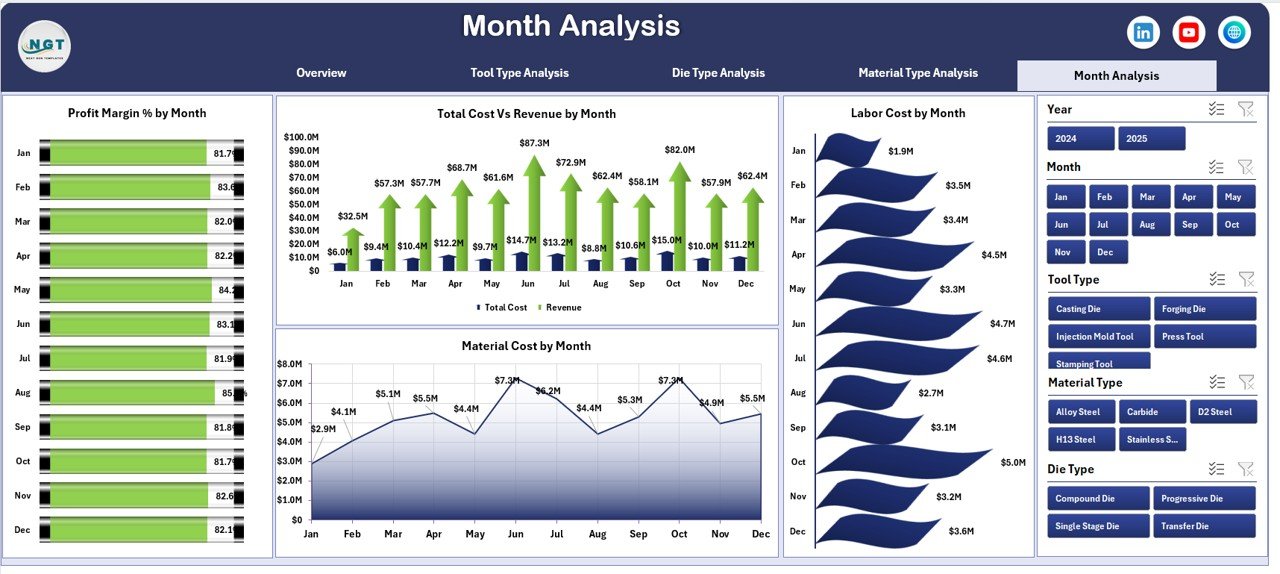
5️⃣ Month Analysis
-
Profit Margin % by Month
-
Total Cost vs Revenue by Month
-
Material Cost by Month
-
Labor Cost by Month
Detect seasonal cost spikes and improve budgeting accuracy.
🛠 How to Use the Tool and Die Manufacturing Dashboard in Excel
Using the dashboard is simple:
1️⃣ Enter structured data in the Data Sheet (Date, Tool Type, Die Type, Material Type, Costs, Revenue, Quality Rating).
2️⃣ Maintain consistent naming conventions.
3️⃣ Refresh pivot tables when required.
4️⃣ Use slicers to filter performance instantly.
5️⃣ Review KPI cards and charts for decision-making.
Because pivot tables power the backend, analysis remains fast and reliable.
👥 Who Can Benefit from This Tool and Die Manufacturing Dashboard in Excel
✔ Tool Manufacturing Units
✔ Die & Mold Manufacturers
✔ CNC Machine Shops
✔ Industrial Component Manufacturers
✔ Production Managers
✔ Finance Managers
✔ Manufacturing Consultants
Whether you operate a small tool room or a multi-line die manufacturing unit, this dashboard gives you structured control.
Why This Dashboard Is a Profit Booster
Instead of manually calculating margin, you see Profit Margin % instantly.
Instead of guessing which material increases cost, you analyze material-level data clearly.
Instead of reacting to declining quality ratings, you track performance proactively.
From tool type profitability to industry segment revenue, every key metric becomes measurable.
If you want better cost control, improved quality tracking, and stronger profitability, this dashboard becomes your operational advantage.
Click here to read the Detailed blog post
Visit our YouTube channel to learn step-by-step video tutorials
👉 YouTube Channel – PKAnExcelExpert