
The Toy Manufacturing KPI Dashboard industry moves fast. Market demand shifts quickly. Seasonal sales spike before festivals and holidays. Production targets change every month. Therefore, toy manufacturers must track performance daily, monthly, and yearly to stay competitive.
However, many factories still rely on scattered spreadsheets. As a result, they miss production delays, overlook quality issues, and struggle to control manufacturing costs.
That is exactly why the Toy Manufacturing KPI Dashboard in Excel becomes a powerful and practical solution 🏭📊.
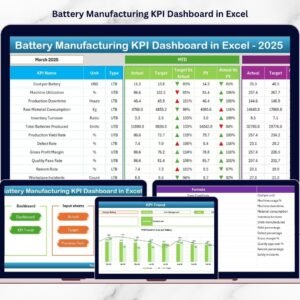
This ready-to-use Excel dashboard transforms raw factory data into structured, visual, and actionable insights. Instead of managing multiple sheets, you get one centralized system to monitor production efficiency, defect rates, inventory turnover, on-time delivery, and financial performance — all in one place.
With built-in MTD (Month-to-Date) and YTD (Year-to-Date) comparisons, along with previous year analysis, this dashboard helps you make faster and smarter operational decisions.
🔑 Key Features of Toy Manufacturing KPI Dashboard in Excel
📅 Dynamic Month Selection (Cell D3)
Select any month and instantly update the entire dashboard.
📊 MTD & YTD Performance Tracking
Monitor monthly and cumulative yearly results clearly.
🎯 Actual vs Target Comparison
Track performance gaps with visual indicators.
📈 Previous Year Comparison
Analyze year-over-year growth and seasonal impact.
🔺 Conditional Formatting Arrows
Up/down indicators highlight positive or negative trends instantly.
📉 Detailed KPI Trend Analysis Page
Visualize Actual vs Target vs Previous Year trends over time.
📂 7 Structured Worksheets
Well-organized sheets for smooth navigation and accurate reporting.
📦 What’s Inside the Toy Manufacturing KPI Dashboard in Excel
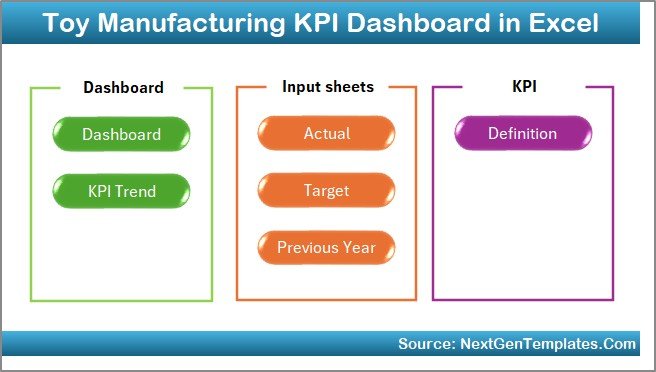
This dashboard includes 7 structured worksheets, each serving a clear purpose.
1️⃣ Home Sheet
• Clean index layout
• 6 interactive navigation buttons
• One-click access to major sheets
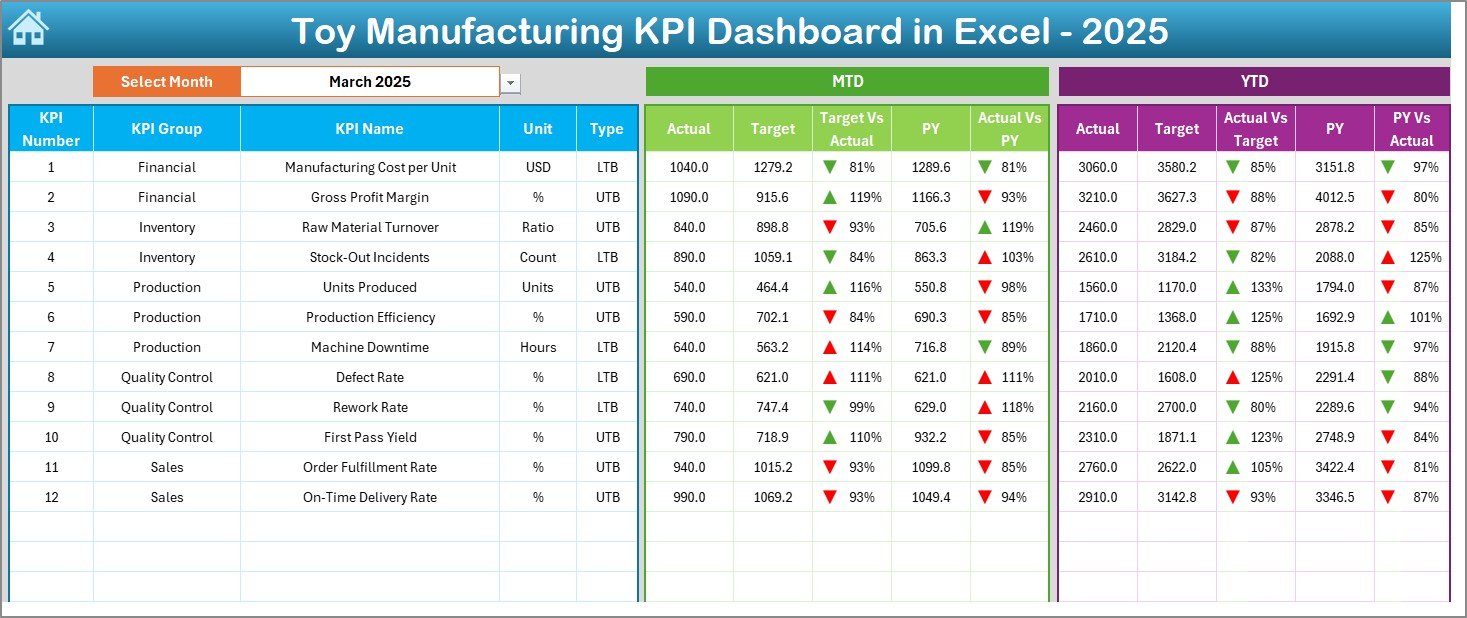
2️⃣ Dashboard Sheet (Main KPI View)
Displays:
• MTD Actual, Target, Previous Year
• YTD Actual, Target, Previous Year
• Target vs Actual comparison
• PY vs Actual comparison
• Conditional up/down arrows
This is the core reporting page for management review.
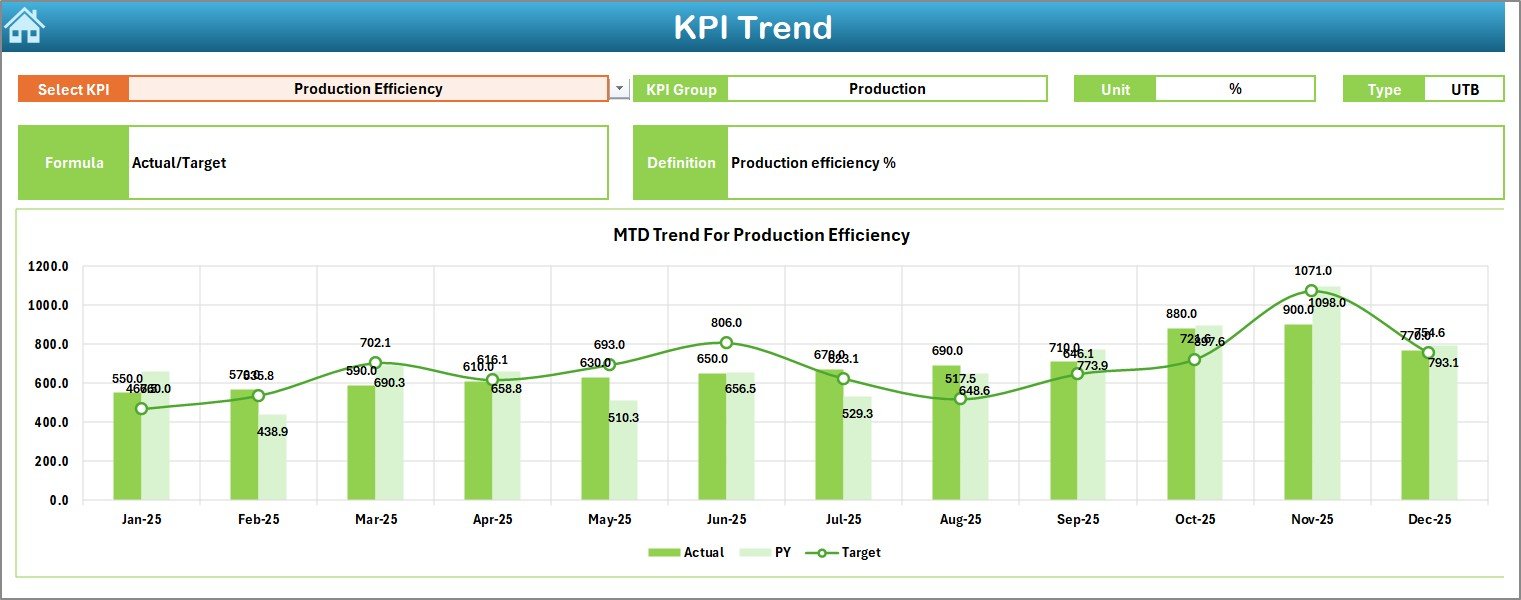
3️⃣ KPI Trend Sheet
Select any KPI from Cell C3 and analyze:
• KPI Group
• Unit
• KPI Type (Lower is Better / Higher is Better)
• Formula & Definition
• MTD Trend Chart
• YTD Trend Chart
Perfect for analyzing production movement over time.
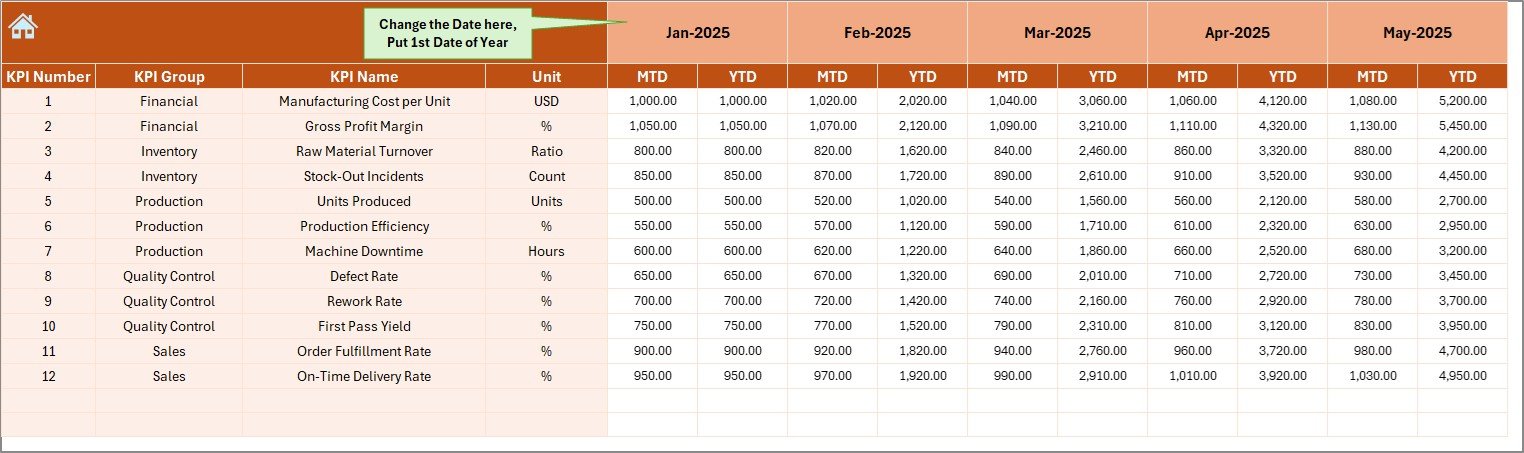
4️⃣ Actual Numbers Input Sheet
• Enter real performance data
• Change first month in Cell E1
• Input MTD & YTD values
• Dashboard updates automatically
5️⃣ Target Sheet
• Enter monthly MTD & YTD targets
• Compare planned vs actual performance easily
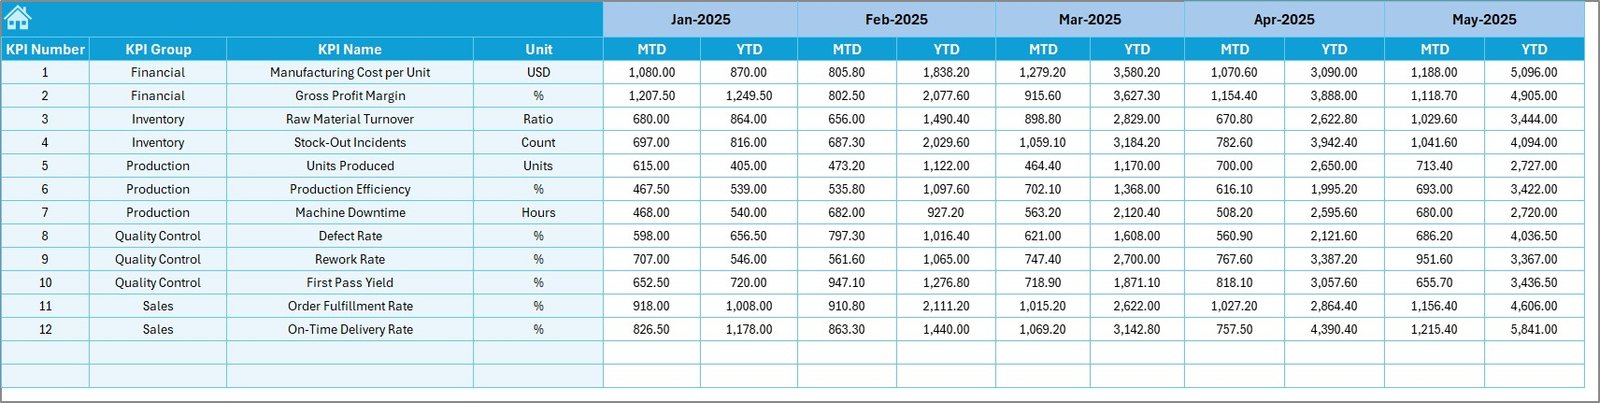
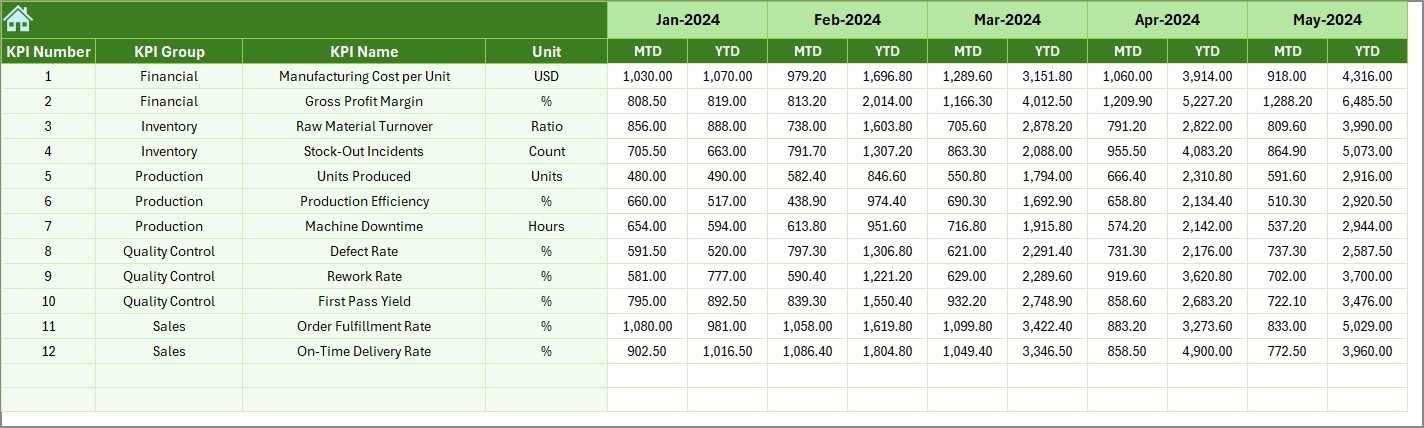
6️⃣ Previous Year Numbers Sheet
• Store last year’s performance data
• Enable year-over-year comparison
• Identify growth trends instantly
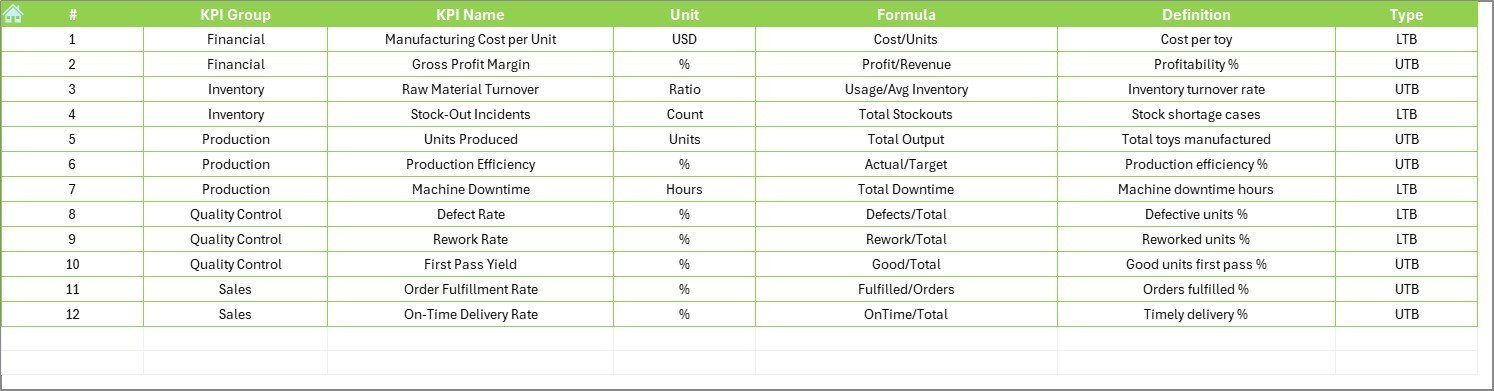
7️⃣ KPI Definition Sheet
Define:
• KPI Name
• KPI Group
• Unit
• Formula
• Definition
Ensures clarity and consistency across teams.
🛠️ How to Use the Toy Manufacturing KPI Dashboard in Excel
1️⃣ Enter KPI definitions
2️⃣ Set monthly targets
3️⃣ Input previous year numbers
4️⃣ Enter actual production data
5️⃣ Select month from Dashboard (Cell D3)
6️⃣ Review MTD & YTD performance
7️⃣ Take corrective actions
Within minutes, your production data becomes strategic insight.
👥 Who Can Benefit from This Toy Manufacturing KPI Dashboard in Excel
🏭 Toy Manufacturing Companies
📦 Production Managers
🔍 Quality Control Teams
📊 Operations Heads
💰 Finance Teams
🚚 Supply Chain Managers
If you manage production, quality, inventory, or delivery, this dashboard simplifies performance tracking.
Click here to read the Detailed blog post
Visit our YouTube channel to learn step-by-step video tutorials
Watch the step-by-step video tutorial:
Compatibility and Requirements
- Works in Microsoft Excel desktop (Excel 2016 or later, or Microsoft 365).
- Trend arrows on the Dashboard sheet come from conditional formatting. Microsoft explains it in Use conditional formatting to highlight information in Excel.
Frequently Asked Questions
How many worksheets does the dashboard have?
Seven: Home, Dashboard, KPI Trend, Actual Numbers, Target, Previous Year Numbers and KPI Definition.
How do I switch the month?
Select the month in cell D3 on the Dashboard sheet. The MTD and YTD figures update for that month.
Where do I enter my production data?
Type your MTD and YTD actuals in the Actual Numbers sheet. Targets go in the Target sheet and last year’s figures go in the Previous Year Numbers sheet.
Can I look at the trend of one KPI?
Yes. Pick a KPI in cell C3 on the KPI Trend sheet. It shows the KPI group, unit, type (Lower is Better or Higher is Better), formula, definition and MTD and YTD trend charts.
Is there a Power BI version?
Yes. See the Toy Manufacturing KPI Dashboard in Power BI.
Related Manufacturing Templates
- Toy Manufacturing KPI Dashboard in Power BI: the same toy factory KPIs in Power BI
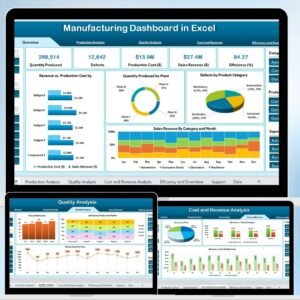
- Manufacturing KPI Dashboard in Excel: a general factory KPI view in Excel
- Manufacturing KPI Scorecard in Excel: a scorecard layout for manufacturing metrics
- Manufacturing Quality Assurance KPI Dashboard in Excel: focused on quality measures
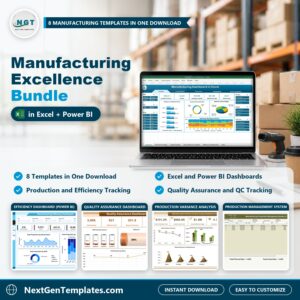
- Manufacturing Excellence Bundle: 8 manufacturing templates in one download
Browse all Excel KPI dashboards and Excel manufacturing templates.