Pilgrimage Tourism KPI Dashboard is expanding rapidly across the world. Every year, millions of devotees visit sacred destinations for faith, culture, and spiritual connection. However, managing such large visitor volumes requires strong planning, real-time monitoring, and structured decision-making. When authorities depend on manual reports and scattered Excel sheets, they struggle with overcrowding, revenue leakage, service delays, and operational inefficiencies.
That is exactly where the Pilgrimage Tourism KPI Dashboard in Power BI becomes essential 🛕📊.
This ready-to-use, interactive Power BI dashboard transforms raw tourism data into clear visual insights. It helps temple trusts, tourism boards, and shrine authorities monitor visitor trends, donation performance, service quality, and operational efficiency—all from one centralized platform. Instead of reacting late, leaders gain instant clarity and act proactively.
🔑 Key Features of Pilgrimage Tourism KPI Dashboard in Power BI
📊 Centralized KPI Monitoring
Track all pilgrimage tourism KPIs in one interactive dashboard.
📆 MTD & YTD Performance Tracking
Monitor Month-to-Date and Year-to-Date performance with dynamic visuals.
🎯 Target vs Actual Comparison
Instantly see whether KPIs meet or miss targets using smart indicators.
📈 Current Year vs Previous Year Analysis
Identify growth trends and seasonal patterns through automated comparisons.
🚦 Visual Performance Indicators
Green ▲ and red ▼ icons highlight performance gaps immediately.
🔄 Excel-Based Data Integration
Simply update Excel sheets and refresh Power BI to see updated insights.
📦 What’s Inside the Pilgrimage Tourism KPI Dashboard in Power BI
This Power BI solution includes three powerful analytical pages, each designed to provide clarity and control.
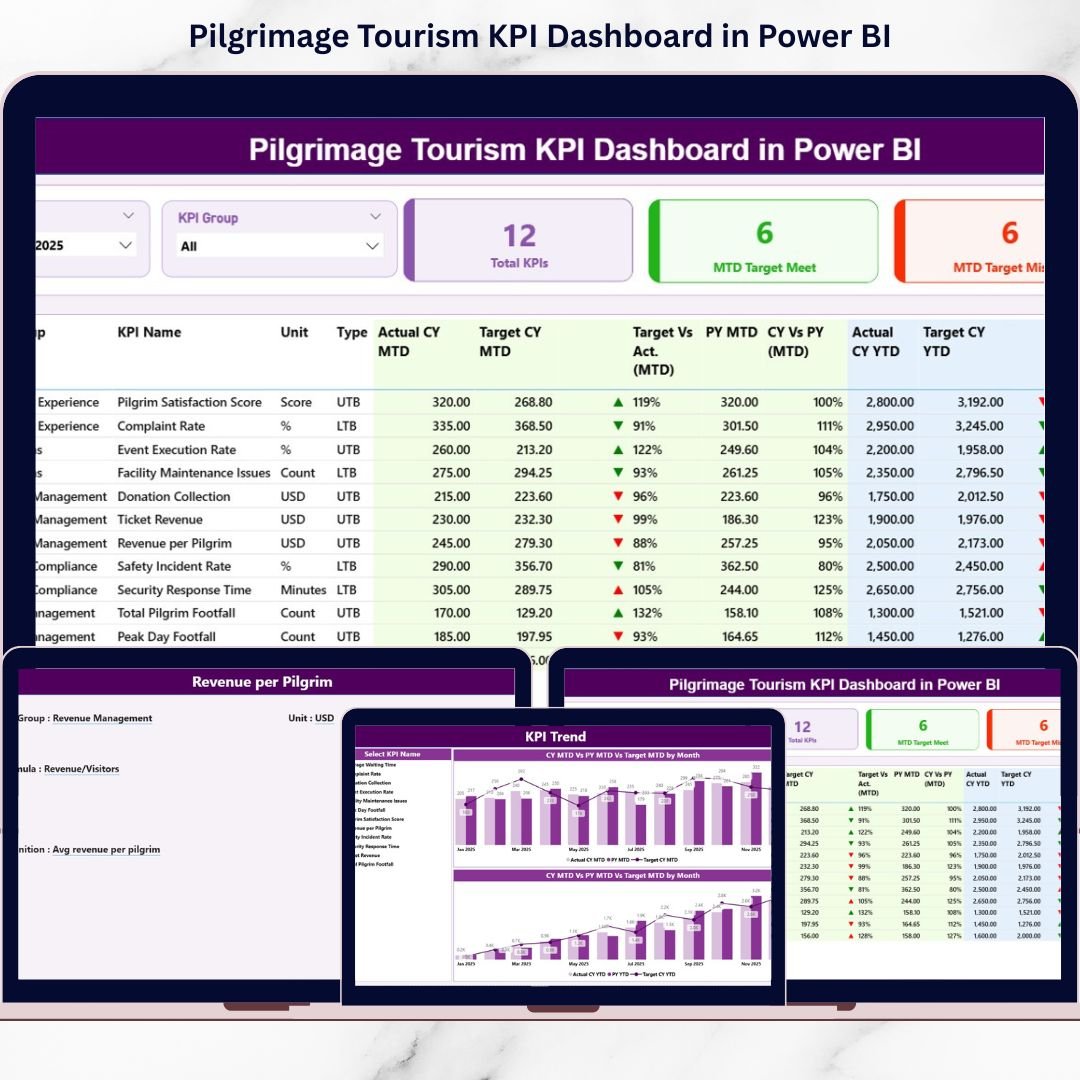
📌 Summary Page – Performance Control Center
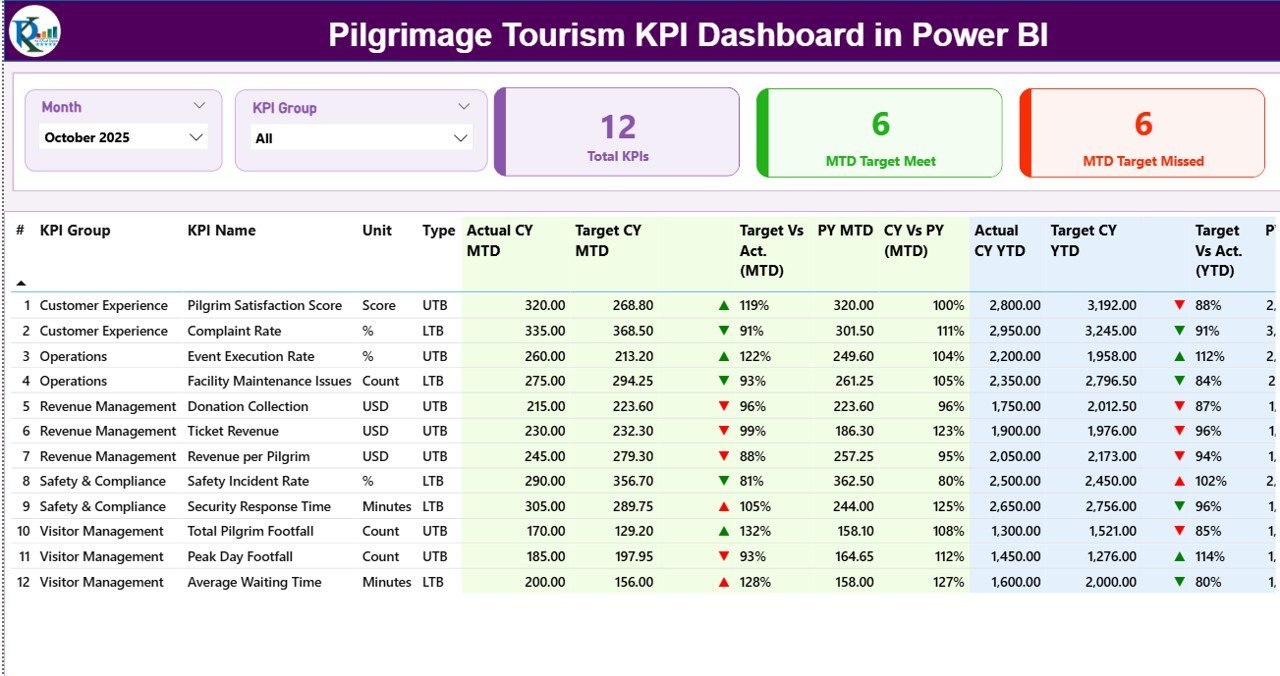
The main dashboard page includes:
• Month slicer
• KPI Group slicer
• Three KPI cards (Total KPIs, MTD Target Met, MTD Target Missed)
• Detailed KPI table with MTD and YTD analysis
For each KPI, you can view:
✅ Actual CY MTD
✅ Target CY MTD
✅ PY MTD
✅ Target vs Actual %
✅ CY vs PY %
✅ MTD status icon
Similarly, YTD metrics show full-year performance comparisons.
Because visuals and percentages appear together, decision-makers instantly understand performance.
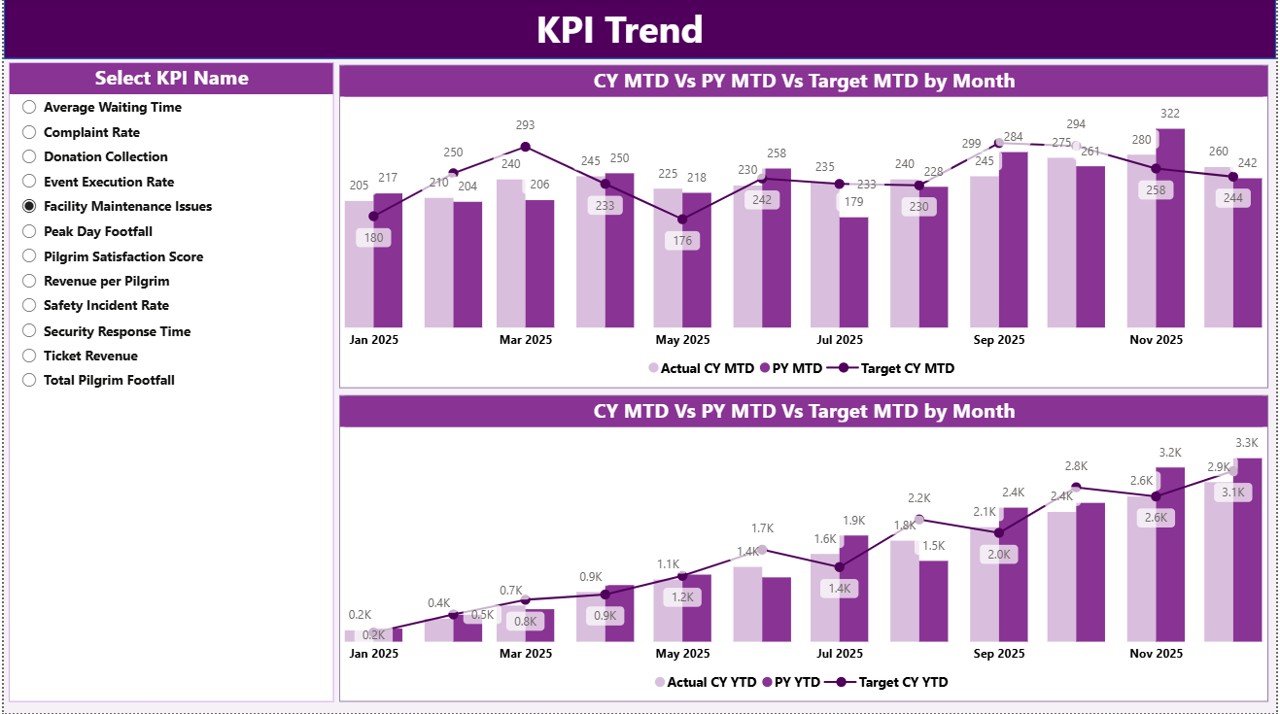
📉 KPI Trend Page – Performance Movement Analysis
This page focuses on trend visualization.
Features include:
• Two combo charts (MTD & YTD trends)
• Current Year vs Previous Year comparison
• Target tracking
• KPI Name slicer
When you select a KPI, the trend updates automatically. Therefore, planners can detect seasonal visitor growth, donation fluctuations, festival peaks, and infrastructure demand changes easily.
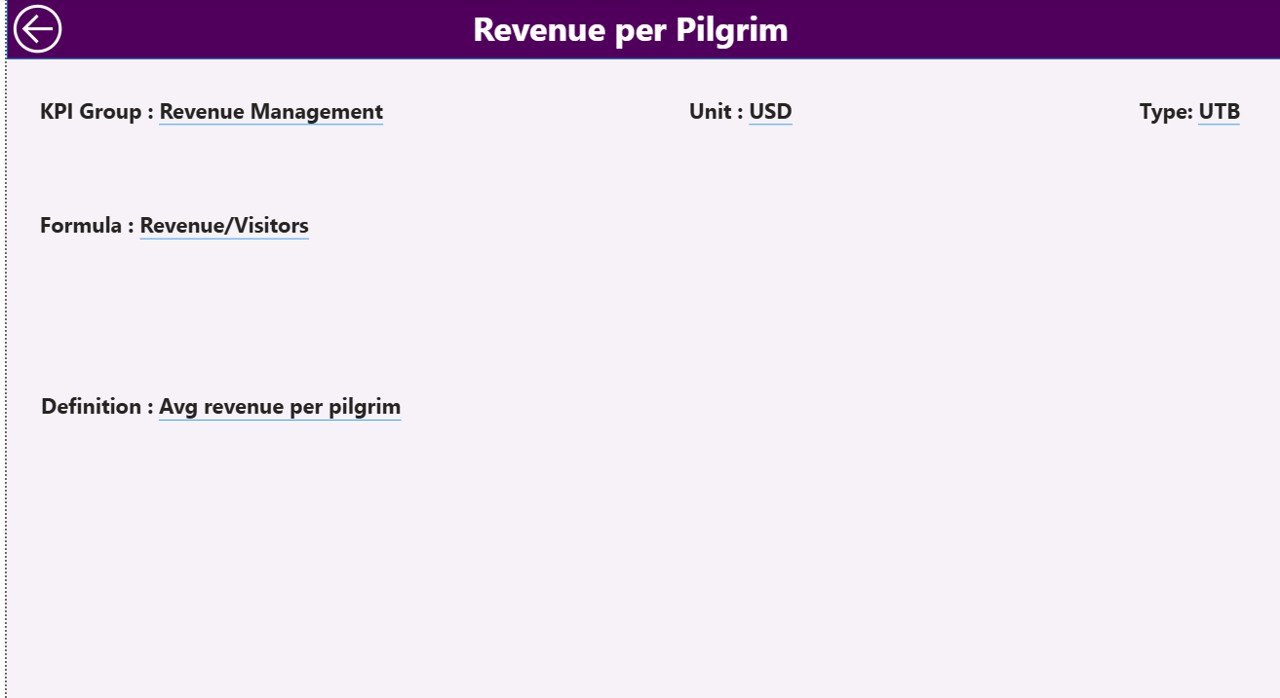
📘 KPI Definition Page – Documentation & Transparency
This drill-through page displays:
• KPI Formula
• KPI Definition
• KPI Group
• KPI Type (LTB / UTB)
Because KPI documentation ensures transparency, teams clearly understand how performance is measured.
🛠️ How to Use the Pilgrimage Tourism KPI Dashboard in Power BI
Implementation is simple:
1️⃣ Define KPIs in the KPI Definition sheet
2️⃣ Enter actual data in the Input_Actual sheet
3️⃣ Enter targets in the Input_Target sheet
4️⃣ Connect Excel to Power BI
5️⃣ Refresh the dashboard
6️⃣ Use slicers to filter by month or KPI group
7️⃣ Analyze performance and take corrective actions
Within minutes, raw pilgrimage data becomes actionable intelligence.
👥 Who Can Benefit from This Pilgrimage Tourism KPI Dashboard in Power BI
🛕 Temple Trust Boards
🏛️ Religious Tourism Departments
🧳 Pilgrimage Event Organizers
🏢 Government Tourism Authorities
📊 Shrine Management Committees
💰 Finance & Operations Teams
Whether you manage one shrine or multiple destinations, this dashboard provides structured visibility and control.


