The cruise industry operates in a highly dynamic and performance-driven environment 🚢. Passenger demand fluctuates by season, fuel and operational costs remain high, and service quality directly impacts customer satisfaction and brand reputation. Therefore, cruise line executives and operations teams must monitor performance continuously. Cruise Lines KPI Dashboard in Power BI However, when teams rely on static Excel reports and manual reviews, insights arrive late and decision-making becomes reactive.
That is exactly where a Cruise Lines KPI Dashboard in Power BI delivers immense value.
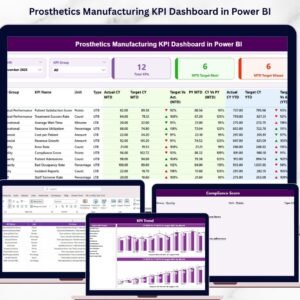
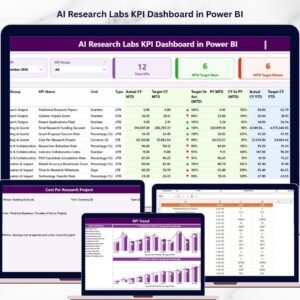
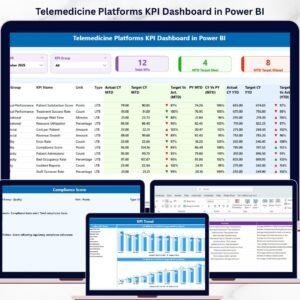
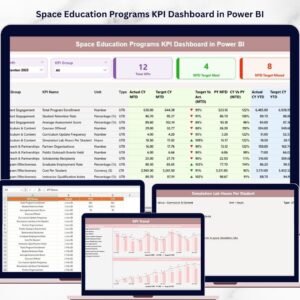
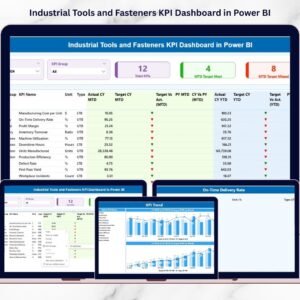
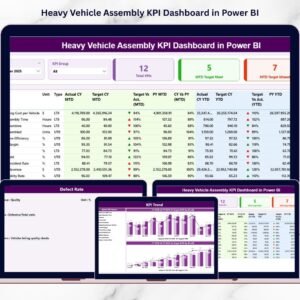
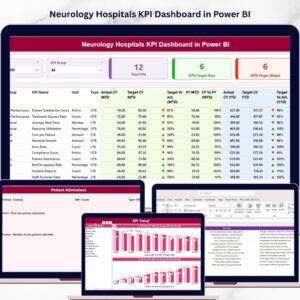
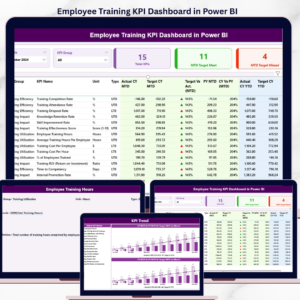
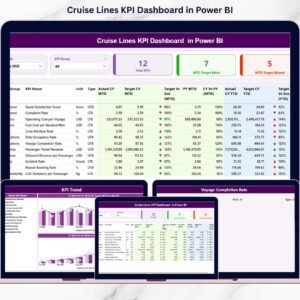
Cruise Lines KPI Dashboard in Power BI The Cruise Lines KPI Dashboard in Power BI is a ready-to-use, interactive analytics solution designed specifically to track and analyze key performance indicators for cruise line operations. Instead of reviewing multiple disconnected reports, cruise companies can monitor Month-to-Date (MTD) and Year-to-Date (YTD) performance, compare Actual vs Target vs Previous Year values, and analyze trends using dynamic visuals 📊.
Because the dashboard runs in Microsoft Power BI, it transforms Excel-based data into real-time, executive-ready insights with minimal effort. As a result, cruise organizations move from delayed reporting to proactive, data-driven decision-making.
✅ Key Features of Cruise Lines KPI Dashboard in Power BI
The Cruise Lines KPI Dashboard in Power BI is built to provide instant clarity across operational, financial, and service KPIs 🔍.
It combines structured Excel data with Power BI visuals, slicers, and drill-through capabilities to deliver a complete performance view.
Key highlights include:
MTD and YTD KPI tracking
Actual vs Target vs Previous Year comparison
Target Met and Target Missed indicators
Interactive month and KPI group slicers
KPI-level trend analysis using combo charts
Drill-through to KPI definitions
Because all visuals update dynamically, leadership teams save time and focus on insights instead of manual reporting.
📦 What’s Inside the Cruise Lines KPI Dashboard in Power BI
This Power BI solution includes three professionally designed pages, supported by a structured Excel data source
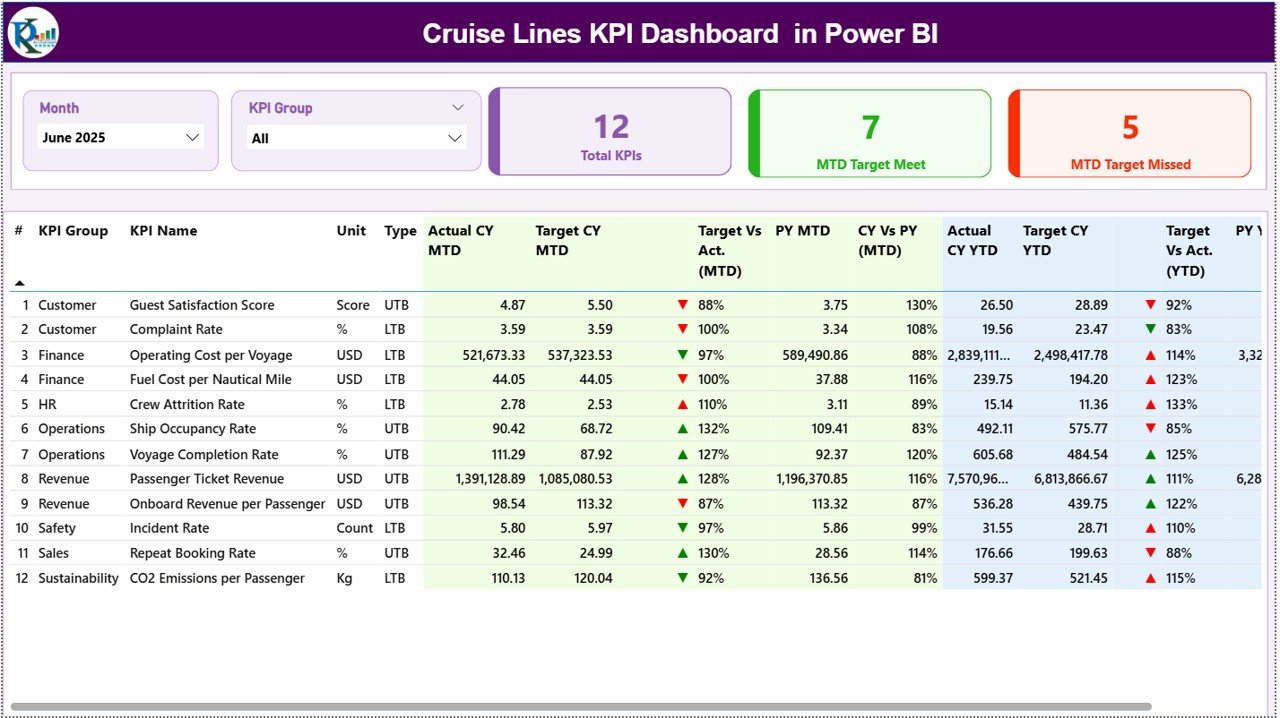
1️⃣ Summary Page
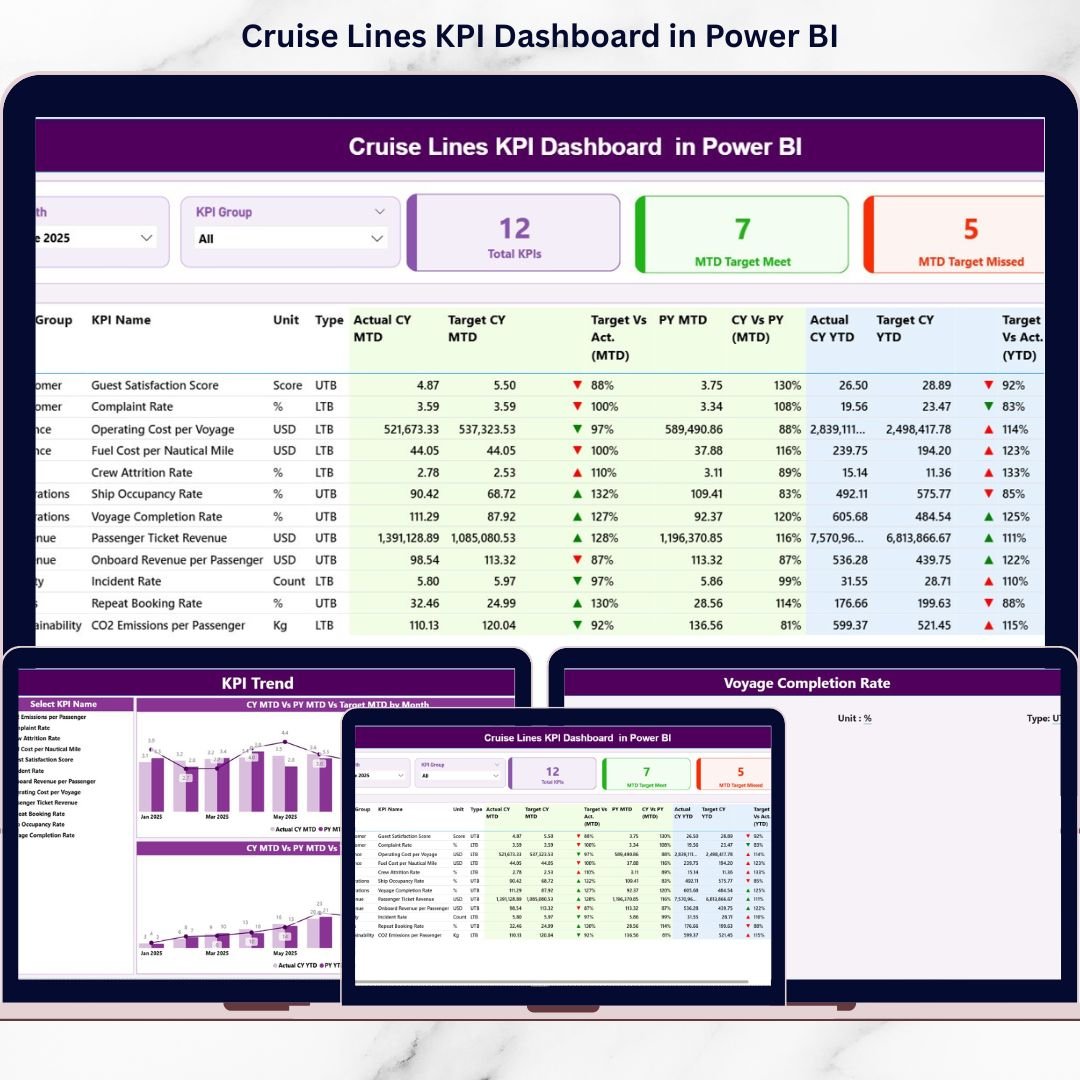
The Summary Page acts as the main landing page 🧭.
Filters Available
Month slicer
KPI Group slicer
Once selected, the entire dashboard updates instantly.
KPI Cards Displayed
Total KPIs Count
MTD Target Met Count
MTD Target Missed Count
These cards provide an immediate performance snapshot.
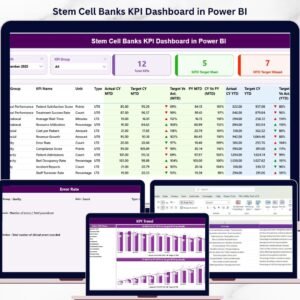
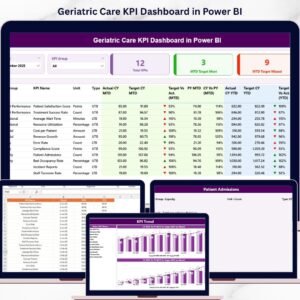
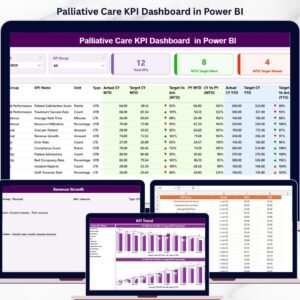
Detailed KPI Table
The table displays:
KPI Number
KPI Group
KPI Name
Unit
KPI Type (LTB / UTB)
MTD Performance Columns
Actual CY MTD
Target CY MTD
MTD Icon (▲ / ▼ with green or red color)
Target vs Actual (MTD %)
PY MTD
CY vs PY (MTD %)
YTD Performance Columns
Actual CY YTD
Target CY YTD
YTD Icon (▲ / ▼)
Target vs Actual (YTD %)
PY YTD
CY vs PY (YTD %)
This structure allows users to analyze short-term and long-term performance in one view.
2️⃣ KPI Trend Page
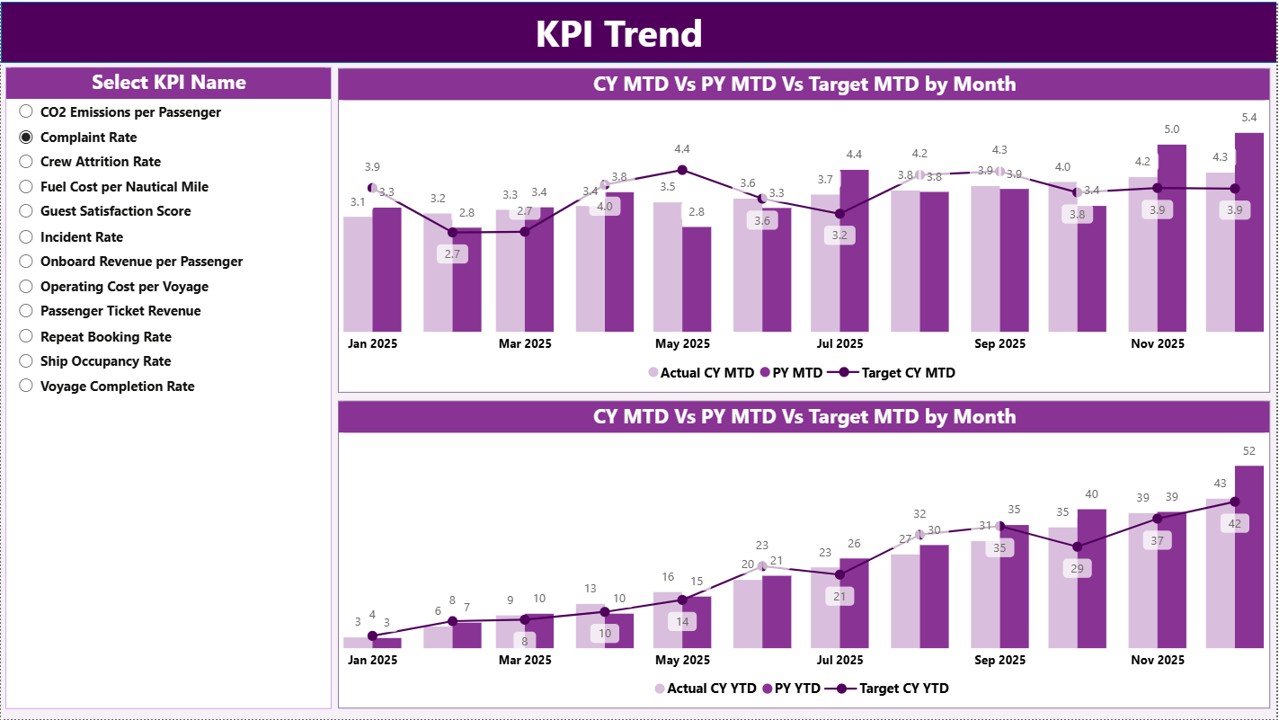
The KPI Trend Page focuses on deep trend analysis 📈.
How It Works
KPI Name slicer on the left
Selection instantly updates all visuals
Charts Included
MTD Trend Chart (Actual, Target, Previous Year)
YTD Trend Chart (Actual, Target, Previous Year)
These charts help cruise teams identify seasonality, improvement patterns, and performance gaps early.
3️⃣ KPI Definition Page (Drill-Through)
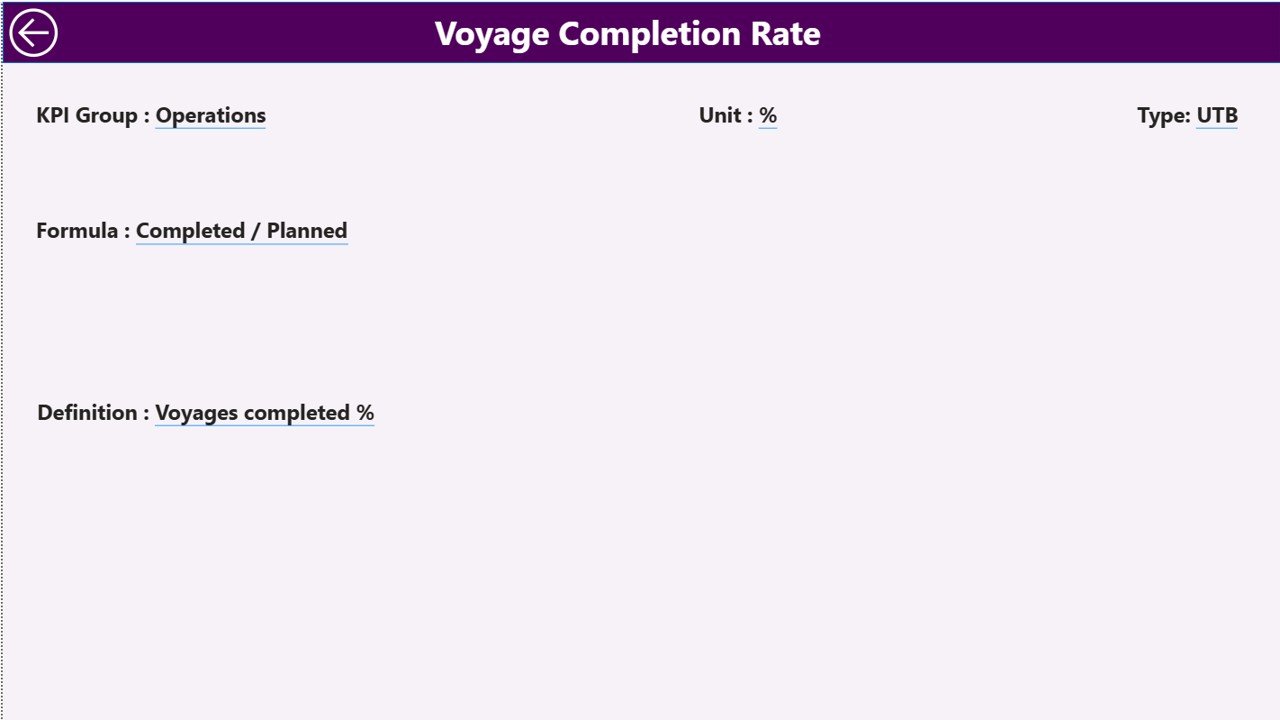
The KPI Definition Page is a hidden drill-through page.
Information Displayed
KPI Formula
KPI Definition
KPI Unit
KPI Type
How to Access
Right-click any KPI on the Summary Page
Select Drill Through
View detailed KPI logic
Use the Back button to return
This feature keeps the dashboard self-explanatory and audit ready.
🛠️ How to Use the Cruise Lines KPI Dashboard in Power BI
Using the dashboard is simple and intuitive 👍.
First, update actuals, targets, and previous year data in the connected Excel file.
Next, refresh the Power BI dashboard.
Then, select the required month and KPI group using slicers.
Finally, review KPI status, trends, and drill into definitions when needed.
Because Power BI handles all calculations and visuals, insights remain accurate and up to date.
👥 Who Can Benefit from This Cruise Lines KPI Dashboard
This dashboard is ideal for:
Cruise Line Executives
Operations Managers
Finance and Revenue Teams
Fleet and Operations Analysts
Strategy and Planning Teams
It supports both small cruise operators and large cruise enterprises.
🔗 Click here to read the Detailed blog post
🎥 Visit our YouTube channel to learn step-by-step video tutorials
👉 https://www.youtube.com/@PKAnExcelExpert