Cyber threats are increasing every year. Organizations now face ransomware attacks, data breaches, system vulnerabilities, phishing incidents, and compliance risks on a daily basis. Because of this, cyber risk management can no longer depend on manual reports, static Excel sheets, or delayed MIS updates.
That is exactly where the Cyber Risk Management KPI Dashboard in Power BI becomes a game-changing solution.
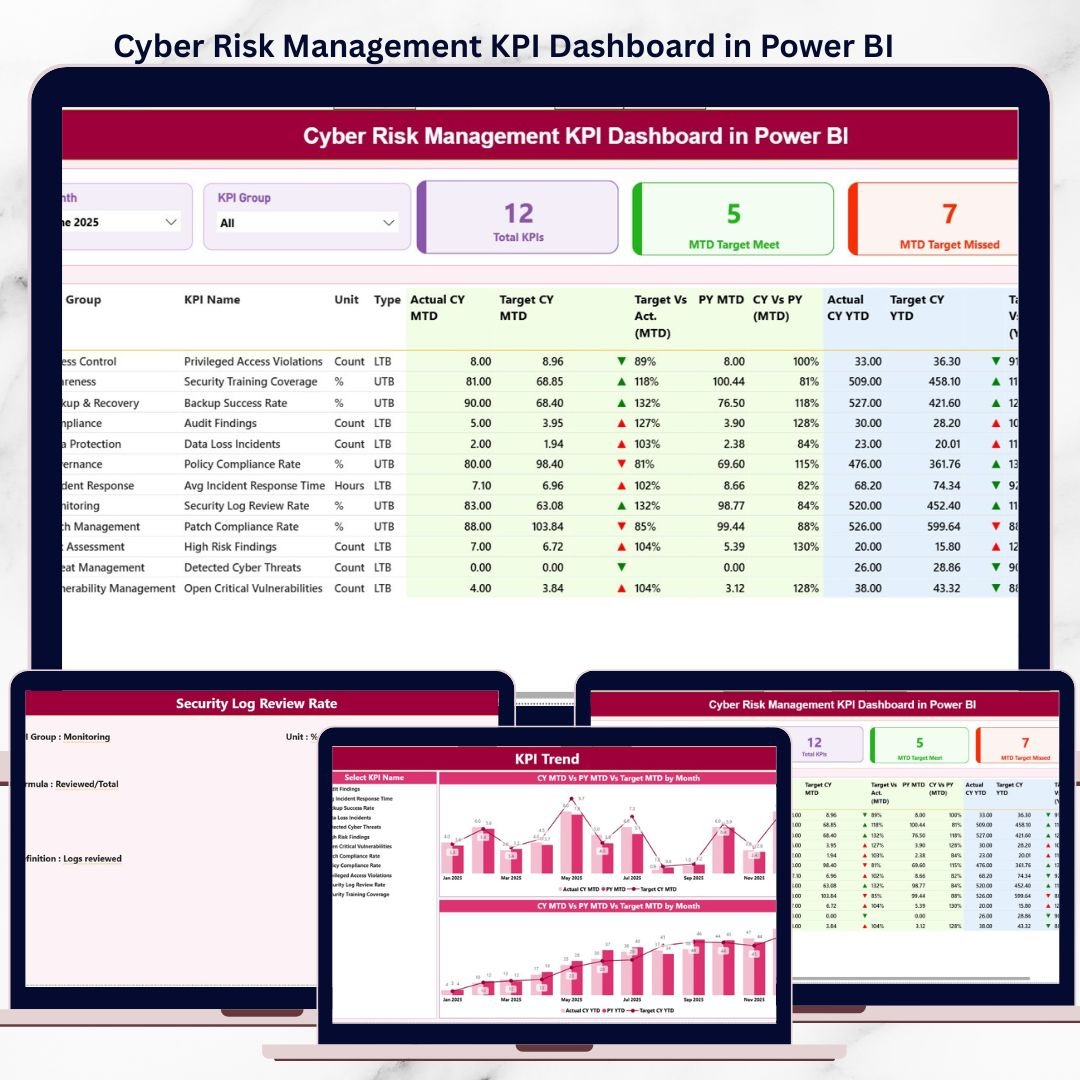
This ready-to-use Power BI dashboard transforms raw cyber risk data into clear, visual, and actionable insights. Instead of reacting after incidents occur, organizations gain real-time visibility into cyber risk performance, control effectiveness, and risk trends. As a result, decision-makers act faster, reduce exposure, and improve cyber security maturity.
Designed for simplicity, clarity, and governance, this dashboard helps organizations move from reactive cyber reporting to proactive cyber risk management—without complex tools or heavy implementation effort.
✅ Key Features of Cyber Risk Management KPI Dashboard in Power BI
-
🛡️ Centralized Cyber Risk Monitoring – Track all cyber risk KPIs in one interactive dashboard
-
🎯 Actual vs Target Comparison – Instantly identify control gaps and missed thresholds
-
📅 MTD & YTD Performance Tracking – Monitor short-term and long-term cyber risk trends
-
⬆️⬇️ Visual KPI Status Icons – Green ▲ and Red ▼ indicators for quick interpretation
-
📈 Trend Analysis Charts – Analyze risk movement over time
-
🔍 Drill-Through KPI Definitions – Maintain clarity and consistency across teams
-
⚙️ Excel-Based Data Source – Easy updates without complex systems
📦 What’s Inside the Cyber Risk Management KPI Dashboard in Power BI
This Power BI dashboard includes three professionally designed pages, supported by a structured Excel data model.
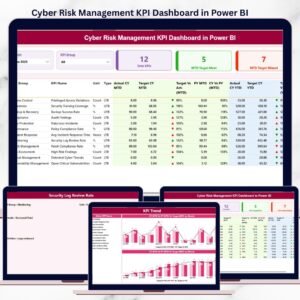
📊 Summary Page – Cyber Risk Performance Overview
The Summary Page acts as the main control panel of the dashboard.
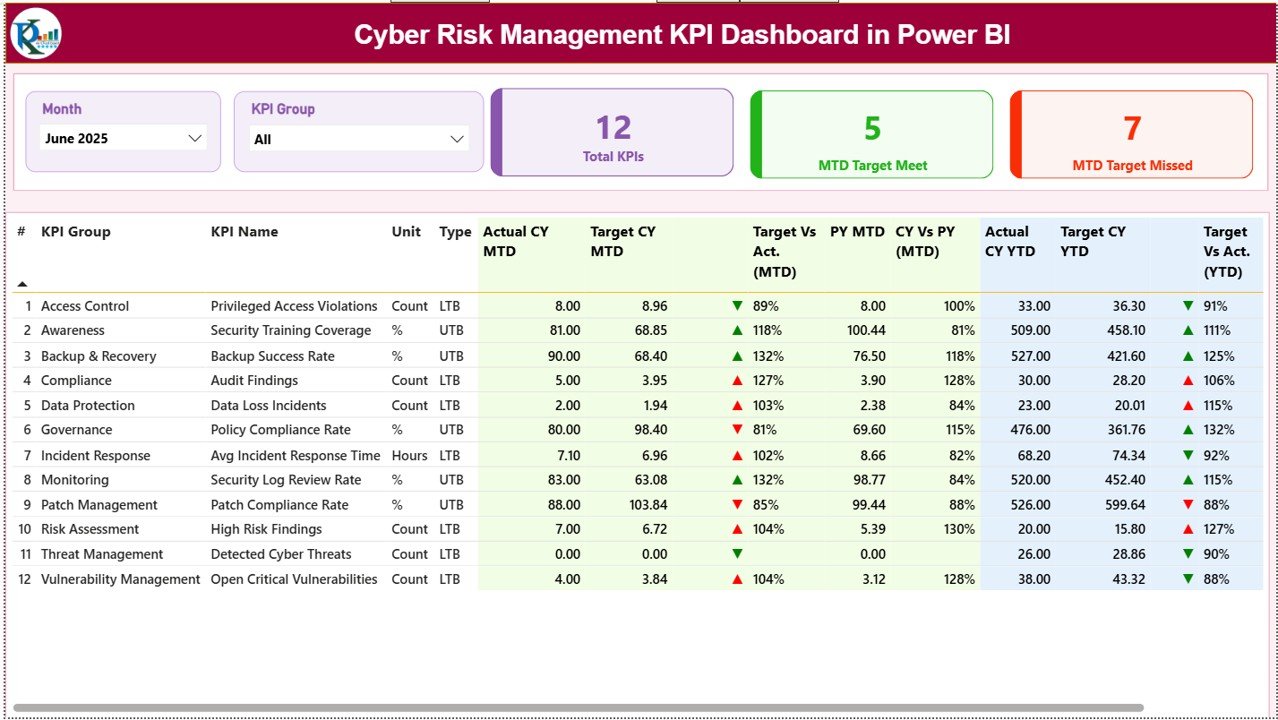
It includes:
-
Month slicer
-
KPI Group slicer
-
KPI cards showing:
-
Total KPIs Count
-
MTD Target Met Count
-
MTD Target Missed Count
-
Below the cards, a detailed KPI table displays:
-
KPI Number
-
KPI Group
-
KPI Name
-
Unit
-
Type (LTB / UTB)
-
Actual vs Target (MTD & YTD)
-
Previous Year comparison
-
Performance icons and percentage variance
This layout allows leadership teams to identify cyber risk deviations instantly.
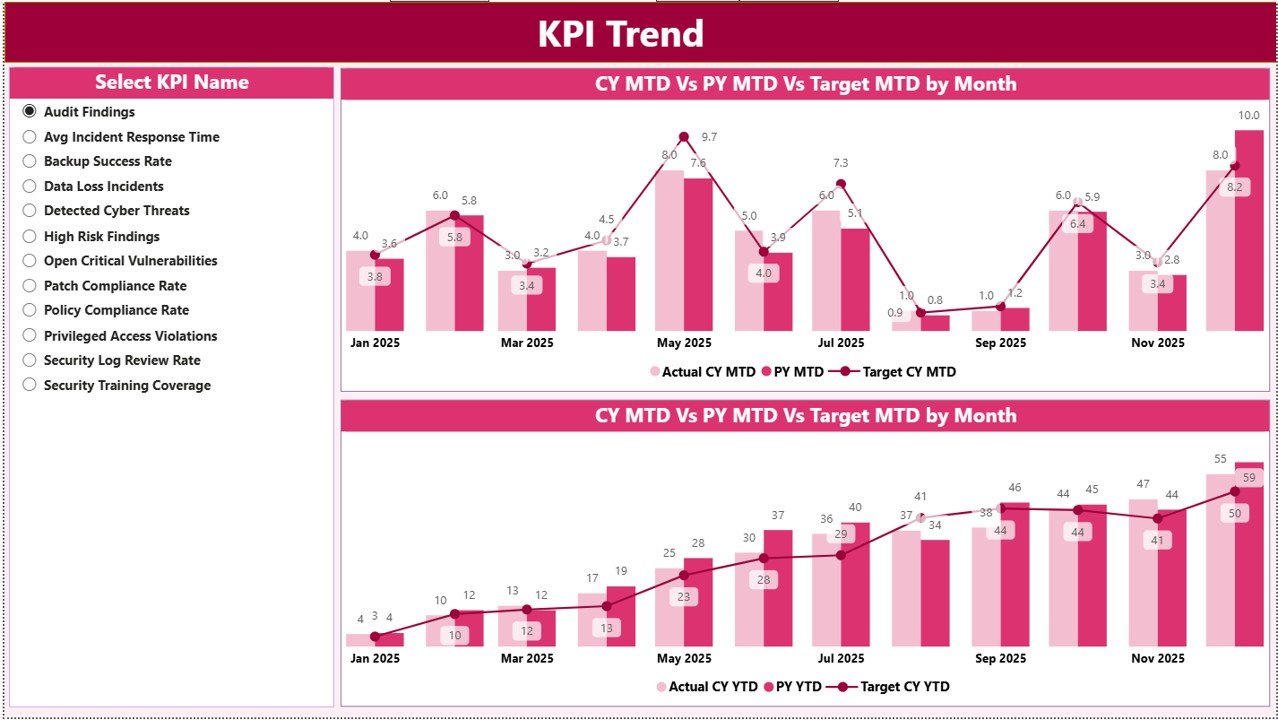
📈 KPI Trend Page – Risk Movement Analysis
The KPI Trend Page focuses on performance behavior over time.
Key highlights:
-
KPI Name slicer
-
MTD combo chart (Actual vs Target vs PY)
-
YTD combo chart (Actual vs Target vs PY)
This page helps teams:
-
Identify rising cyber risks
-
Track improvement patterns
-
Support proactive mitigation planning
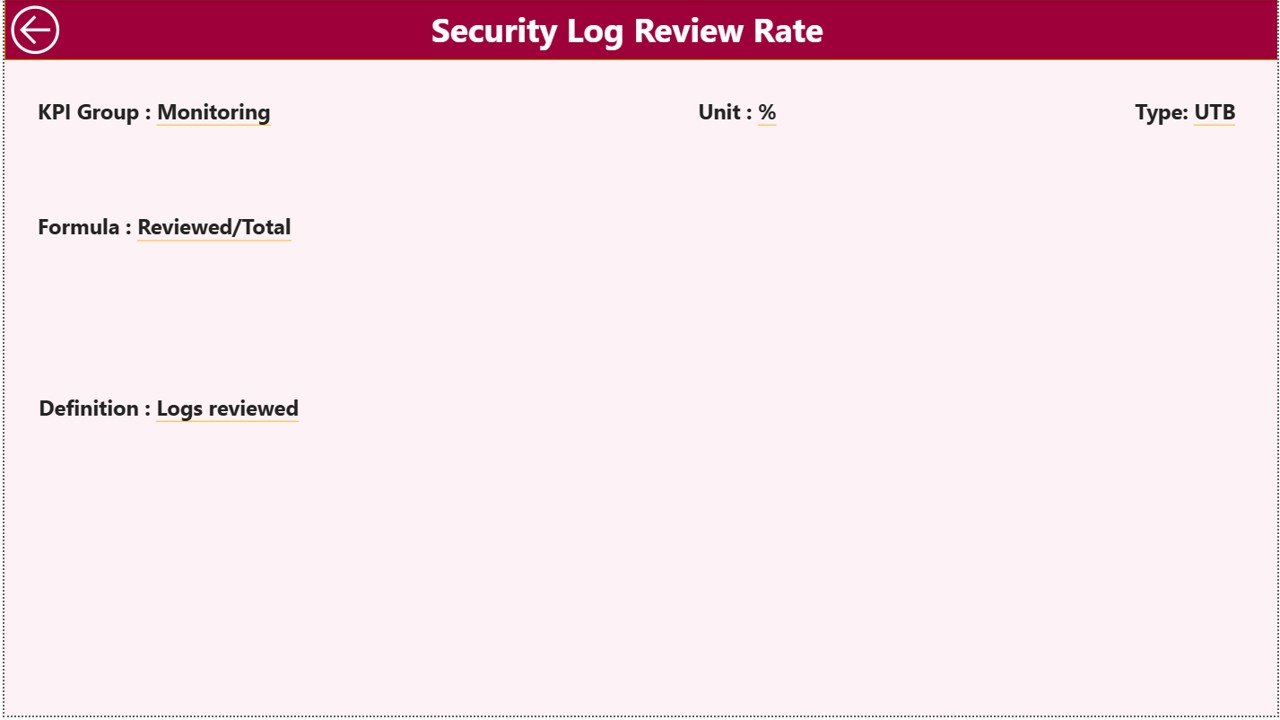
📘 KPI Definition Page – Drill-Through Governance View
This hidden drill-through page ensures KPI transparency.
It displays:
-
KPI Formula
-
KPI Definition
-
Unit of measurement
-
KPI Type (LTB / UTB)
Users can access this page directly from the Summary Page, ensuring consistent KPI interpretation.
🛠️ How to Use the Cyber Risk Management KPI Dashboard in Power BI
Using this dashboard is simple and structured:
1️⃣ Enter actual cyber risk data in Excel
2️⃣ Enter target values for each KPI
3️⃣ Maintain KPI definitions in the Excel file
4️⃣ Refresh Power BI dashboard
5️⃣ Use slicers and visuals to analyze performance
6️⃣ Take proactive cyber risk decisions
No advanced Power BI expertise is required.
👥 Who Can Benefit from This Cyber Risk Management KPI Dashboard
This dashboard is ideal for:
-
🛡️ Cyber Security Teams
-
🔐 Cyber Risk Management Teams
-
📋 Risk & Compliance Managers
-
🧠 IT Governance Teams
-
📊 Internal Audit Teams
-
👔 CISOs, CIOs, and IT Leaders
It works equally well for small teams and enterprise-level organizations.
📖 Click here to read the Detailed blog post
🎥 Visit our YouTube channel to learn step-by-step video tutorials
👉 https://youtube.com/@PKAnExcelExpert


Reviews
There are no reviews yet.