


Factory automation has revolutionized manufacturing by increasing speed, precision, and efficiency. However, automation alone does not guarantee optimal performance. Without structured KPI tracking, even highly automated factories struggle with inefficiencies, rising costs, downtime, and missed production targets.
That is exactly where the Factory Automation KPI Dashboard in Google Sheets creates real impact.
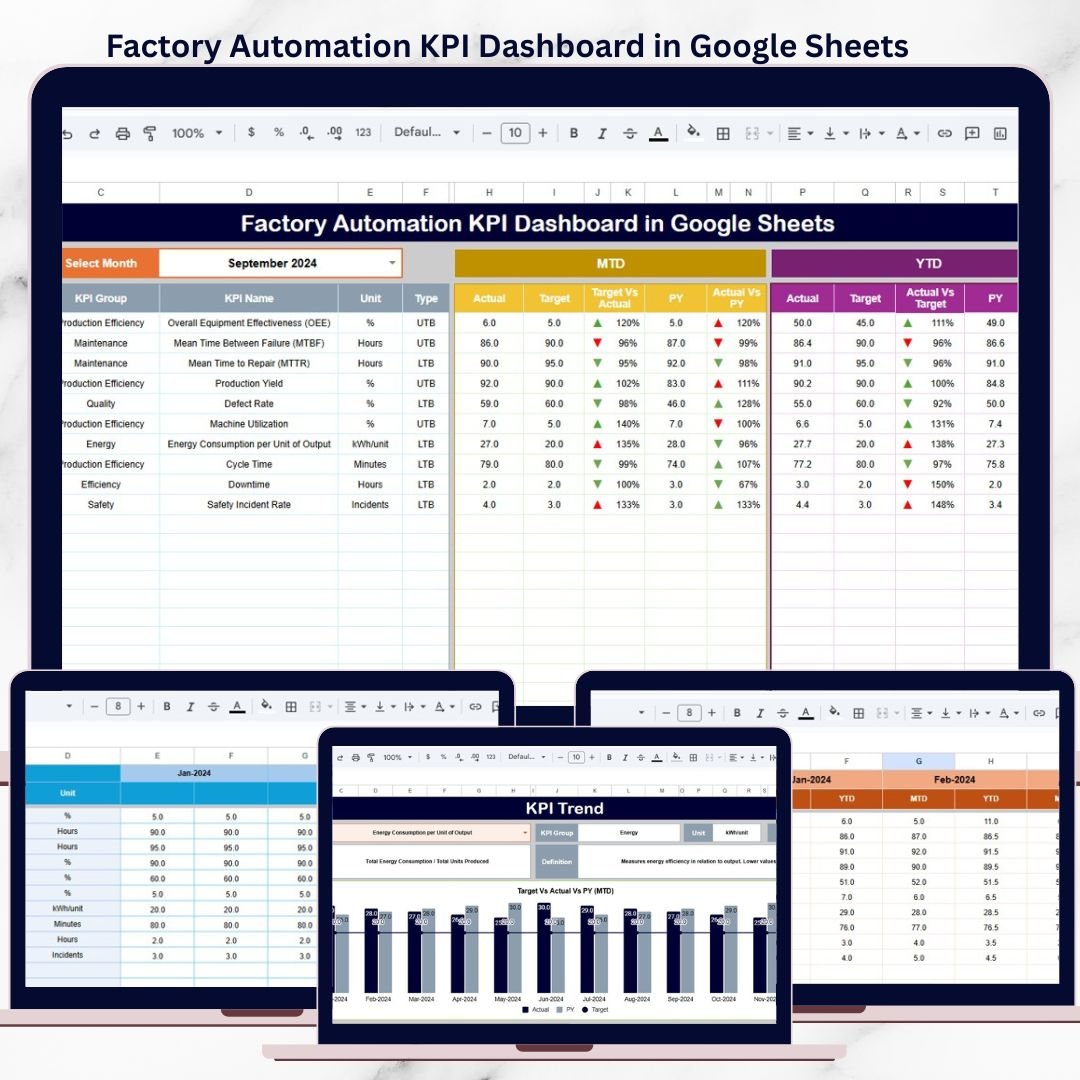
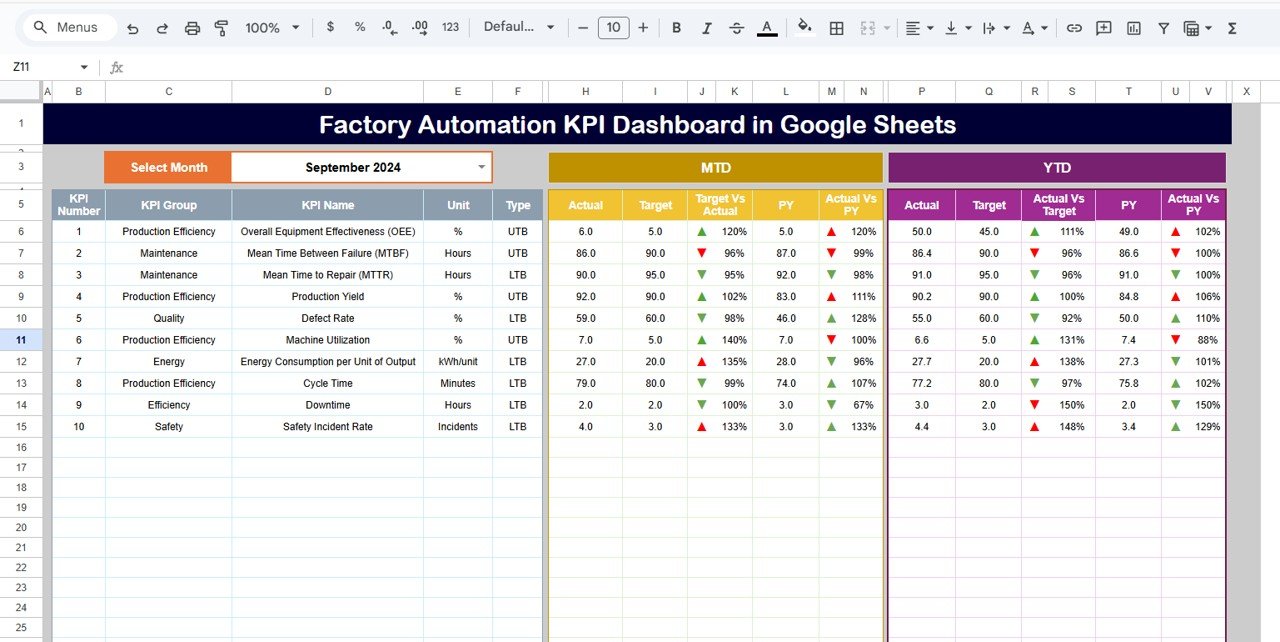
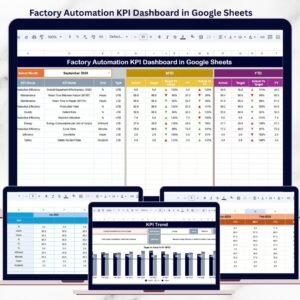
This ready-to-use dashboard helps manufacturing leaders monitor automation performance clearly and consistently. Instead of manually analyzing raw production data, teams get instant visibility into MTD, YTD, Targets, Previous Year comparisons, and trends—all in one centralized Google Sheets dashboard.
Because it is built in Google Sheets, this solution remains cloud-based, collaborative, scalable, and easy to maintain, making it ideal for modern factories.
⭐ Key Features of Factory Automation KPI Dashboard in Google Sheets
📊 Centralized Automation KPI Monitoring
Track all critical automation KPIs in one interactive dashboard.
📅 Dynamic Month Selection
Change the month once and the entire dashboard updates automatically.
📈 MTD & YTD Performance Tracking
Monitor short-term and long-term automation performance side by side.
🎯 Actual vs Target Comparison
Instantly identify performance gaps against defined automation goals.
📉 Previous Year Benchmarking
Measure improvement or decline with year-over-year comparison.
🚦 Visual Performance Indicators
Up and down arrows highlight positive and negative trends clearly.
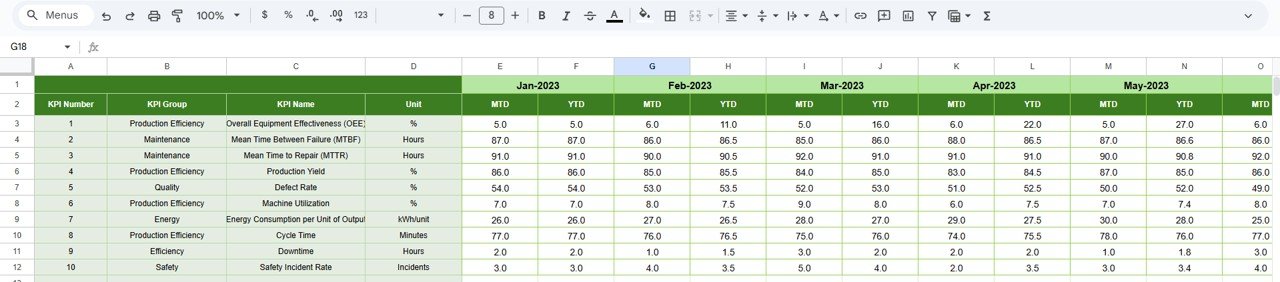
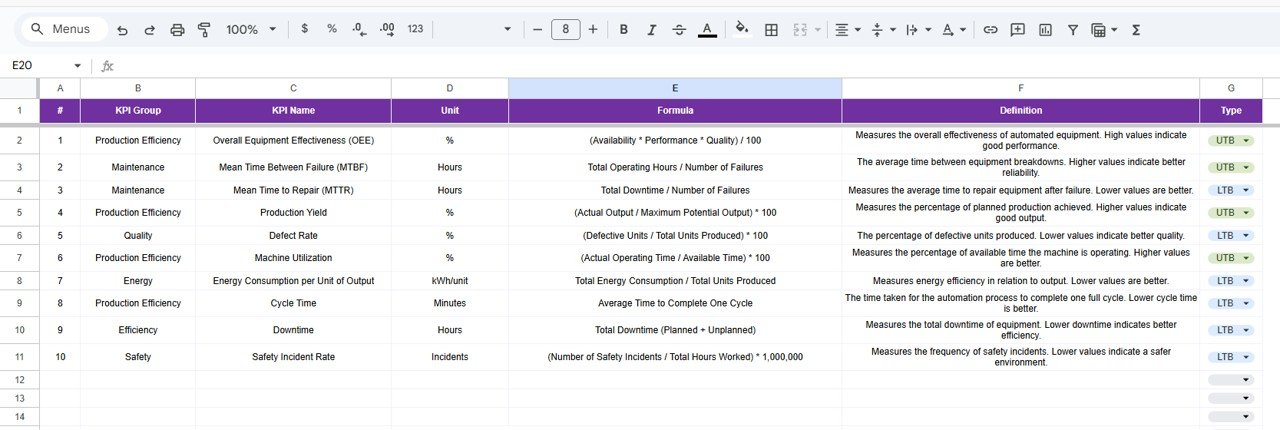
📘 Clear KPI Definitions & Logic
Each KPI includes unit, formula, definition, and KPI type (LTB / UTB).
☁️ Built in Google Sheets
Real-time collaboration, cloud access, and easy sharing across teams.
📦 What’s Inside the Factory Automation KPI Dashboard in Google Sheets?
This dashboard includes six professionally structured worksheets, each designed for clarity and control:
📌 Dashboard Sheet
The main performance view showing MTD, YTD, Target, and Previous Year comparisons with visual indicators.
📌 KPI Trend Sheet
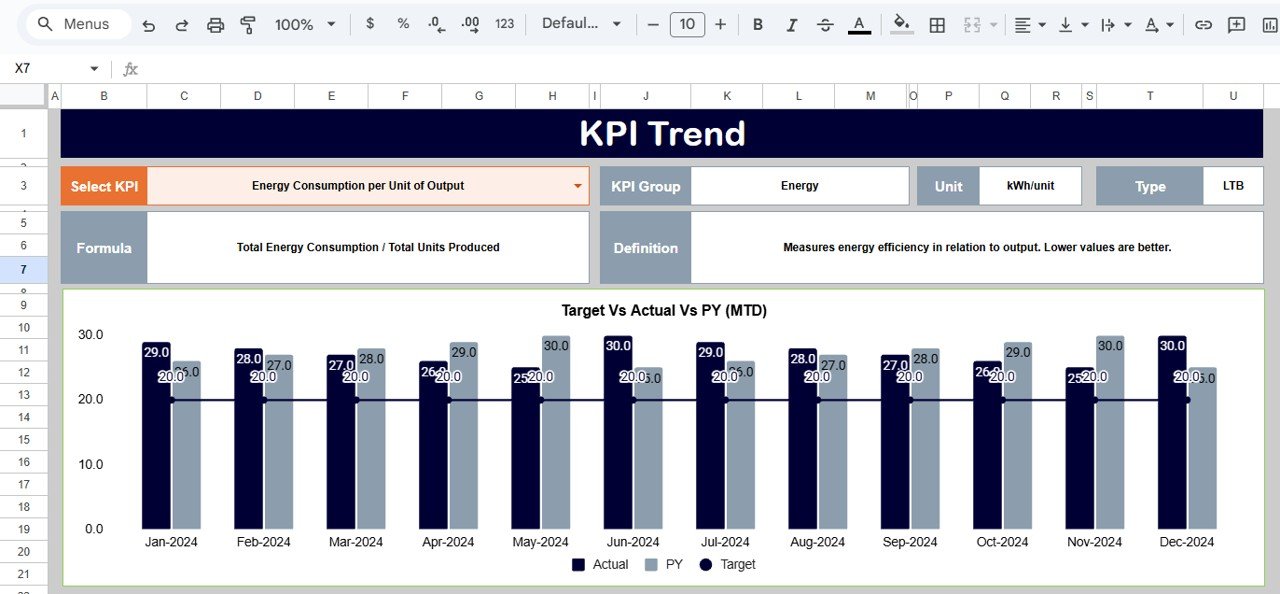
Detailed KPI-level trend analysis with KPI group, unit, formula, definition, and KPI type.
📌 Actual Number Sheet
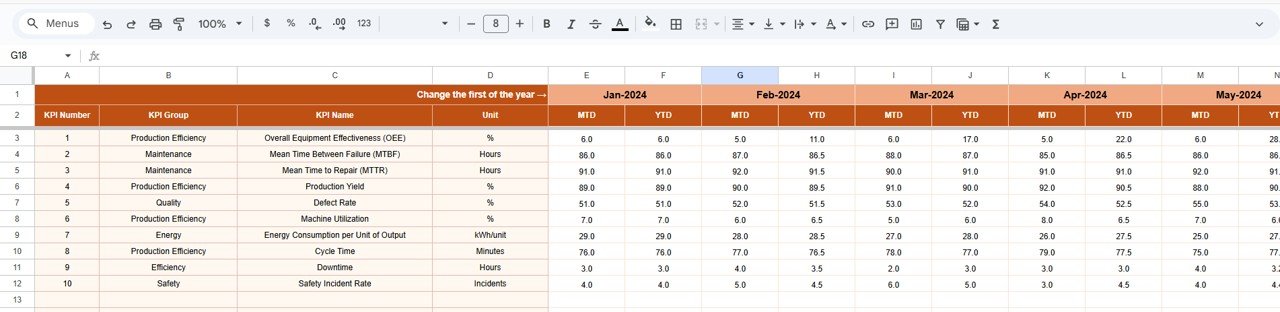
Simple input sheet for entering MTD and YTD actual performance data.
📌 Target Sheet
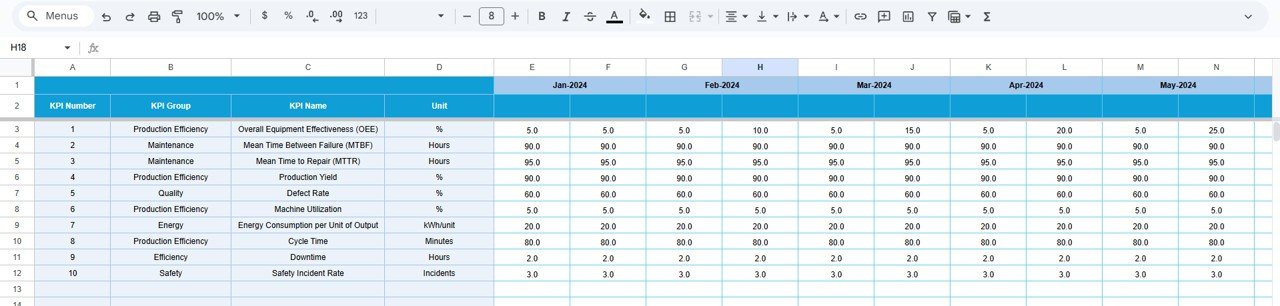
KPI-wise monthly and yearly targets for performance benchmarking.
📌 Previous Year Number Sheet
Historical data storage for accurate year-over-year analysis.
📌 KPI Definition Sheet
Central reference for KPI name, group, unit, formula, definition, and performance direction.
Together, these sheets form a complete factory automation performance management system.
🛠️ How to Use the Factory Automation KPI Dashboard in Google Sheets
Using this dashboard is straightforward and user-friendly:
1️⃣ Review or define KPIs in the KPI Definition Sheet
2️⃣ Enter actual performance data in the Actual Number Sheet
3️⃣ Add targets in the Target Sheet
4️⃣ Enter previous year data for comparison
5️⃣ Select the required month on the Dashboard
6️⃣ Instantly review performance using visuals and comparisons
All calculations update automatically, eliminating manual effort and reporting errors.
👥 Who Can Benefit from This Factory Automation KPI Dashboard?
This dashboard is ideal for:
🏭 Factory Managers
⚙️ Automation & Control Engineers
📊 Production & Operations Managers
🔄 Continuous Improvement Teams
📈 Manufacturing Consultants
🏢 Plant Leadership Teams
Whether managing a single production line or a fully automated plant, this dashboard scales effortlessly.
🚀 Why This Dashboard Is a Must-Have for Automated Factories
✔ Improves automation performance visibility
✔ Reduces inefficiencies and downtime
✔ Supports data-driven decision-making
✔ Tracks automation ROI effectively
✔ Saves hours of manual reporting
✔ Eliminates the need for expensive BI tools
This dashboard converts Google Sheets into a powerful automation performance intelligence platform.
🔗 Click here to read the Detailed blog post
Watch the step-by-step video tutorial:
📺 Visit our YouTube channel to learn step-by-step video tutorials and dashboard walkthroughs.
Compatibility and Requirements
- Works in Google Sheets. You need a free Google account and a web browser.
- You pick the month from a dropdown on the Dashboard sheet. Google explains dropdowns in Create an in-cell dropdown list.
Frequently Asked Questions
Which sheets are included?
Six sheets: Dashboard, KPI Trend, Actual Number, Target, Previous Year Number and KPI Definition.
How do I update the dashboard?
Enter your MTD and YTD actual figures in the Actual Number sheet and your goals in the Target sheet. Then select the month on the Dashboard sheet and everything updates.
Can I compare this year with last year?
Yes. Add last year’s figures to the Previous Year Number sheet. The Dashboard shows them next to your actuals and targets, with up and down arrows for the trend.
What does each KPI definition include?
The KPI Definition sheet lists the KPI name, group, unit, formula, definition and the KPI type (LTB or UTB).
Is there an Excel or Power BI version?
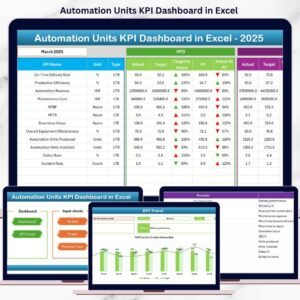
There are related automation dashboards in both formats. See the Automation Units KPI Dashboard in Excel and the Automation Units KPI Dashboard in Power BI.
Related Automation and KPI Templates
- Automation Units KPI Dashboard in Excel: automation KPIs in Excel
- Industrial Automation Equipment KPI Dashboard in Power BI: the Power BI option for industrial equipment
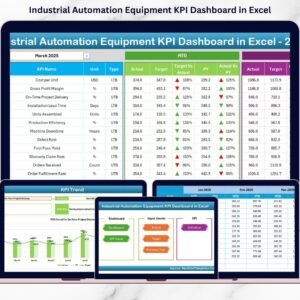
- Industrial Automation Equipment KPI Dashboard in Excel: the same topic in Excel
- Workflow Automation Checklist in Google Sheets: a checklist for automation work
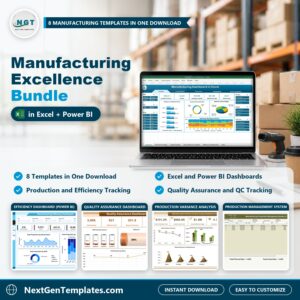
- Manufacturing Excellence Bundle: 8 manufacturing templates in one download
Browse all Google Sheets KPI dashboards.








Reviews
There are no reviews yet.