
Running a non-profit organization is about creating meaningful impact—but impact must be measured, tracked, and communicated clearly. Many non-profits struggle because performance data lives in scattered spreadsheets, reports, and emails. As a result, leadership teams spend more time compiling reports than analyzing results, and donors lack clear visibility into outcomes.
That is exactly why the Non-Profit KPI Scorecard in Google Sheets becomes a powerful and practical performance management solution.
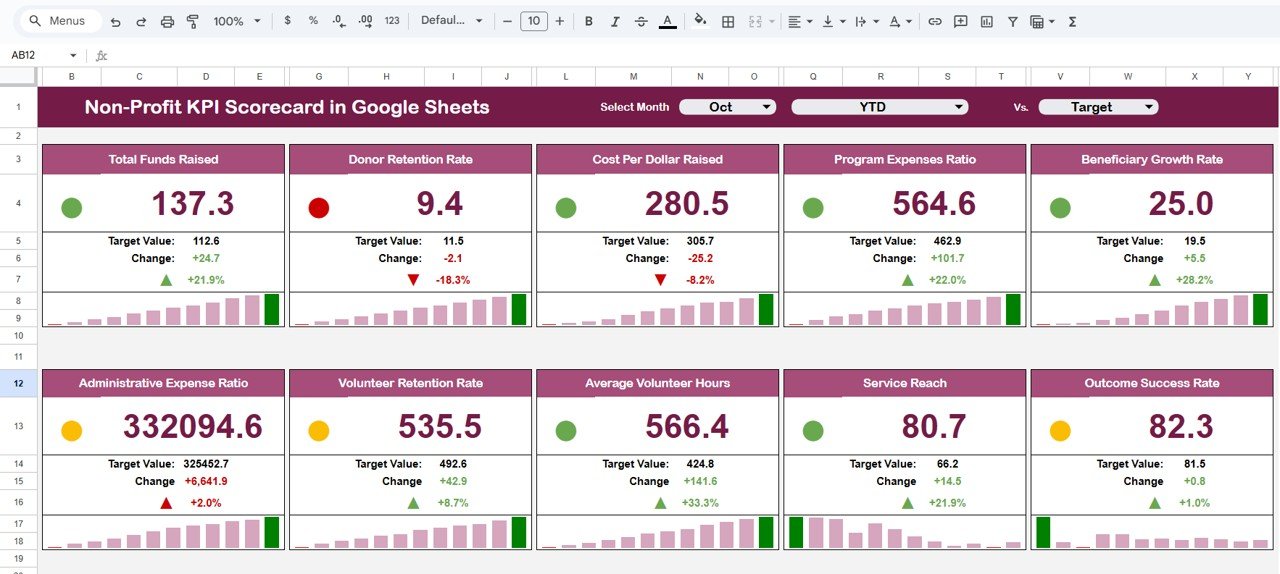
This ready-to-use KPI scorecard helps non-profit organizations monitor impact, efficiency, and sustainability using clearly defined KPIs, visual indicators, and automated calculations—all inside Google Sheets. Instead of complex BI tools or manual reporting, you get a clean, structured scorecard that updates automatically and supports confident, data-driven decisions.
Because the scorecard is built entirely in Google Sheets, it is cloud-based, collaborative, easy to customize, and cost-effective—perfect for non-profits of any size.
✨ Key Features of the Non-Profit KPI Scorecard in Google Sheets
🎯 1. Track 10 Predefined Non-Profit KPIs
The scorecard tracks 10 essential KPIs covering impact, operational efficiency, and organizational sustainability.
🚦 2. Traffic-Light Performance Indicators
Instantly understand performance using Green / Amber / Red indicators that show whether KPIs are on track or need attention.
📊 3. MTD & YTD Performance Views
Toggle between Month-to-Date (MTD) and Year-to-Date (YTD) views to track short-term progress and long-term trends.
📈 4. Automated Variance & Trend Signals
Up/down arrows and percentage changes highlight performance improvement or decline automatically.
🤝 5. Google Sheets-Based & Shareable
Easily share read-only or editable access with leadership, donors, and board members.
📦 What’s Inside the Non-Profit KPI Scorecard in Google Sheets
🖥️ Dashboard Sheet Tab – Performance Overview
This is the main scorecard view used for reviews and presentations.
📌 Key Highlights
-
Month selection dropdown at the top
-
Selecting a month instantly updates:
-
KPI values
-
Traffic-light indicators
-
Percentage change arrows
-
📌 KPI Insights Shown
-
MTD Actual vs Target
-
YTD Actual vs Target
-
Clear visual signals showing which KPIs are On Track, At Risk, or Critical
This sheet is ideal for board meetings, donor updates, and leadership reviews.
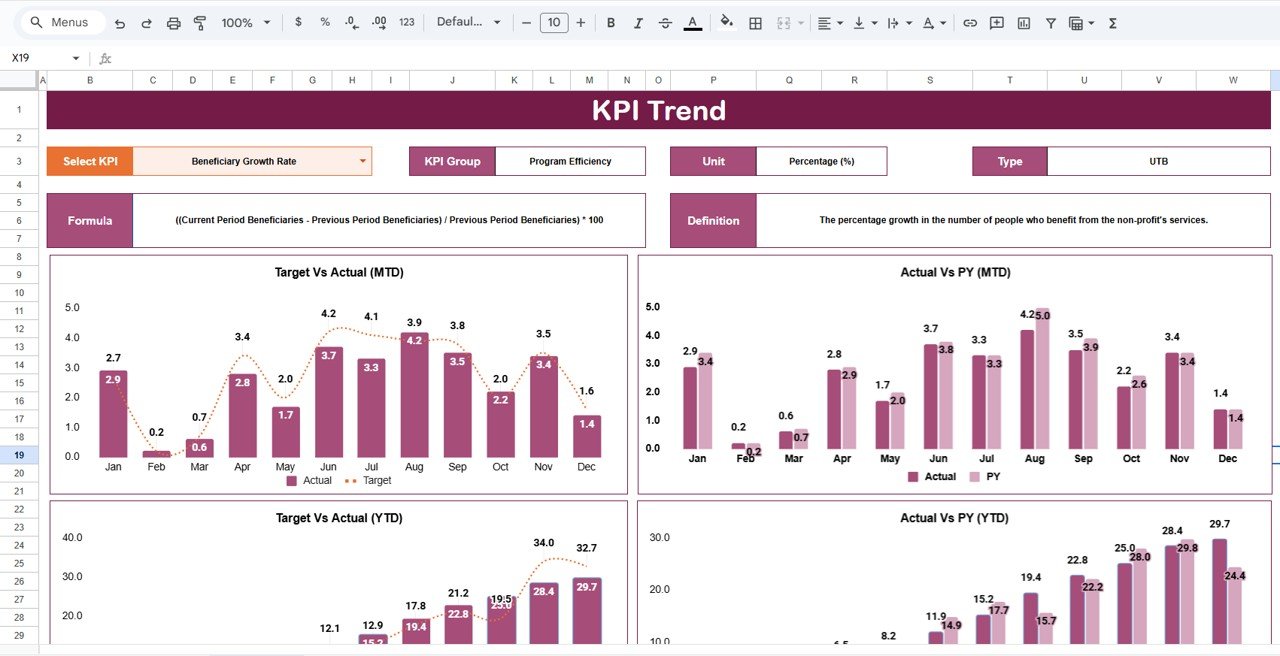
📊 KPI Trend Sheet Tab – Detailed KPI Analysis
This sheet allows deeper analysis of individual KPIs.
🔍 How It Works
-
Select a KPI from the dropdown in Cell C3
-
The sheet displays:
-
KPI Group
-
KPI Unit
-
KPI Type (Upper the Better / Lower the Better)
-
KPI Definition
-
This ensures complete clarity on what each KPI measures and why it matters.
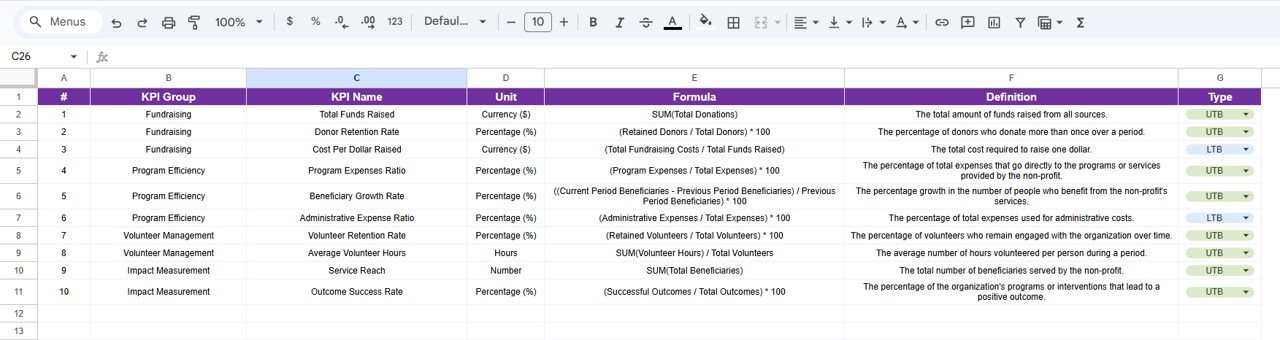
📘 KPI Definition Sheet Tab – KPI Master Data
This sheet acts as the single source of truth for KPI logic.
📌 Information Captured
-
KPI Name
-
KPI Group
-
Unit
-
Formula
-
KPI Definition
-
KPI Type (UTB / LTB)
Maintaining KPI logic in one place improves transparency, consistency, and governance.
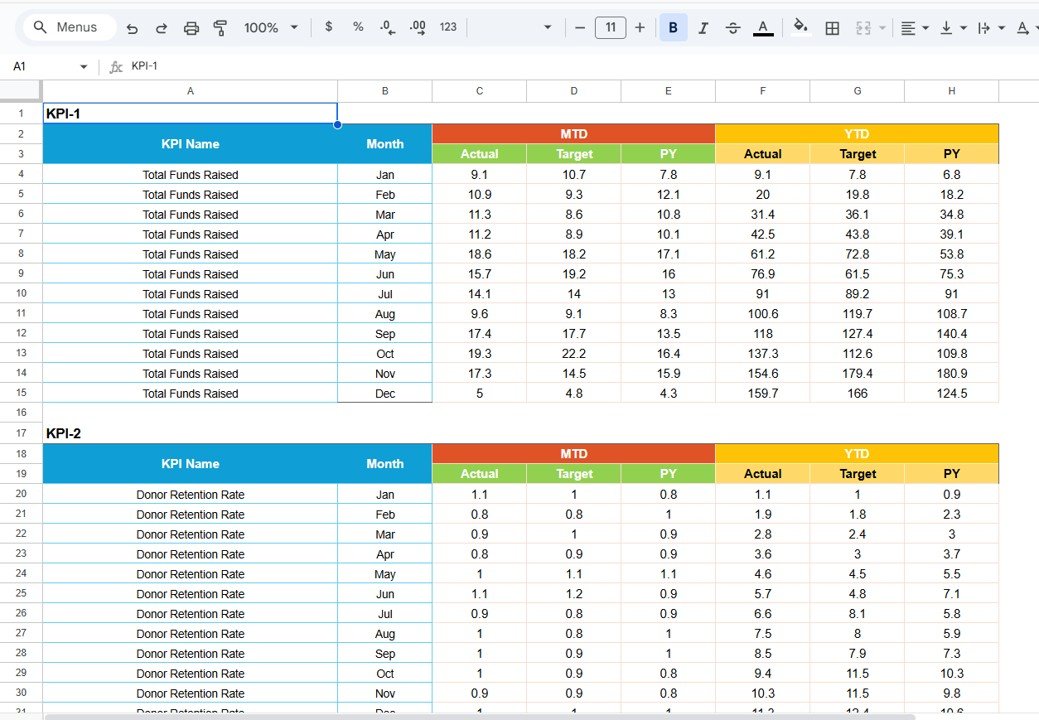
📋 Data Input Sheet Tab – Performance Data Entry
This sheet is used to enter actual KPI values.
🔹 Key Benefits
-
Enter KPI data once
-
Automatically feeds:
-
Dashboard scorecard
-
MTD & YTD calculations
-
Trend analysis
-
This reduces manual effort and reporting errors significantly.
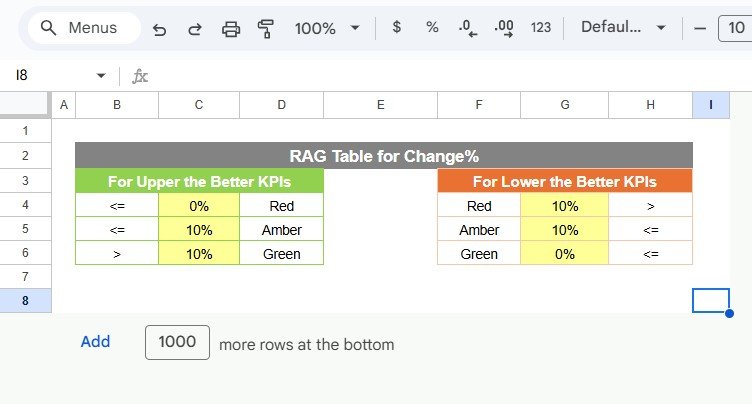
🎨 Colour Settings Sheet – Visual Control
This optional sheet allows you to control scorecard colors.
🔹 What You Can Do
-
Customize traffic-light thresholds
-
Adjust colors for:
-
Good performance
-
Warning levels
-
Critical issues
-
This helps align the scorecard with your organization’s branding and reporting standards.
🎯 Who Can Benefit from This Non-Profit KPI Scorecard
🌱 Non-Profit Organizations & NGOs
Track impact and accountability with clarity.
📊 Program & Impact Managers
Monitor performance across initiatives.
💝 Donor Reporting Teams
Provide transparent, data-backed updates.
👔 Leadership & Board Members
Review organizational health at a glance.
🚀 Growing Foundations
Standardize performance reporting year after year.
### Click here to read the Detailed blog post
Watch the step-by-step video tutorial:


Reviews
There are no reviews yet.