



Medical Equipment Manufacturing Dashboard demands precision, compliance, efficiency, and strict cost control. Manufacturers must track production units, defective rates, downtime hours, manufacturing time, and costs across plants, equipment, and products. However, when this critical data remains scattered across spreadsheets and manual reports, visibility disappears and decisions become reactive.
That is exactly where the Medical Equipment Manufacturing Dashboard in Excel becomes a powerful operational advantage 🚀.
This ready-to-use Excel dashboard converts complex manufacturing data into clear, visual, and actionable insights—all inside Microsoft Excel. Instead of spending hours preparing reports, production managers and plant leaders can monitor performance instantly using interactive charts, KPIs, and slicers.
Designed specifically for medical equipment manufacturers, this dashboard supports data-driven decision-making across production, quality, maintenance, and operations—without the need for expensive BI tools or IT dependency.
🔑 Key Features of Medical Equipment Manufacturing Dashboard in Excel
📊 Centralized Manufacturing Performance View
🏭 Plant-wise, Product-wise & Equipment-wise Analysis
⏱️ Downtime & Manufacturing Time Tracking
⚙️ Defective Units & Quality Monitoring
💰 Production Cost Analysis Across Dimensions
📅 Month-wise Trend Analysis
🧭 Interactive Slicers for Instant Filtering
🧩 Fully Customizable Excel-Based Design
This dashboard helps manufacturers move from manual reporting to proactive operational control.
📂 What’s Inside the Medical Equipment Manufacturing Dashboard?
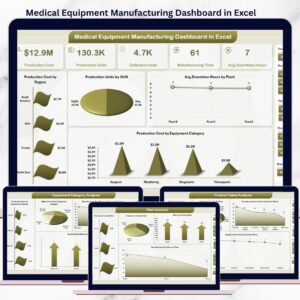
📊 Overview Page – Manufacturing Performance Snapshot

The Overview Page acts as the command center of the dashboard.
Key KPIs Displayed:
Total Production Cost
Total Production Units
Average Downtime Hours
Overall Manufacturing Time
Key Charts Included:
Production Cost by Region
Production Units by Shift
Average Downtime Hours by Plant
Production Cost by Equipment Category
This page gives leadership instant clarity on overall manufacturing health.
⚙️ Equipment Category Analysis Page
This page focuses on performance across different equipment categories.
Key Insights:
Production Units by Equipment Category
Defective Units by Equipment Category
Manufacturing Time by Equipment Category
Average Downtime Hours by Equipment Category
It helps identify underperforming machines, optimize maintenance, and reduce defects.
📦 Product Name Analysis Page
The Product Name Analysis Page evaluates performance at the product level.
Key Charts:
Production Units by Product Name
Production Cost by Product Name
Manufacturing Time by Product Name
Average Downtime Hours by Product Name
This analysis supports profitability optimization and product mix decisions.
🏭 Plant Analysis Page
The Plant Analysis Page compares performance across manufacturing facilities.
Key Charts:
Production Cost by Plant
Production Units by Plant
Defective Units by Plant
Manufacturing Time by Plant
It enables benchmarking, capacity planning, and quality consistency across plants.
📆 Month Analysis Page
The Month Analysis Page highlights time-based performance trends.
Key Charts:
Average Downtime Hours by Month
Production Units by Month
Production Cost by Month
This page supports forecasting, budgeting, and preventive maintenance planning.
🛠️ How to Use the Medical Equipment Manufacturing Dashboard in Excel
✅ Enter or update manufacturing data in the Data Sheet
✅ Refresh Pivot Tables
✅ Use slicers to filter by plant, product, equipment, region, or month
✅ Review KPIs and charts instantly
✅ Take corrective actions based on insights
No advanced Excel skills are required.
👥 Who Can Benefit from This Dashboard?
🏭 Production Managers
🧪 Quality Assurance Teams
⚙️ Maintenance & Operations Teams
📊 Manufacturing Analysts
🏢 Plant Managers
📈 Business Owners & Leadership
Suitable for single-plant and multi-plant medical equipment manufacturers.
👉 Click here to read the Detailed blog post
▶️ Visit our YouTube channel to learn step-by-step video tutorials
https://youtube.com/@PKAnExcelExpert
Watch the step-by-step video tutorial:
Compatibility and Requirements
- Works in Microsoft Excel desktop (Excel 2016 or later, or Microsoft 365).
- You filter the pages by plant, product, equipment category, region and month with slicers. Microsoft explains them in Use slicers to filter data.
Frequently Asked Questions
Which pages does the dashboard have?
Five pages: Overview, Equipment Category Analysis, Product Name Analysis, Plant Analysis and Month Analysis.
Which KPIs does the Overview page show?
Total Production Cost, Total Production Units, Average Downtime Hours and Overall Manufacturing Time.
How do I update it with my own data?
Enter or update your manufacturing data in the Data Sheet, then refresh the Pivot Tables. The charts and KPIs update from there.
Can I compare plants and products?
Yes. The Plant Analysis page compares production cost, units, defective units and manufacturing time by plant. The Product Name Analysis page does the same by product, including average downtime hours.
Is there a Power BI or Google Sheets version?
Yes. See the Medical Equipment Manufacturing Dashboard in Power BI and the Medical Equipment Manufacturing Dashboard in Google Sheets.
Related Manufacturing Templates
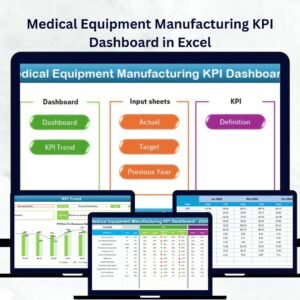
- Medical Equipment Manufacturing KPI Dashboard in Excel: a KPI view for the same industry
- Medical Equipment Manufacturing Dashboard in Power BI: the Power BI edition
- Medical Equipment Manufacturing Dashboard in Google Sheets: the Google Sheets edition
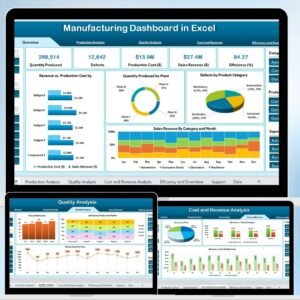
- Manufacturing Dashboard in Excel: a general manufacturing dashboard
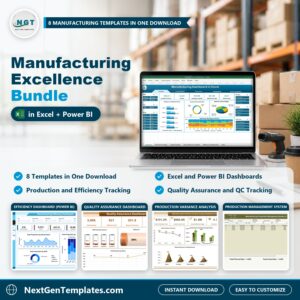
- Manufacturing Excellence Bundle: 8 manufacturing templates in one download
Browse all Excel dashboards.











Reviews
There are no reviews yet.