Managing office budgets across departments, categories, and vendors is a constant challenge for growing organizations. When budget data is scattered across multiple spreadsheets, tracking actual spend, approvals, variances, and trends becomes slow, manual, and error-prone. As a result, finance teams lose control, managers overspend unknowingly, and leadership lacks a clear financial picture.
That is exactly why the Office Budget Utilization Dashboard in Google Sheets becomes a powerful, ready-to-use financial analytics solution.
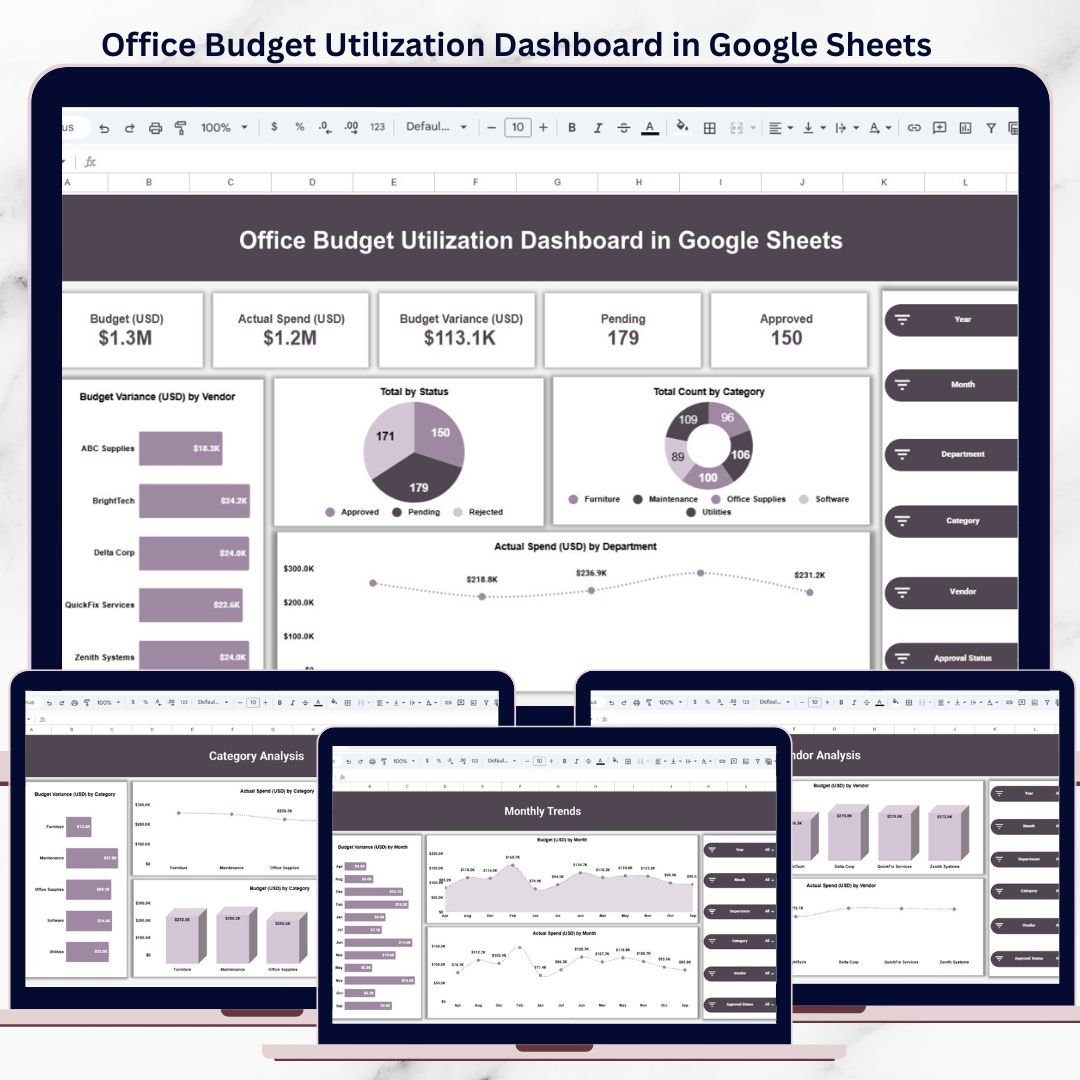
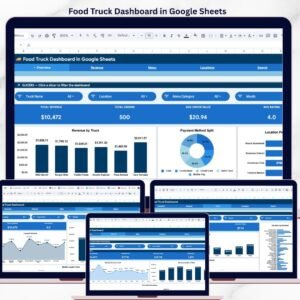
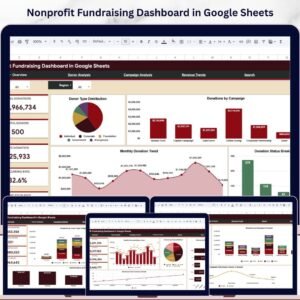
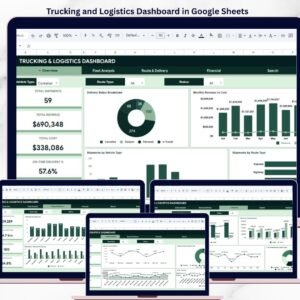
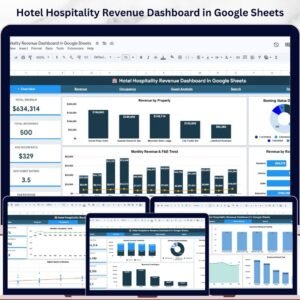
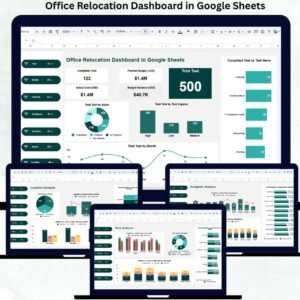
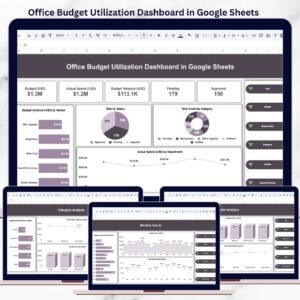
This professionally designed dashboard transforms raw budget and expense data into clear KPIs, interactive charts, and actionable insights—all inside Google Sheets. Instead of spending hours creating reports, teams can instantly monitor budget utilization, identify variances, and take corrective actions with confidence.
Because the dashboard is built entirely in Google Sheets, it is cloud-based, easy to share, and simple to update—without complex tools, coding, or BI software.
🔑 Key Features of Office Budget Utilization Dashboard in Google Sheets
📊 Centralized Budget KPIs
Get an instant snapshot of budget health with KPI cards such as:
-
Total Budget (USD)
-
Actual Spend (USD)
-
Budget Variance (USD)
-
Pending Requests
-
Approved Requests
These KPIs help leadership quickly assess whether spending is under control or drifting off track.
🎛 Interactive Filters & Slicers
Analyze data dynamically using slicers for:
-
Year
-
Month
-
Department
-
Category
-
Vendor
-
Approval Status
All charts and KPIs update instantly based on your selections, enabling deep analysis in seconds.
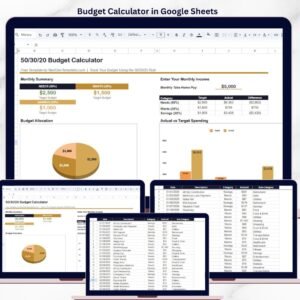
💡 Budget vs Actual Monitoring
Compare planned budgets with real spending to:
-
Detect overspending early
-
Control unnecessary expenses
-
Improve budget forecasting accuracy
-
Strengthen approval discipline
This feature supports proactive financial decision-making instead of reactive firefighting.
📂 What’s Inside the Office Budget Utilization Dashboard
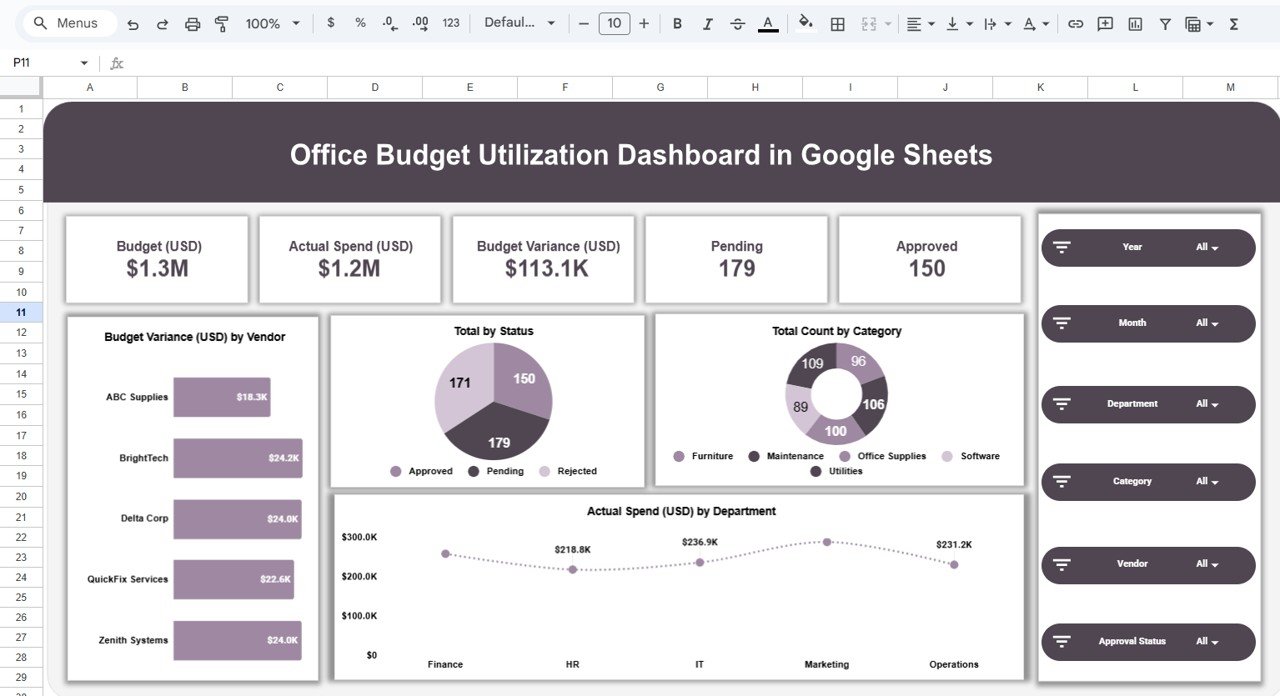
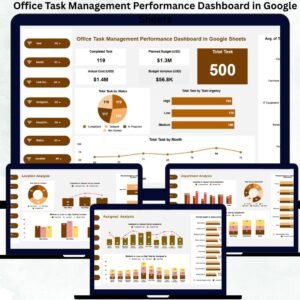
📌 1. Overview Sheet
The main dashboard designed for management and finance reviews. It provides:
-
Total budget vs actual spend
-
Overall budget variance
-
Pending vs approved records
-
Budget variance by vendor
-
Spend distribution by category
-
Actual spend by department
This page is perfect for executive summaries and monthly review meetings.
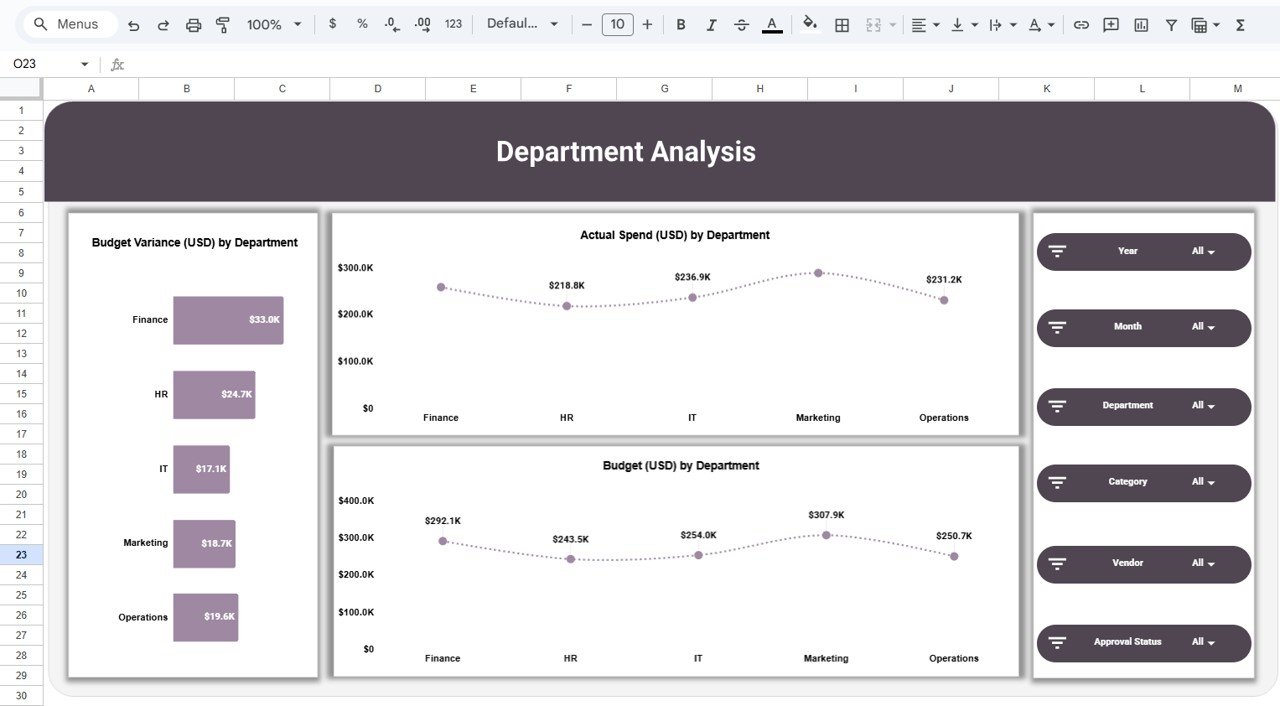
🏢 2. Department Analysis
Focuses on how each department utilizes its allocated budget.
Insights include:
-
Budget variance by department
-
Actual spend by department
-
Budget allocation by department
-
Department-wise spending patterns
It helps identify departments that overspend or underutilize budgets.
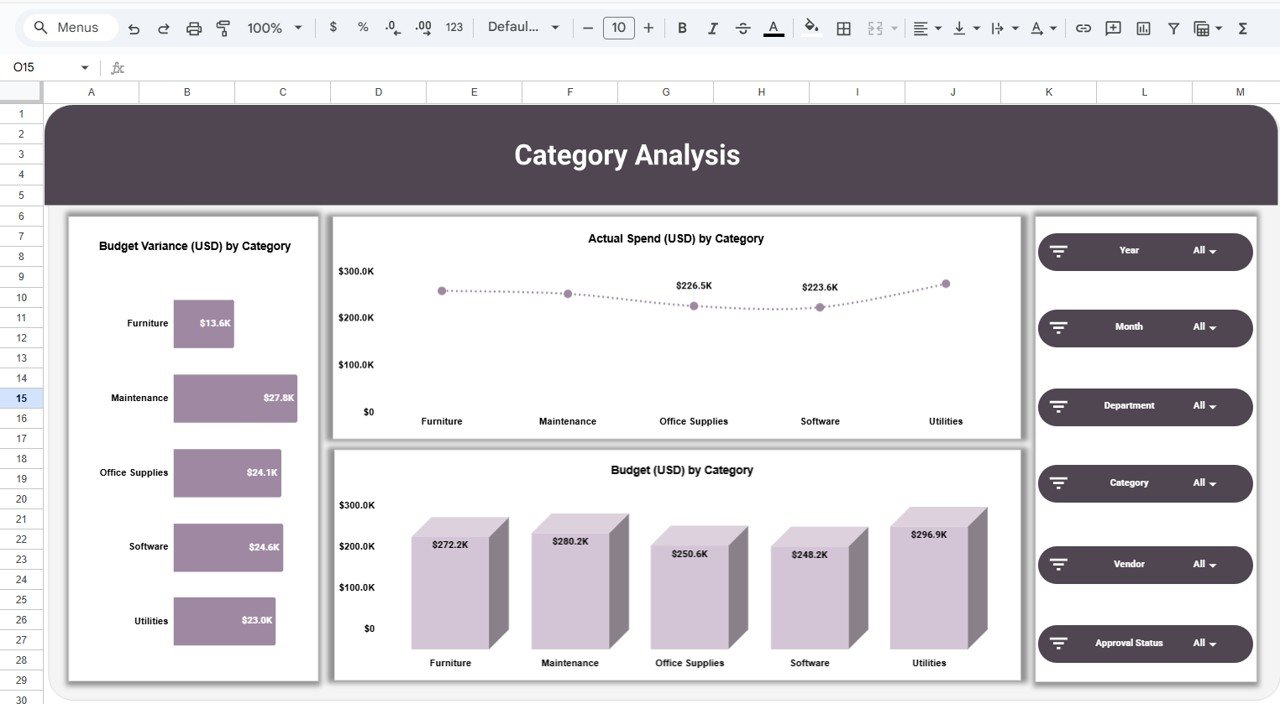
🗂 3. Category Analysis
Analyzes expenses by category such as:
-
Furniture
-
Maintenance
-
Office Supplies
-
Software
-
Utilities
Key insights:
-
Budget vs actual by category
-
High-cost categories
-
Areas requiring immediate cost control
This sheet supports procurement and cost-optimization strategies.
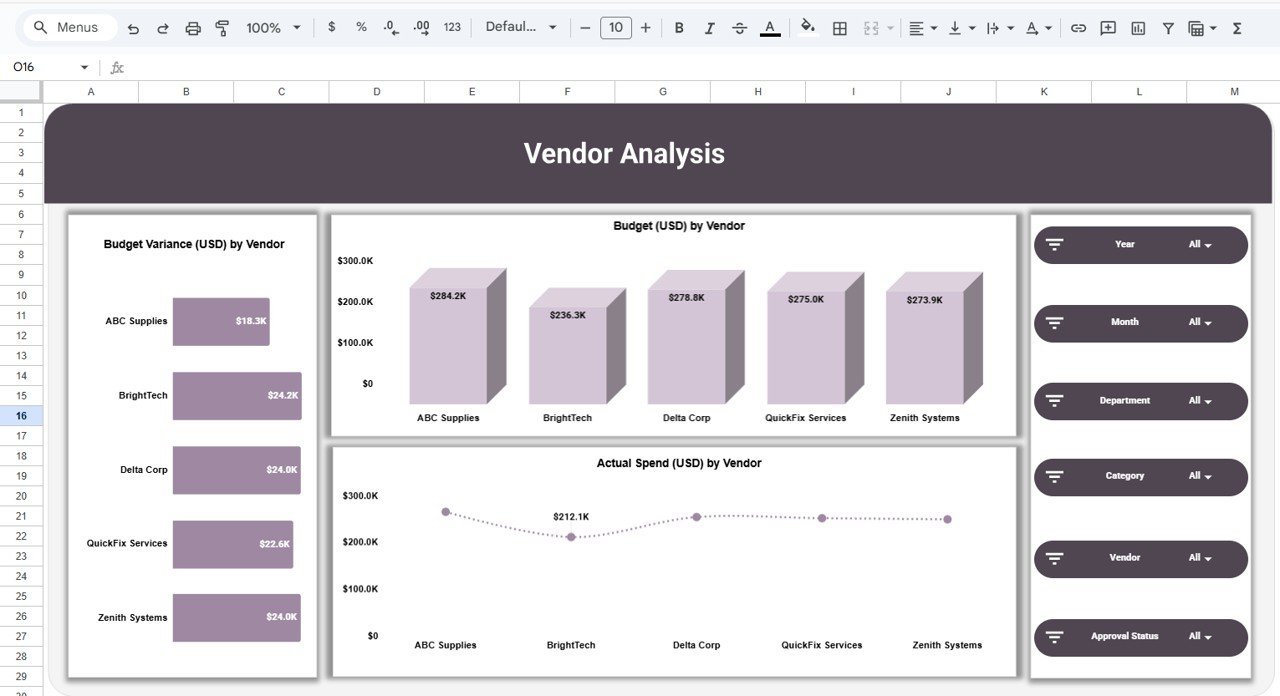
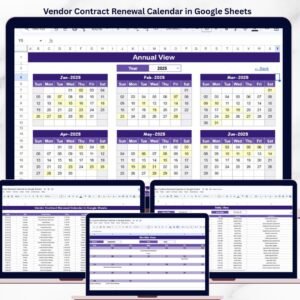
🤝 4. Vendor Analysis
Tracks spending and budget utilization across vendors.
You can analyze:
-
Budget vs actual spend by vendor
-
Budget variance by vendor
-
High-cost and high-risk vendors
This helps with vendor negotiations, contract reviews, and consolidation decisions.
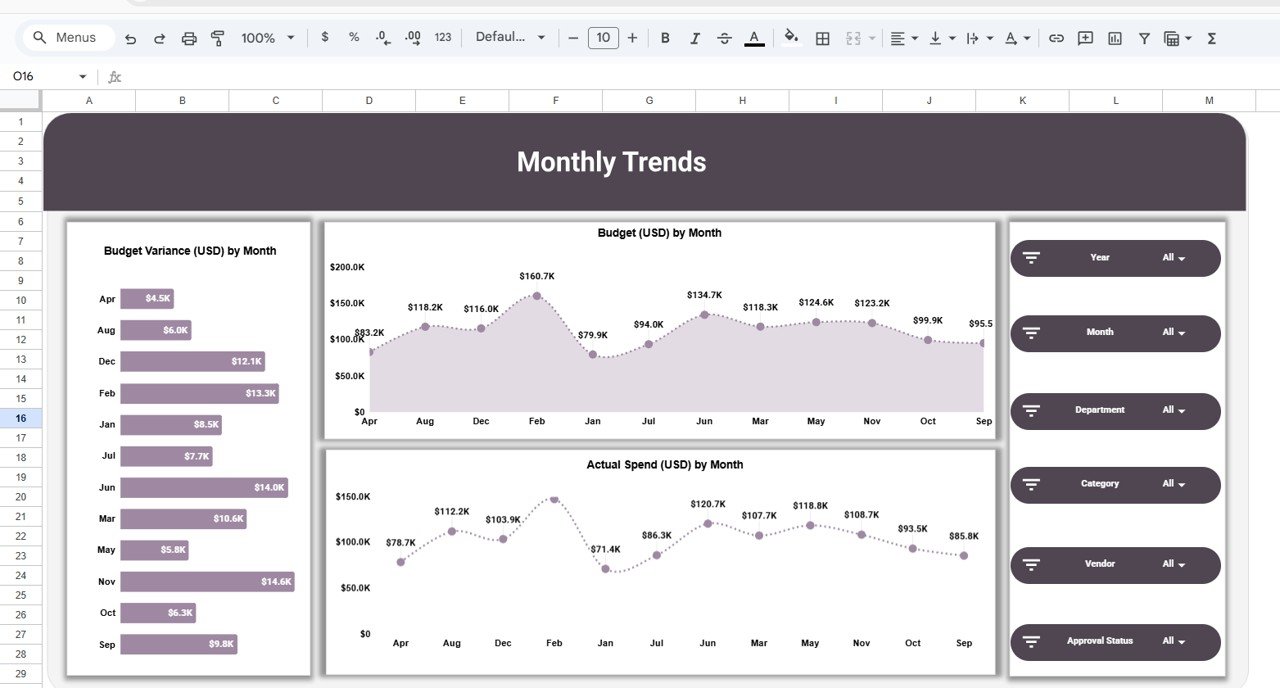
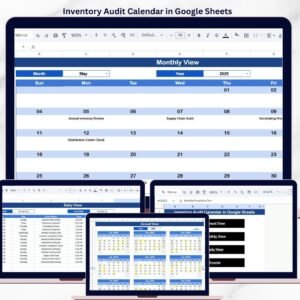
📅 5. Monthly Trends
Tracks how budgets and spending change over time.
Includes:
-
Budget amount by month
-
Actual spend by month
-
Budget variance by month
This view helps identify seasonal patterns, recurring overspend issues, and future budget needs.
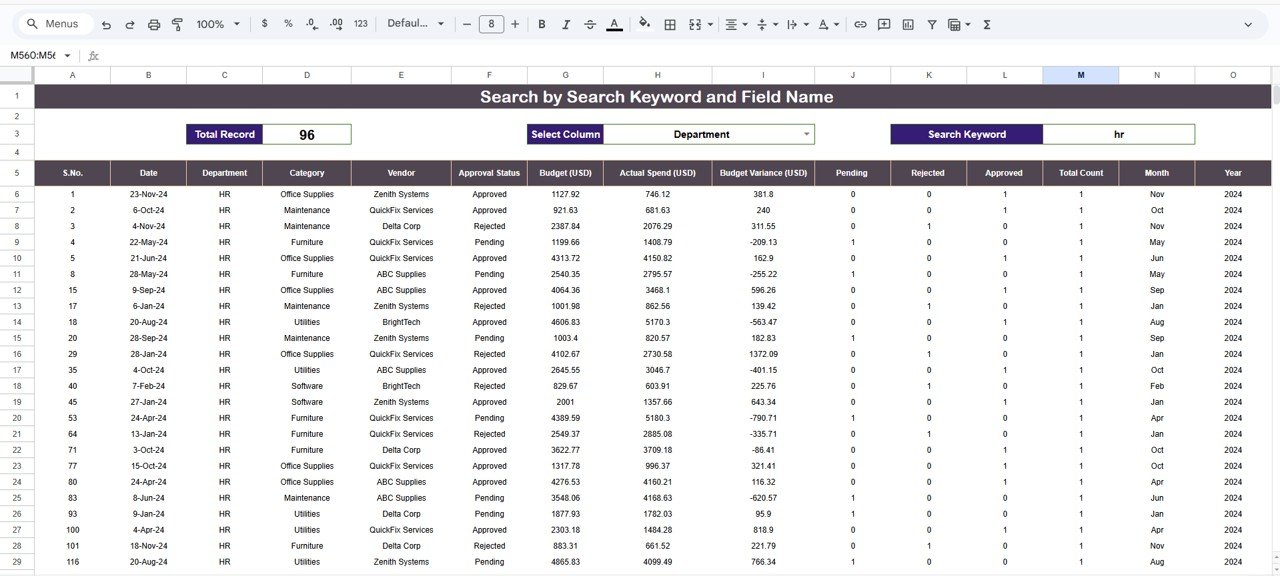
🔍 6. Search by Keyword & Field Name
A powerful search feature that allows users to:
-
Select a column (Department, Vendor, Category, etc.)
-
Enter a keyword
-
Instantly filter matching records
Ideal for large datasets with hundreds or thousands of entries.
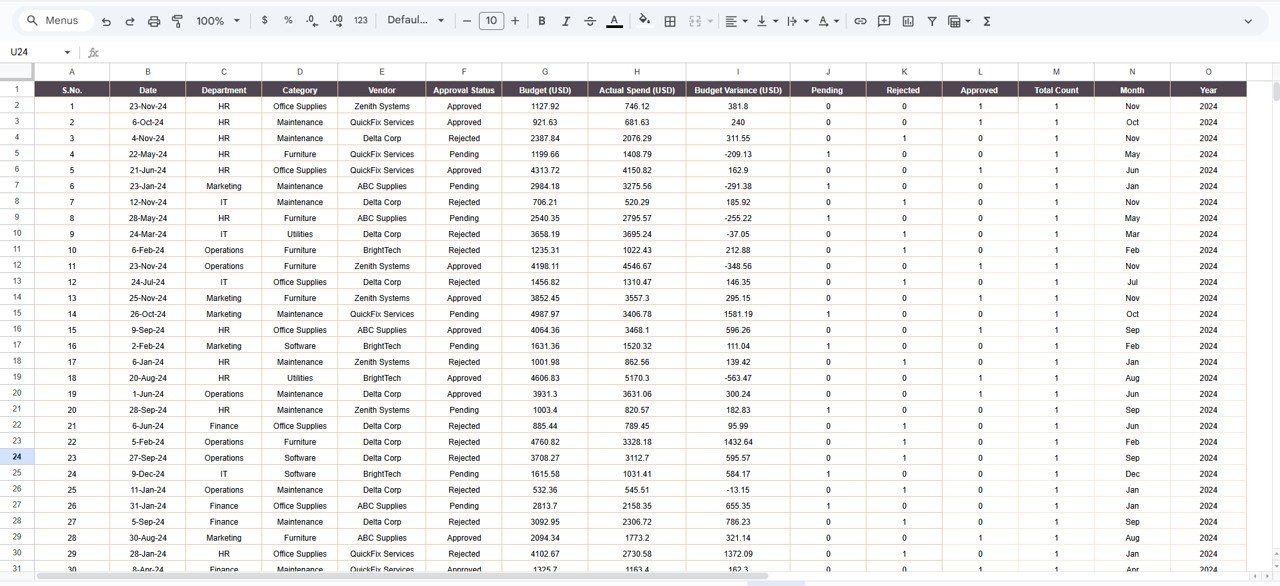
▶️ How to Use the Office Budget Utilization Dashboard
-
Paste your budget and expense data into the data sheet
-
Use slicers to filter by department, category, or month
-
Review KPI cards and charts for insights
-
Monitor budget variances regularly
-
Share dashboards with stakeholders for accountability
👥 Who Can Benefit from This Dashboard
-
💼 Finance & Accounting Teams
-
⚙️ Operations Managers
-
🧾 Procurement Teams
-
🏢 Admin & Facility Teams
-
👔 Business Owners, CFOs & Leadership
### Click here to read the Detailed blog post
Watch the step-by-step video tutorial:


Reviews
There are no reviews yet.