


Risk management has become a continuous and strategic business function. Organizations today must identify risks early, monitor exposure regularly, and take corrective actions before issues turn into losses or compliance failures. However, many teams still track risk and compliance KPIs using emails, static spreadsheets, or disconnected reports. As a result, visibility is limited, response time is slow, and leadership lacks confidence in risk oversight.
That is exactly why the Risk Management KPI Scorecard in Google Sheets becomes a powerful and practical solution.
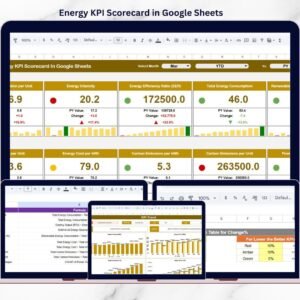
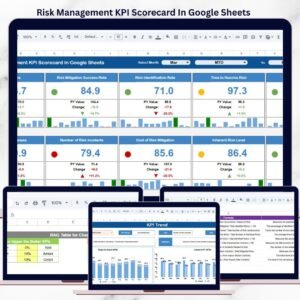
This ready-to-use scorecard provides a centralized, visual, and structured way to monitor risk and compliance KPIs using monthly and yearly performance views. Instead of reviewing multiple reports, teams can instantly see risk health, deviations from targets, and performance trends—allowing faster and more informed decisions.
Because the scorecard is built entirely in Google Sheets, it is cloud-based, easy to share, and simple to customize without relying on complex BI tools or expensive risk management software.

🚀 Key Features of Risk Management KPI Scorecard in Google Sheets
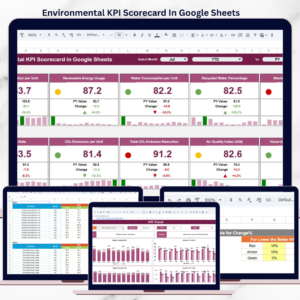
📊 Centralized Risk & Compliance Performance View
All critical risk management KPIs are tracked in one unified scorecard. Teams can instantly assess compliance status, control effectiveness, and risk exposure without manual consolidation.
The scorecard supports:
-
Month-to-Date (MTD) performance
-
Year-to-Date (YTD) performance
-
Target vs Actual comparison
-
Previous Year vs Current Year comparison
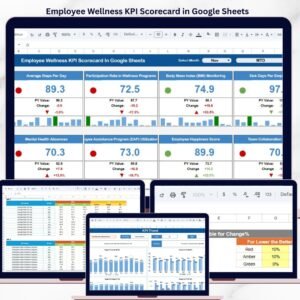
Visual indicators make performance interpretation fast and intuitive.
📅 Dynamic Month Selection
A Month Dropdown allows users to switch reporting periods easily.
Once a month is selected:
-
KPI values refresh automatically
-
MTD and YTD numbers update instantly
-
Variance and trend indicators recalculate
This enables quick monthly reviews and consistent reporting.
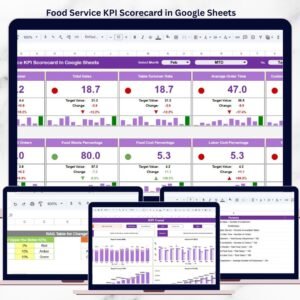
📌 Scorecard Sheet – Main Dashboard
This is the primary performance view used by management and audit teams.
🔹 What This Sheet Displays:
-
KPI Name
-
MTD Actual, Target, and Previous Year
-
Target vs Actual variance (%)
-
Previous Year vs Actual variance (%)
-
YTD Actual, Target, and Previous Year
-
🚦 Traffic lights (Red / Amber / Green)
-
⬆️⬇️ Trend arrows for performance direction
This layout highlights high-risk and non-compliant areas immediately.
📈 KPI Trend Sheet – Risk Behavior Over Time
The KPI Trend Sheet allows deeper KPI analysis.
🔹 How It Works:
-
Select a KPI from the dropdown in Cell C3
-
Automatically displays:
-
KPI Group (Risk, Audit, Legal, Operations, etc.)
-
KPI Unit
-
KPI Type (Lower the Better / Upper the Better)
-
Monthly KPI trend values
-
This sheet helps teams identify whether risk levels are improving, stable, or deteriorating.
📚 KPI Definition Sheet – Governance & Standardization
This sheet acts as the KPI master reference.
🔹 Information Included:
-
KPI Name
-
KPI Group
-
Unit of Measurement
-
KPI Formula
-
KPI Definition
-
KPI Type (LTB / UTB)
It ensures consistent KPI understanding across compliance, audit, and leadership teams and supports audit readiness.
🧮 Data Input Sheet – Simple & Structured Entry
The Data Input Sheet is where actual KPI values are entered.
🔹 Key Capabilities:
-
Enter MTD and YTD actual values
-
Select the reporting month
-
All dashboards and trend sheets update automatically
This keeps data entry clean, controlled, and user-friendly.
🎨 Colour Settings Sheet – Visual Control
The Colour Settings Sheet allows easy customization of performance visuals.
🔹 What You Can Configure:
-
Traffic light thresholds
-
Arrow logic for improvement or decline
-
Performance color rules
This flexibility ensures alignment with organizational risk policies.
🎯 Who Can Benefit from This Risk Management KPI Scorecard
-
⚠️ Risk Management Teams
-
📋 Compliance & Governance Teams
-
🔍 Internal Audit Departments
-
⚖️ Legal & Regulatory Teams
-
👔 Senior Management & Board Committees
### Click here to read the Detailed blog post
Watch the step-by-step video tutorial:


Reviews
There are no reviews yet.