Running a restaurant or food service business without clear insights is like managing a kitchen without recipes. Sales happen, costs increase, customers leave feedback—but without a structured view, you cannot clearly see what drives profit, where costs leak, and which locations truly perform.
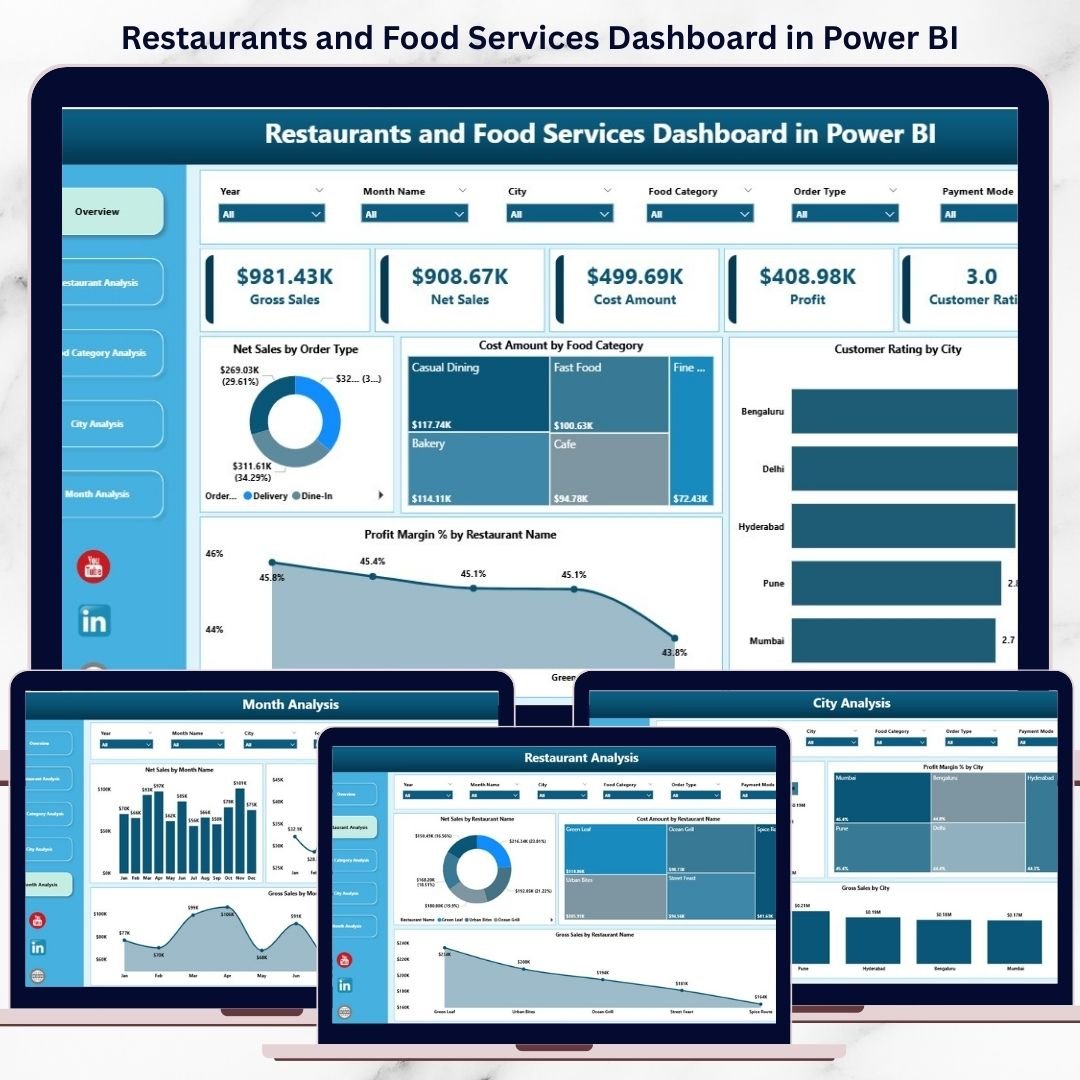
The Restaurants and Food Services Dashboard in Power BI is a ready-to-use, interactive analytics solution that converts raw restaurant data into clear, visual, and actionable insights. Instead of juggling multiple Excel files and reports, you get one centralized Power BI dashboard to monitor sales, costs, profit margins, order types, customer ratings, cities, food categories, and monthly trends.
This dashboard empowers restaurant owners and managers to move from gut-based decisions to data-driven control.
🚀 Key Features of Restaurants and Food Services Dashboard in Power BI
📊 Centralized Restaurant Analytics – One dashboard for all performance insights
🎯 Interactive Slicers – Filter by restaurant, city, food category, order type, and month
📈 Sales, Cost & Profit Visibility – Track margins clearly
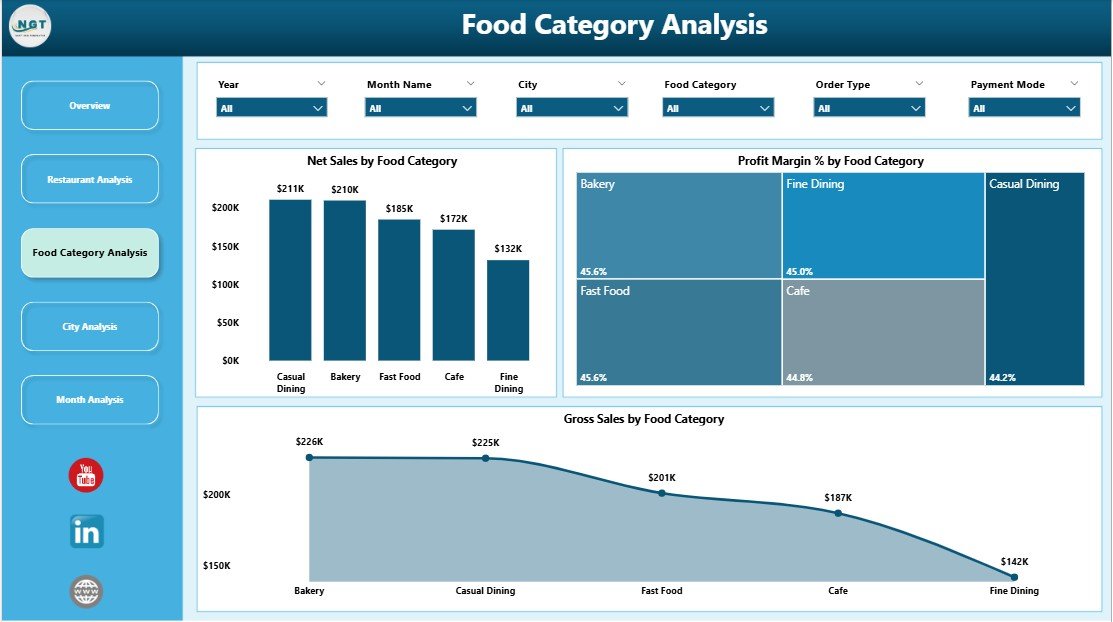
🍔 Food Category Performance Analysis – Optimize menu profitability
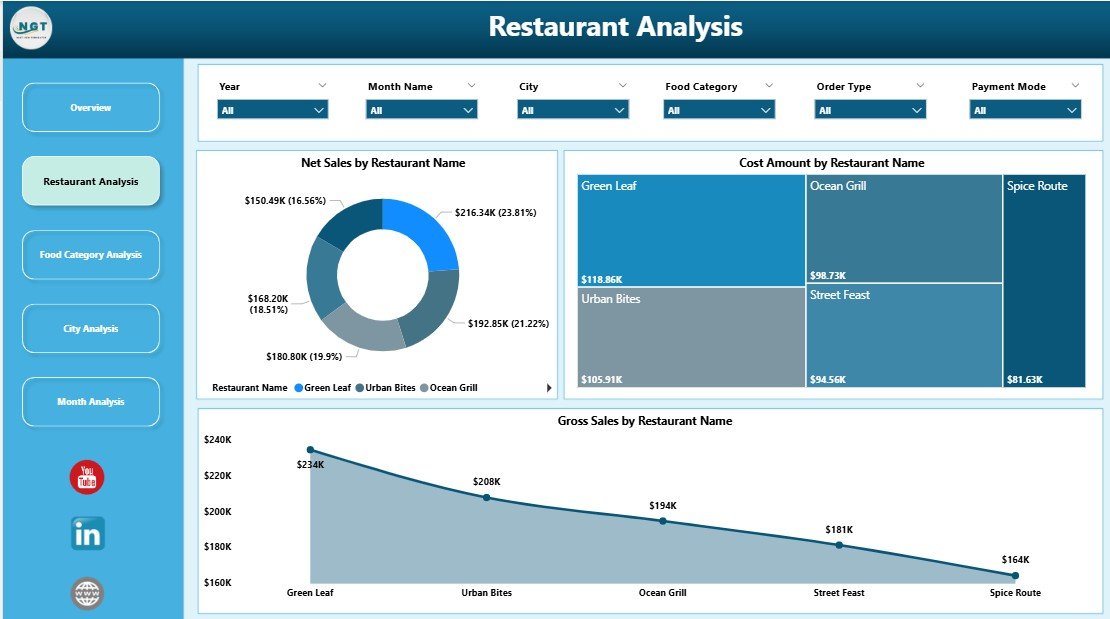
🏪 Restaurant-Wise Comparison – Identify top and low-performing outlets
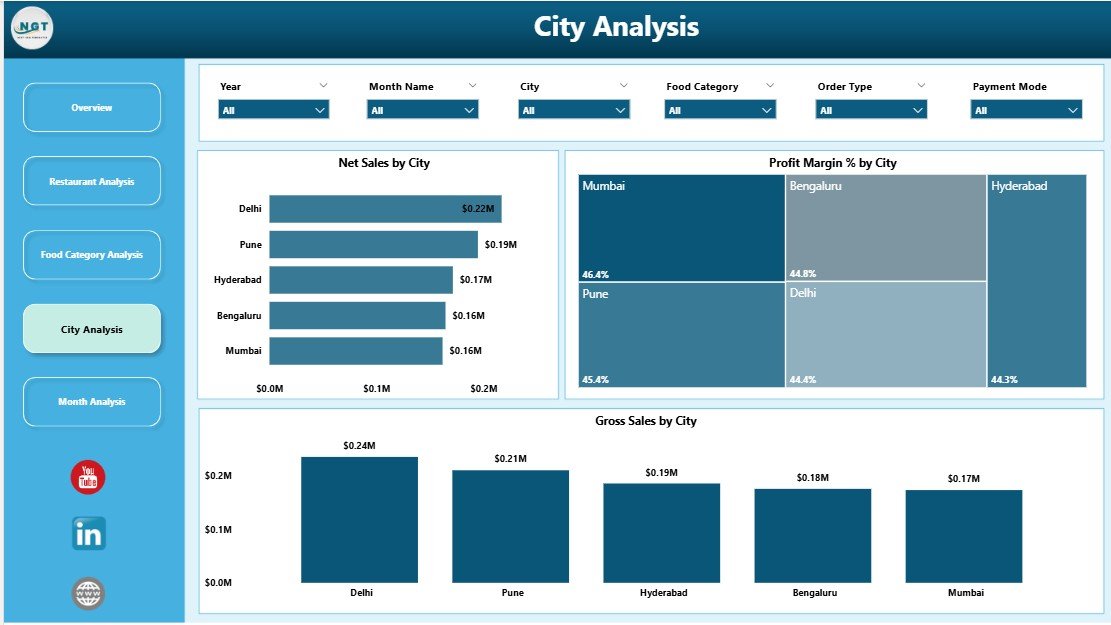
🌆 City-Level Insights – Location-based sales and profit analysis
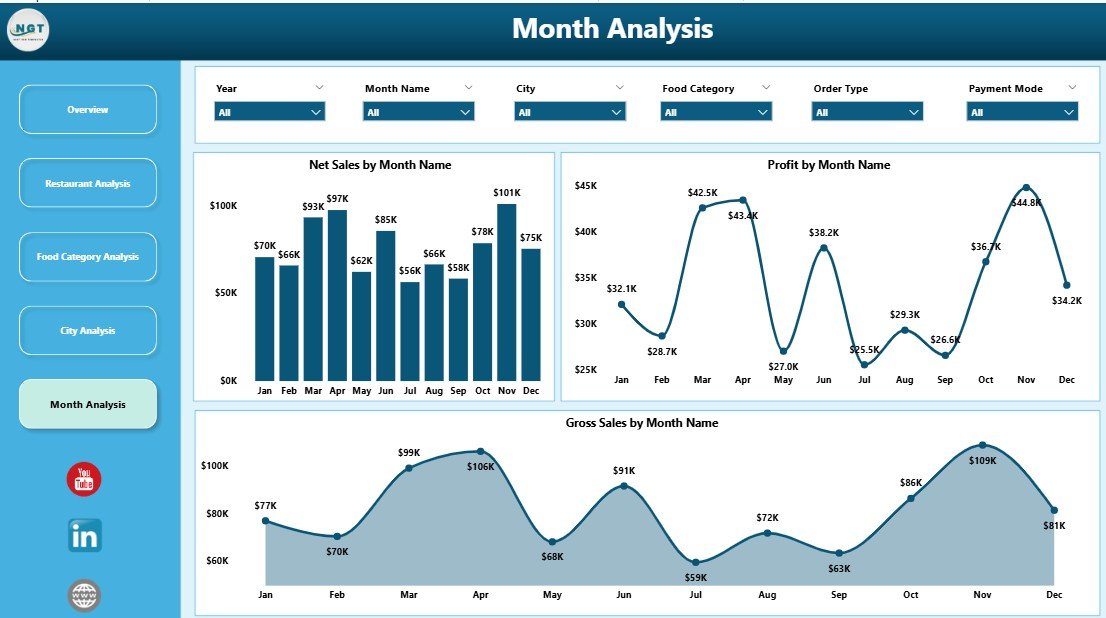
📅 Monthly Trend Analysis – Understand seasonality and growth
⭐ Customer Rating Analysis – Improve service quality
⚡ Power BI Interactive Visuals – Fast, intuitive decision-making
🔄 Excel / POS Data Integration Ready – Easy data refresh
📦 What’s Inside the Restaurants and Food Services Dashboard in Power BI
📁 Power BI (.pbix) Dashboard File with professional restaurant-ready design
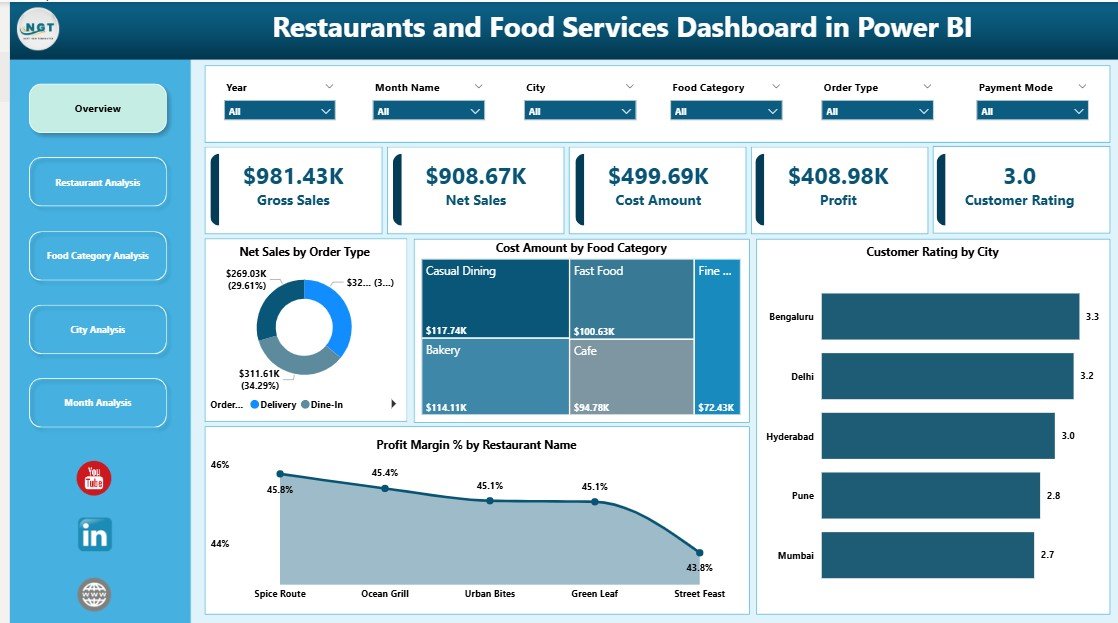
📊 Overview Page – High-level snapshot of restaurant business performance
🏪 Restaurant Analysis Page – Outlet-wise sales, costs, and profits
🍕 Food Category Analysis Page – Menu-level profitability insights
🌆 City Analysis Page – Location-wise performance comparison
📆 Monthly Trends Page – Time-based sales, profit, and cost trends
📄 Structured Data Model – Scalable and easy to maintain
Everything is designed for clarity, scalability, and real-world restaurant decision-making.
🧠 How to Use the Restaurants and Food Services Dashboard in Power BI
1️⃣ Prepare or update restaurant data (sales, costs, ratings, categories, cities)
2️⃣ Connect Excel, database, or POS data to Power BI
3️⃣ Refresh the dashboard
4️⃣ Use interactive slicers to filter insights dynamically
5️⃣ Review KPIs and charts on each analysis page
6️⃣ Identify profit drivers, cost issues, and growth opportunities
No advanced Power BI skills are required. If you can use slicers, you can use this dashboard confidently.
👥 Who Can Benefit from This Restaurants and Food Services Dashboard in Power BI
🍽️ Restaurant Owners & Founders – Monitor business health instantly
🏢 Food Chain & Franchise Managers – Compare outlets and cities
📊 Operations & Finance Teams – Improve cost and margin control
📈 Business Analysts & Consultants – Deliver fast insights
💼 Executives & Decision-Makers – Get one source of truth
This dashboard works perfectly for single restaurants, food chains, franchises, and multi-city food service businesses.
🔗 Click here to read the Detailed Blog Post
🎥 Visit our YouTube channel to learn step-by-step video tutorials
https://www.youtube.com/@PKAnExcelExpert


Reviews
There are no reviews yet.