Managing refinery procurement without a centralized analytics system often leads to delays, cost overruns, invoice disputes, and poor supplier visibility. Refineries deal with high-value purchase orders, multiple suppliers, strict delivery timelines, and continuous operational pressure. When procurement data is scattered across spreadsheets and manual reports, decision-making becomes slow and reactive.
That is exactly why the Refinery Procurement Dashboard in Power BI is a powerful and essential solution. 🚀
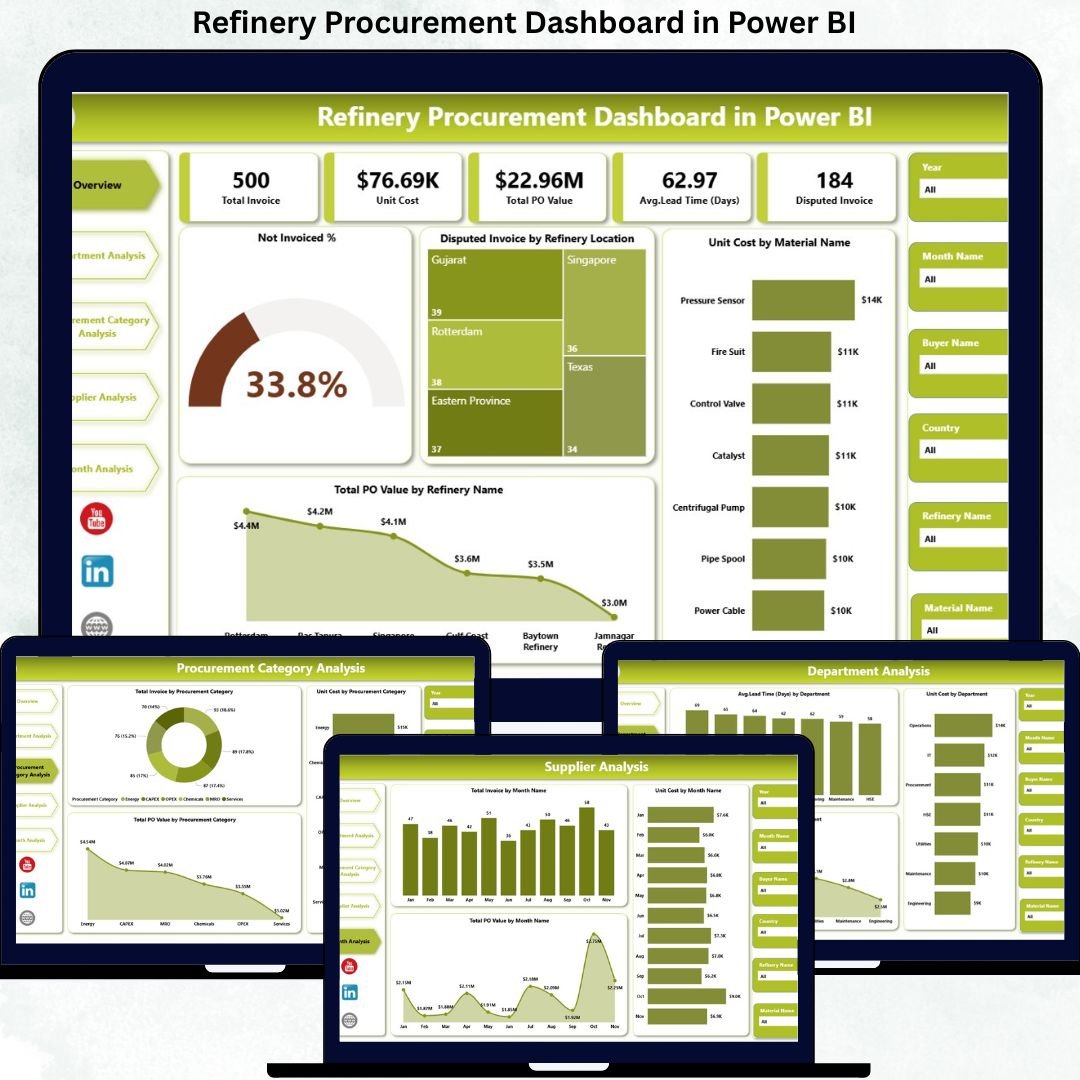
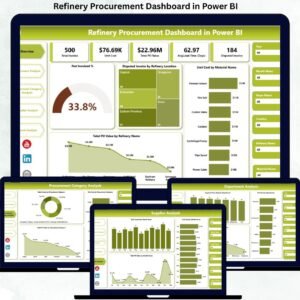
This professionally designed Power BI dashboard transforms complex procurement data into clear KPIs, interactive charts, and actionable insights. As a result, procurement teams gain full visibility into purchase orders, invoices, suppliers, lead times, and unit costs — all from one centralized dashboard.
Built for refinery operations, this dashboard helps organizations move from manual tracking to proactive, data-driven procurement management.
Key Features of Refinery Procurement Dashboard in Power BI 🔑
📊 Centralized Procurement Visibility
Monitor all procurement KPIs, purchase orders, invoices, and suppliers in one interactive dashboard.
📈 Real-Time Performance Tracking
Instantly track Not Invoiced %, Disputed Invoice Value, Unit Cost, and Total PO Value.
🧭 Interactive Slicers & Filters
Analyze procurement data by refinery location, department, supplier, category, material, and month.
📉 Department, Category & Supplier Insights
Identify cost-intensive departments, high-spend categories, and underperforming suppliers quickly.
📅 Monthly Trend Analysis
Track procurement trends over time to detect seasonal patterns and cost fluctuations.
⚡ Faster Decision-Making
Visual insights eliminate manual reporting delays and support quick corrective actions.
💼 Management-Ready Reporting
Perfect for procurement reviews, audits, and leadership decision meetings.
What’s Inside the Refinery Procurement Dashboard in Power BI 📁
This ready-to-use Power BI solution includes five professionally designed analytical pages, each focused on a critical procurement dimension.
📄 Overview Page
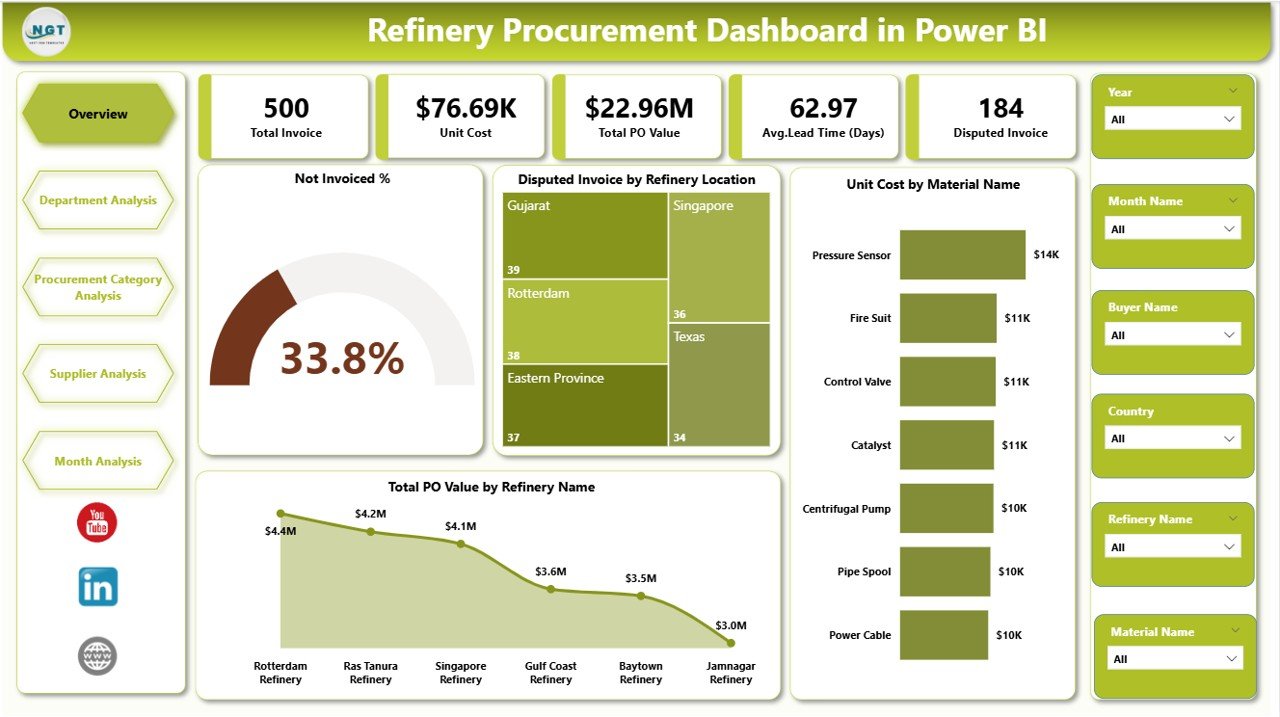
The central monitoring page that provides an instant snapshot of procurement health.
Includes:
-
KPI Cards: Not Invoiced %, Disputed Invoice Value
-
Not Invoiced %
-
Disputed Invoice by Refinery Location
-
Unit Cost by Material Name
-
Total PO Value by Refinery Name
This page allows leadership to quickly identify invoice risks and cost concentration areas.
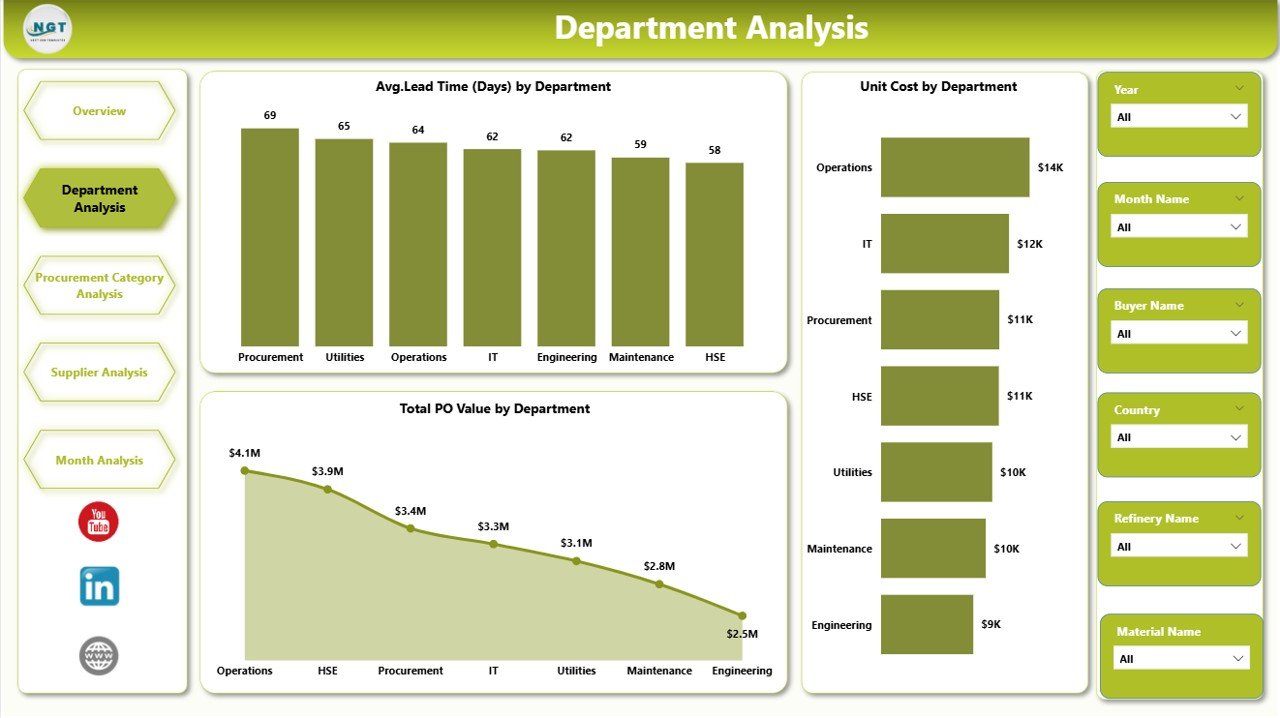
📄 Department Analysis Page
Focuses on procurement efficiency at the department level.
Includes:
-
Average Lead Time by Department
-
Unit Cost by Department
-
Total PO Value by Department
Helps identify departments causing delays or higher procurement costs.
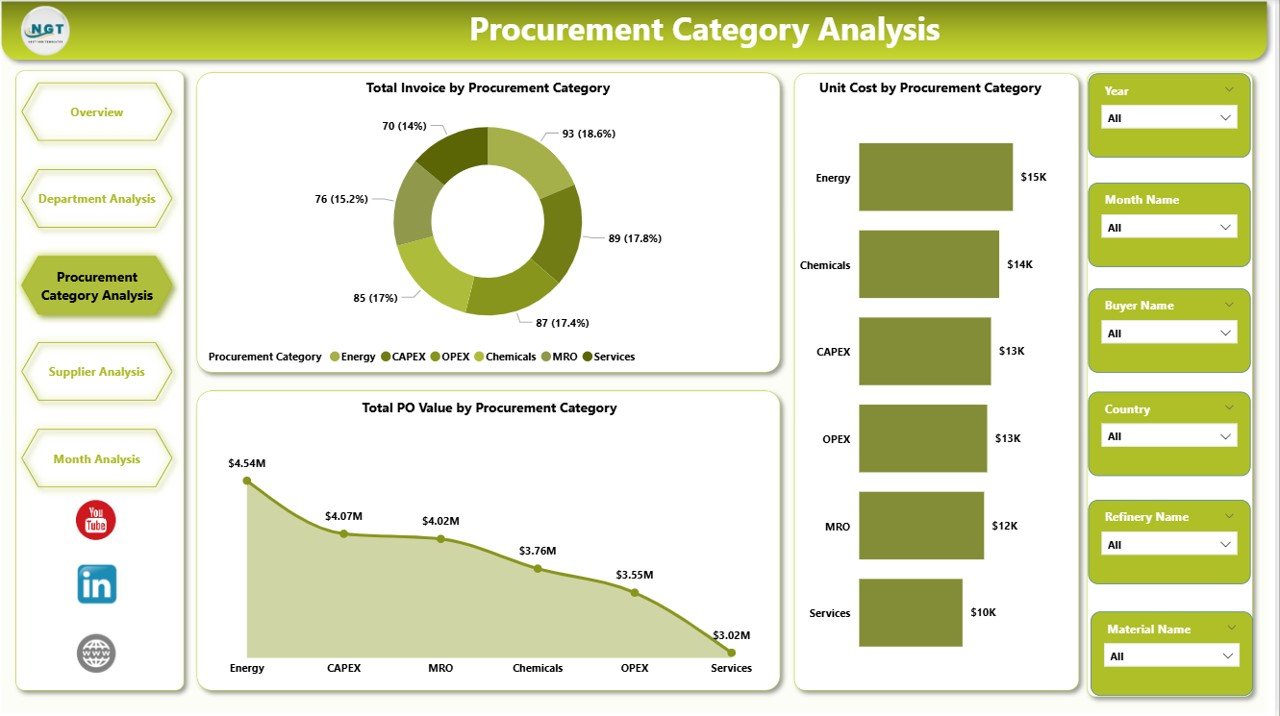
📄 Procurement Category Analysis Page
Analyzes spending and efficiency by procurement category.
Includes:
-
Total Invoice by Procurement Category
-
Unit Cost by Procurement Category
-
Total PO Value by Procurement Category
Supports category-wise sourcing optimization and cost control.
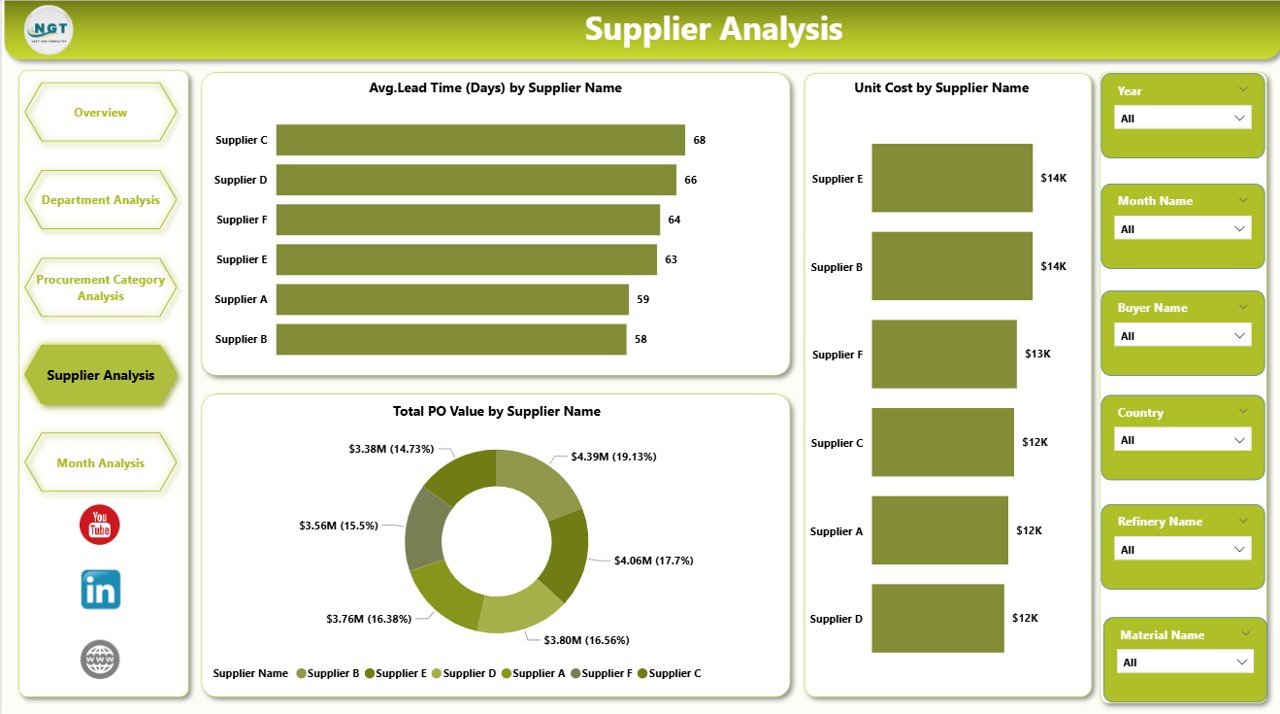
📄 Supplier Analysis Page
Evaluates supplier performance and reliability.
Includes:
-
Average Lead Time by Supplier Name
-
Unit Cost by Supplier Name
-
Total PO Value by Supplier Name
Enables procurement teams to strengthen relationships with high-performing suppliers and address inefficiencies.
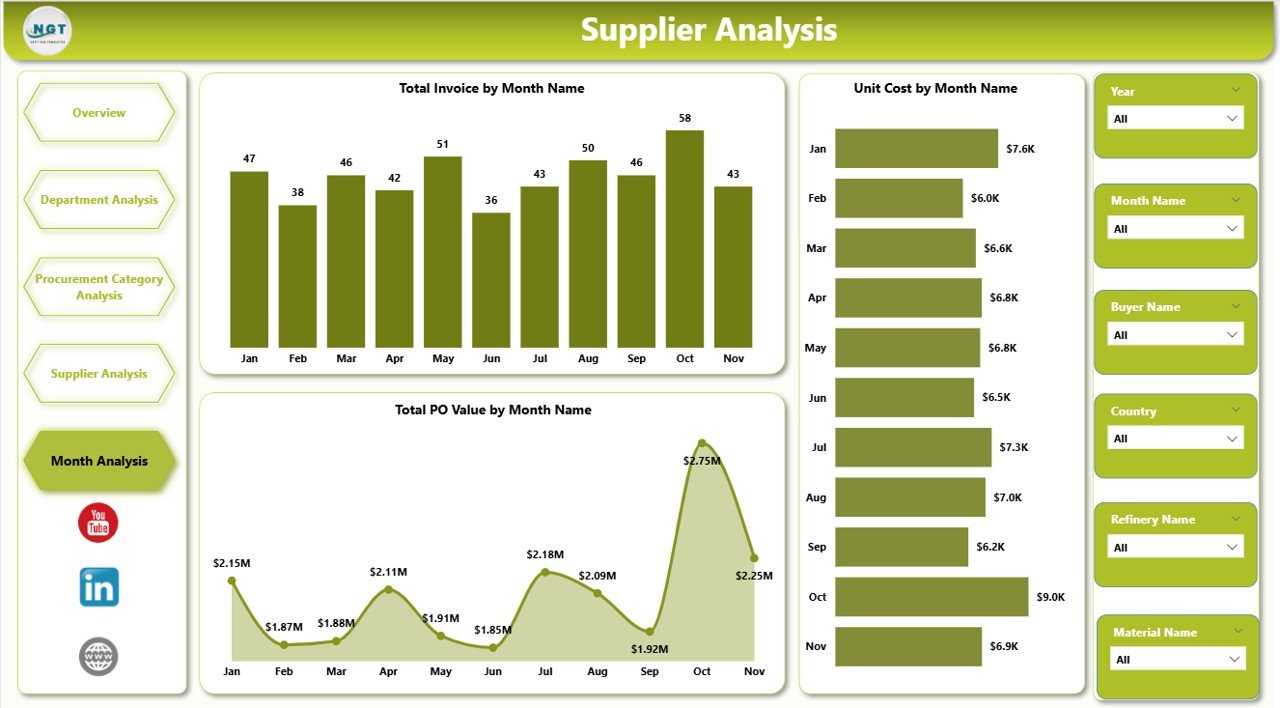
📄 Monthly Trends Page
Tracks procurement performance over time.
Includes:
-
Total Invoice by Month
-
Unit Cost by Month
-
Total PO Value by Month
Supports forecasting, budgeting, and long-term procurement planning.
How to Use the Refinery Procurement Dashboard in Power BI 🛠️
1️⃣ Load procurement data from Excel or connected systems
2️⃣ Refresh the Power BI dashboard
3️⃣ Use slicers to filter by refinery, department, supplier, or month
4️⃣ Review KPIs, cost trends, and invoice status
5️⃣ Use insights for negotiations, approvals, and planning
No advanced technical skills are required. The dashboard is intuitive and user-friendly.
Who Can Benefit from This Refinery Procurement Dashboard 👥
🏭 Procurement Managers – Gain full control over purchasing operations
📦 Supply Chain Teams – Monitor lead time and supplier efficiency
💰 Finance & Cost Control Teams – Track invoices and spending accurately
📊 Operations Managers – Improve procurement planning
👔 Senior Management – Make confident, data-driven decisions
Suitable for both small and large refinery procurement environments.


Reviews
There are no reviews yet.