Port tender management is complex, high-value, and time-sensitive. Port authorities, logistics operators, and maritime infrastructure companies handle multiple tenders involving different ports, cargo types, vendors, bid cycles, and financial risks. When this information remains scattered across Excel files, emails, and PDFs, visibility drops and decisions slow down. Profit opportunities get missed, risks increase, and vendor evaluation becomes guesswork.
That is exactly why the Port Tender Dashboard in Excel becomes a powerful and practical solution.
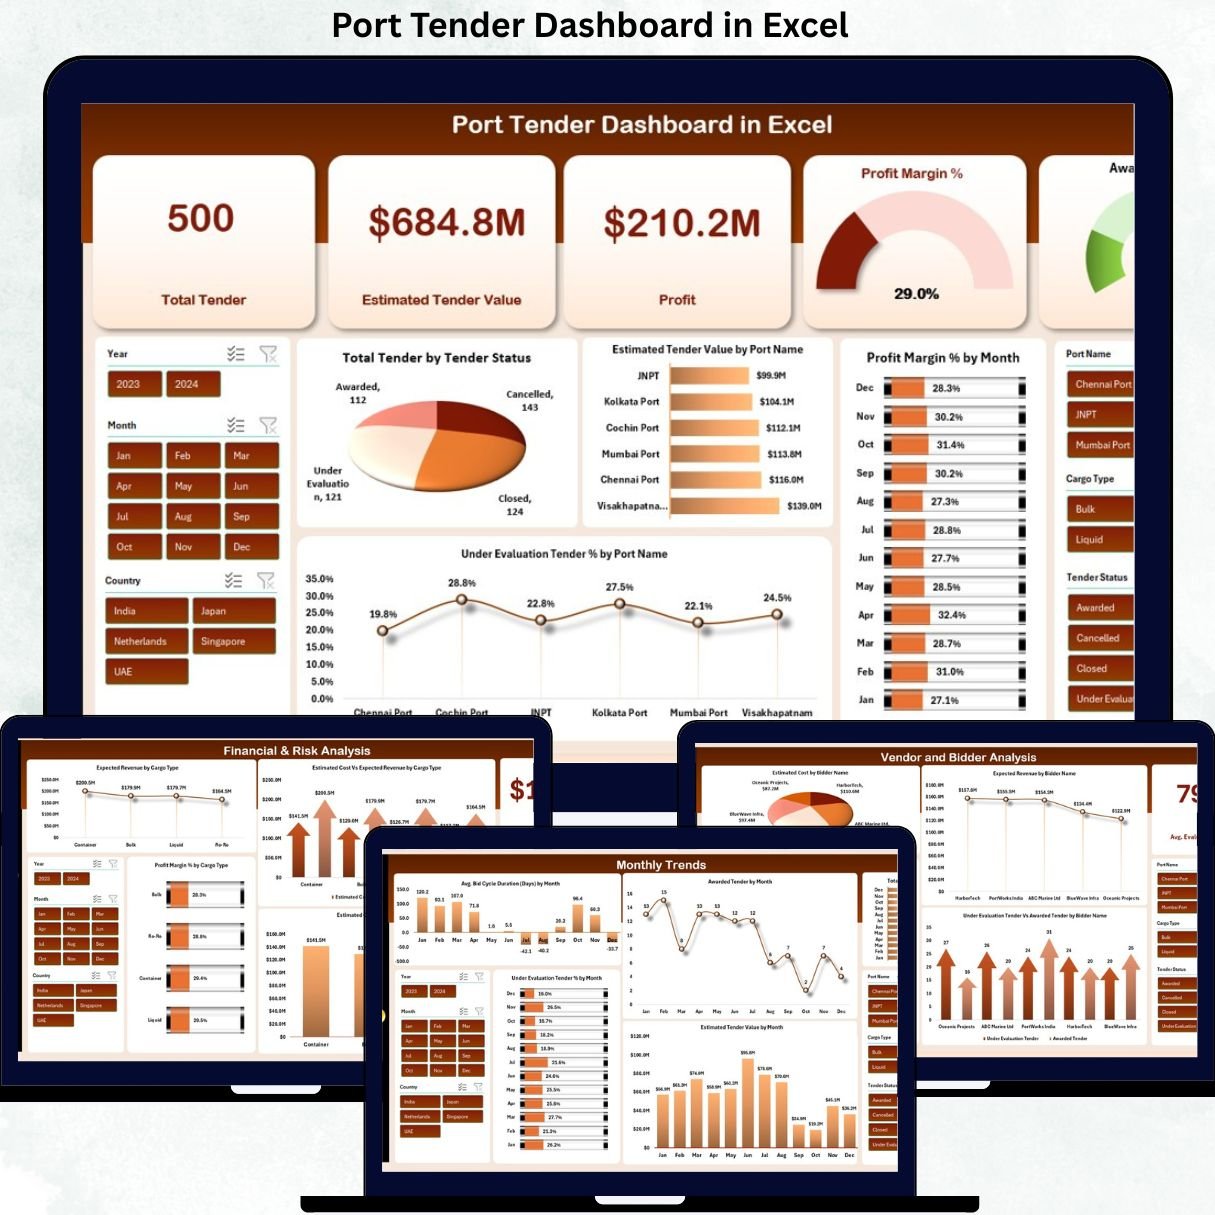
This ready-to-use Excel dashboard converts raw tender data into structured, visual, and decision-ready insights. It enables management teams to monitor tender status, track profitability, evaluate vendors, analyze cargo-wise risk, and understand monthly trends—all from one centralized Excel dashboard. Instead of manually reviewing tender sheets, leadership teams gain instant clarity with interactive charts and KPI cards.
Because the dashboard is built in Excel, it requires no expensive BI tools and can be customized easily to match your tender structure.
✨ Key Features of the Port Tender Dashboard in Excel
📊 1. Executive-Level KPI Snapshot
The dashboard displays key performance indicators that give management an instant overview of tender scale, profitability, and success rate.
📈 2. Multi-Dimensional Tender Analysis
Analyze tenders by port, vendor, cargo type, status, and time period using interactive visuals.
💰 3. Profit & Margin Tracking
Track expected profit and profit margin % across ports, bidders, and cargo segments to support smarter bidding decisions.
🏗️ 4. Vendor & Bidder Performance Evaluation
Compare bidders based on cost, revenue potential, award success, and margin contribution.
📅 5. Monthly Trend & Risk Monitoring
Identify delays, long bid cycles, and under-evaluation bottlenecks before they impact revenue.
📦 What’s Inside the Port Tender Dashboard in Excel
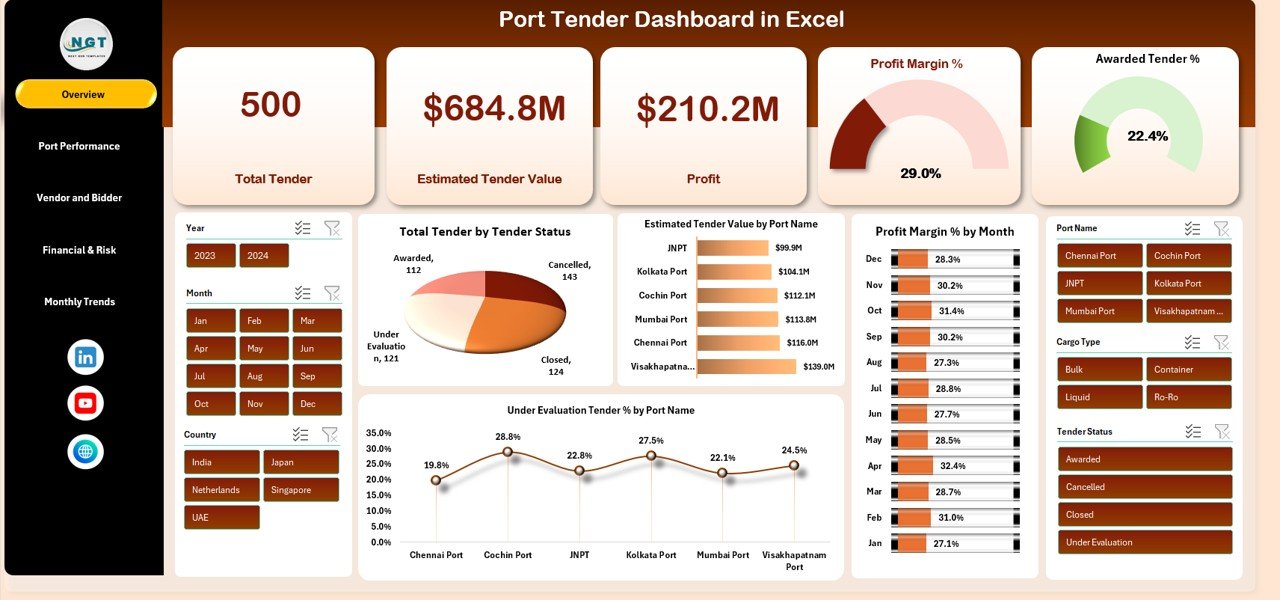
🖥️ Overview Sheet – Executive Summary
This is the main landing page designed for senior leadership.
KPI Cards Included
-
Total Tenders – Total number of tenders tracked
-
Estimated Tender Value – Combined value of all tenders
-
Profit – Expected profit from awarded and potential tenders
-
Profit Margin % – Overall profitability ratio
-
Awarded Tender % – Tender success rate
Charts on Overview Page
-
Total Tender by Tender Status – Awarded, Under Evaluation, Open, Closed
-
Estimated Tender Value by Port Name – Identifies high-value ports
-
Profit Margin % by Month – Tracks monthly efficiency trends
-
Under Evaluation Tender % by Port Name – Highlights approval bottlenecks
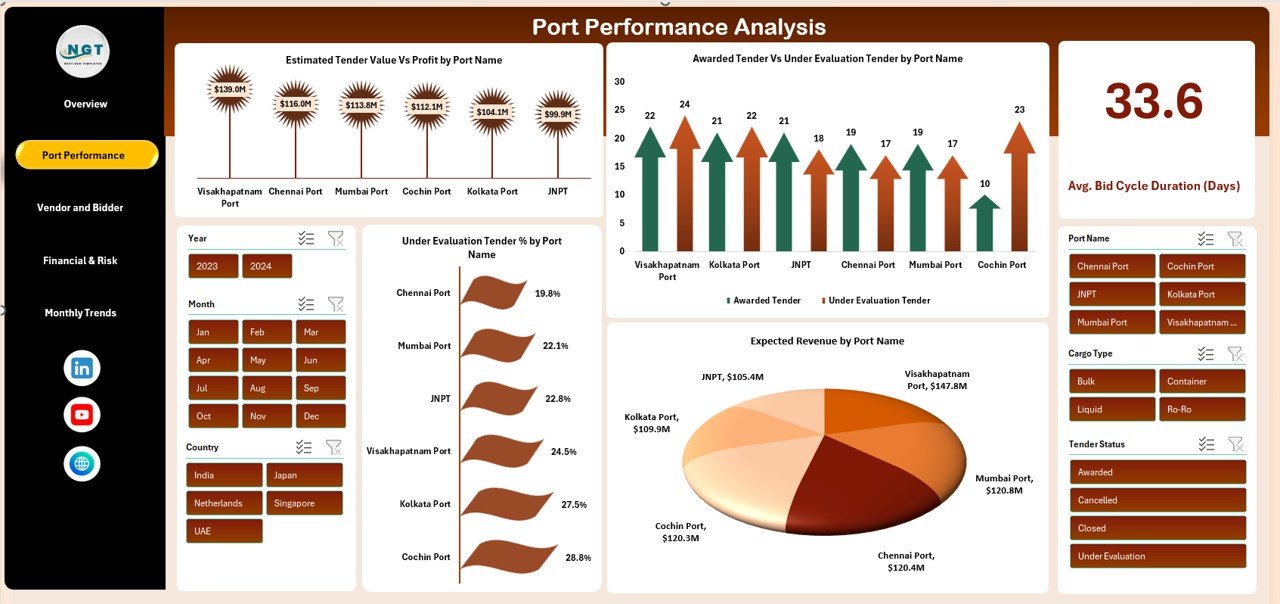
🚢 Port Performance Analysis
This section evaluates port-wise performance to support strategic planning.
Charts Included
-
Estimated Tender Value vs Profit by Port Name – Identify high-value, low-margin ports
-
Awarded vs Under Evaluation Tender by Port Name – Measure conversion efficiency
-
Expected Revenue by Port Name – Focus on revenue-driving ports
-
Under Evaluation Tender % by Port Name – Detect process delays
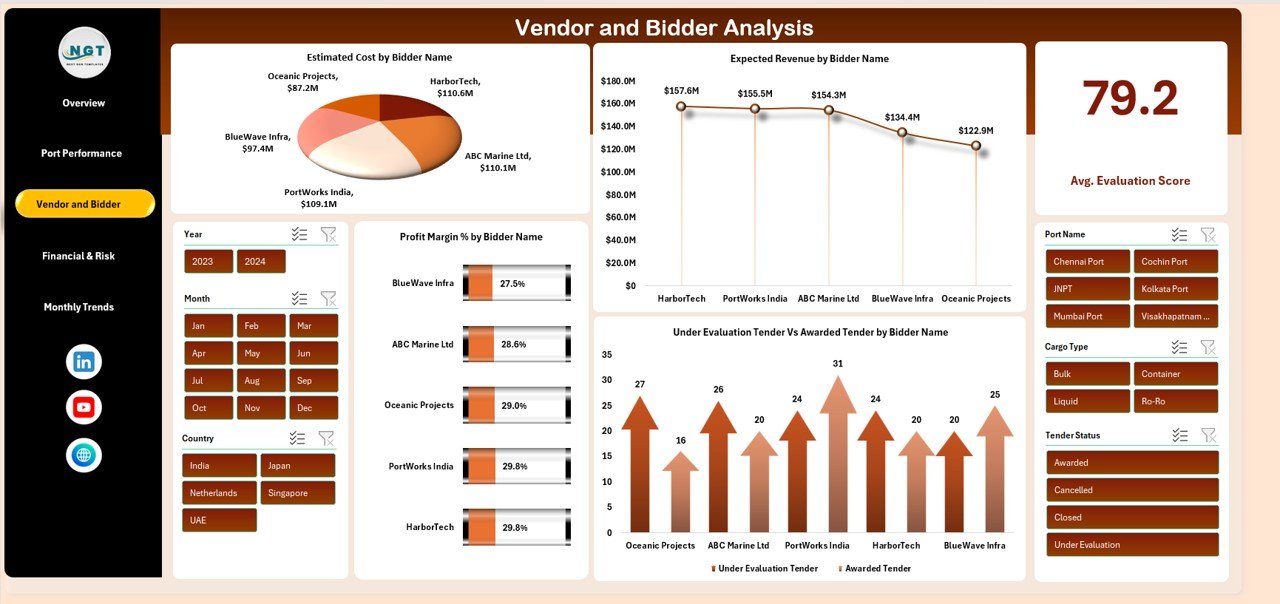
🤝 Vendor and Bidder Analysis
Vendor selection plays a critical role in tender success and profitability.
Charts Included
-
Estimated Cost by Bidder Name – Compare bidder cost structures
-
Expected Revenue by Bidder Name – Identify high-revenue vendors
-
Under Evaluation vs Awarded Tender by Bidder Name – Track vendor success rates
-
Profit Margin % by Bidder Name – Highlight margin-efficient bidders
This analysis supports data-driven vendor negotiations and selection.
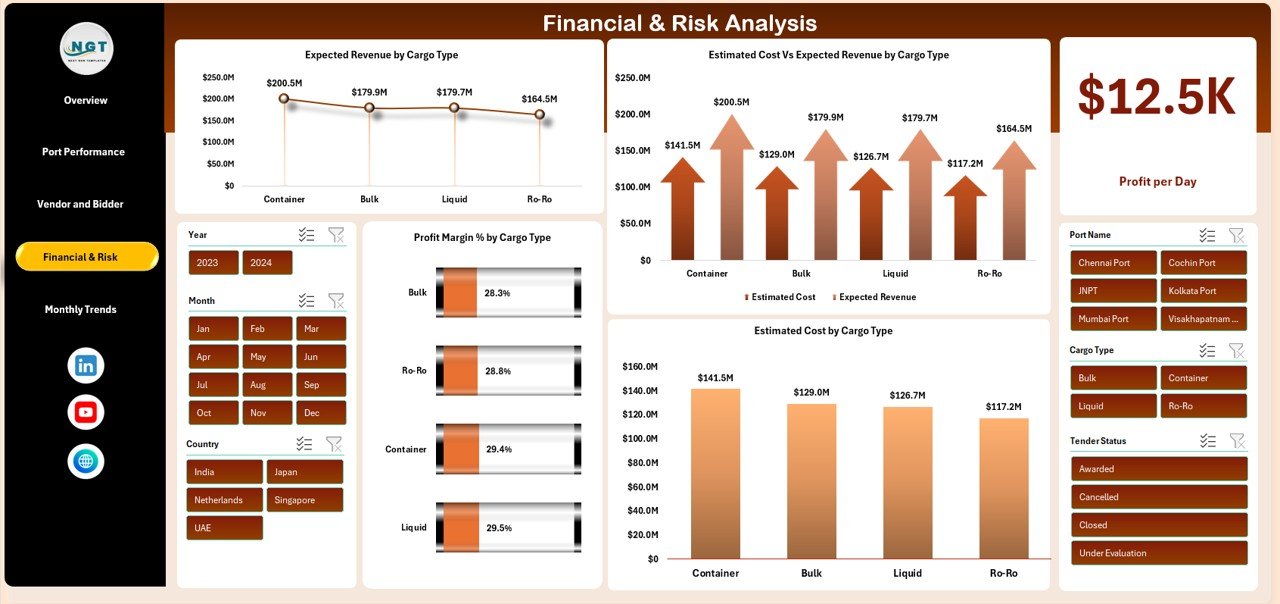
💼 Financial & Risk Analysis
This section focuses on cargo-wise exposure and profitability.
Charts Included
-
Expected Revenue by Cargo Type
-
Estimated Cost vs Expected Revenue by Cargo Type
-
Estimated Cost by Cargo Type
-
Profit Margin % by Cargo Type
It helps identify high-margin cargo segments and control financial risk.
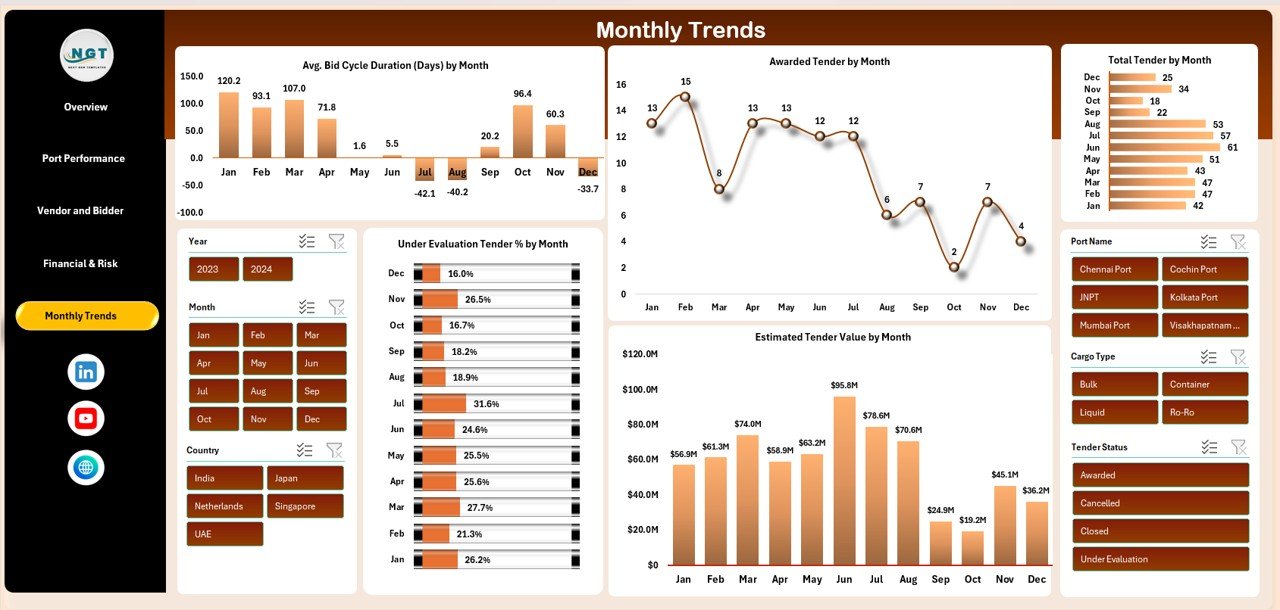
📅 Monthly Trends Analysis
Track tender performance over time using monthly trend visuals.
Charts Included
-
Average Bid Cycle Duration (Days) by Month
-
Awarded Tender by Month
-
Estimated Tender Value by Month
-
Under Evaluation Tender % by Month
This section helps improve process efficiency and forecasting.
🎯 Who Can Benefit from This Port Tender Dashboard in Excel
⚓ Port Authorities
Gain complete visibility into tender pipelines and performance.
🚚 Logistics & Shipping Companies
Track profitability, risk, and vendor performance accurately.
🏗️ Infrastructure Contractors
Evaluate tender opportunities with better financial clarity.
📊 Finance & Tender Teams
Monitor margins, costs, and exposure continuously.
🏢 Senior Leadership
Make faster, data-backed strategic decisions.
### Click here to read the Detailed blog post
Watch the step-by-step video tutorial:


Reviews
There are no reviews yet.