Managing electricity tenders is complex, data-heavy, and time-sensitive. Utilities, EPC contractors, and procurement teams must evaluate bid values, estimate project costs, track awarded tenders, and monitor profitability—all while ensuring transparency and accuracy. However, when tender data is scattered across multiple spreadsheets, decision-making becomes slow, inconsistent, and risky.
That is exactly why the Electricity Tender Dashboard in Excel becomes a powerful and practical solution.
This ready-to-use Excel dashboard transforms raw electricity tender data into clear KPIs, interactive visuals, and actionable insights. Instead of spending hours compiling reports, stakeholders gain instant visibility into bid performance, profit margins, success rates, regional trends, and monthly patterns. As a result, organizations move from reactive tender tracking to proactive, data-driven tender strategy.
🔑 Key Features of Electricity Tender Dashboard in Excel
📊 Centralized Tender Performance Tracking
Monitor all electricity tenders in one structured Excel dashboard.
💰 Bid Value, Cost & Profit Visibility
Track bid values, estimated project costs, profit amounts, and margins clearly.
🎯 Bid Success Rate Monitoring
Understand how many tenders are successful and where improvements are needed.
🌍 Region, Utility & Tender-Type Analysis
Analyze tender performance across regions, utility companies, and tender categories.
📅 Monthly Trend Analysis
Identify seasonality, bidding cycles, and performance fluctuations over time.
🧭 Interactive Slicers & Page Navigator
Filter data dynamically and move across pages easily without touching formulas.
⚙️ 100% Excel-Based & Customizable
No macros required—easy to modify, extend, and maintain.
📦 What’s Inside the Electricity Tender Dashboard in Excel
This professional dashboard includes five powerful analytical pages, supported by structured backend sheets:
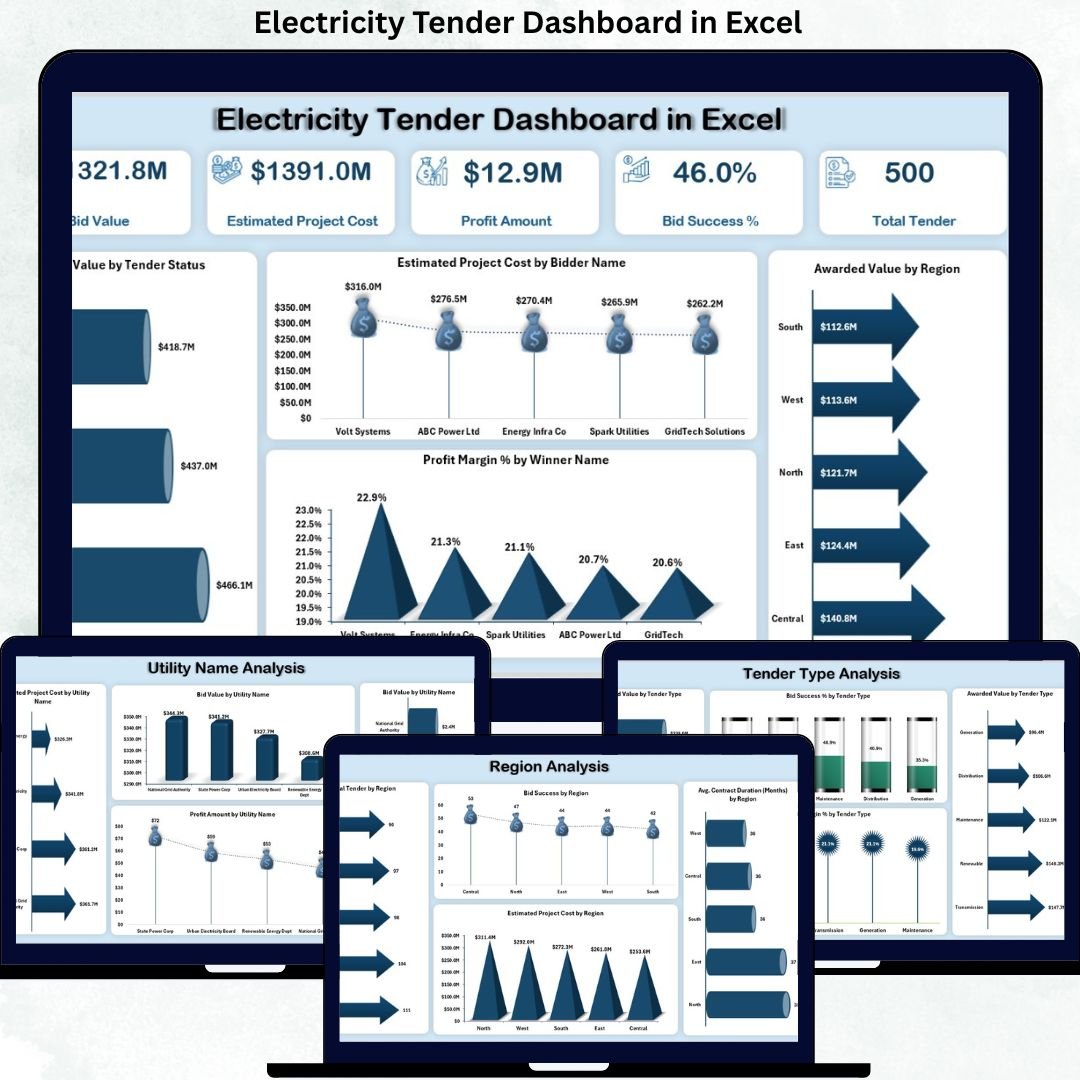
📊 Overview Page
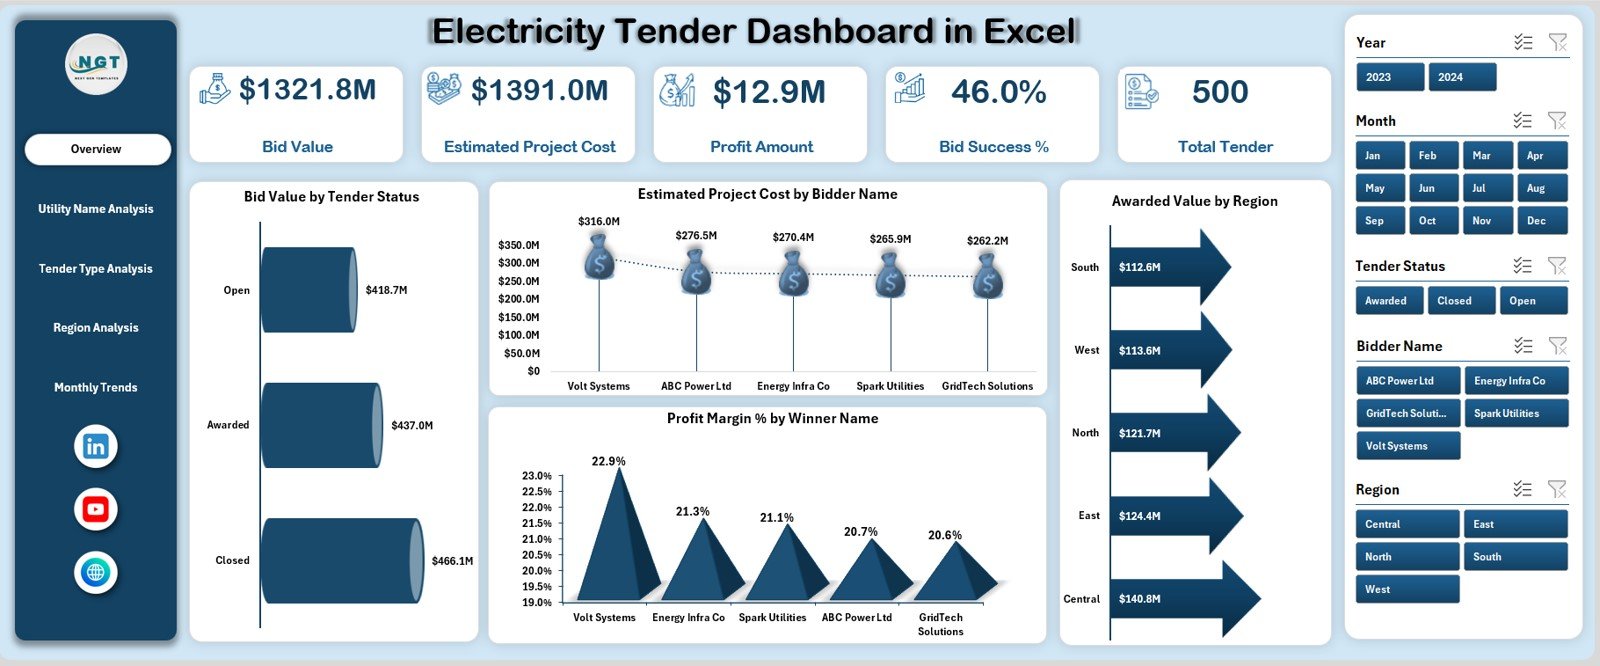
Acts as the executive summary with KPI cards showing:
-
Bid Value
-
Estimated Project Cost
-
Profit Amount
-
Bid Success
-
Total Tenders
Includes charts for:
-
Bid Value by Tender Status
-
Estimated Project Cost by Bidder Name
-
Awarded Value by Region
-
Profit Margin % by Winner Name
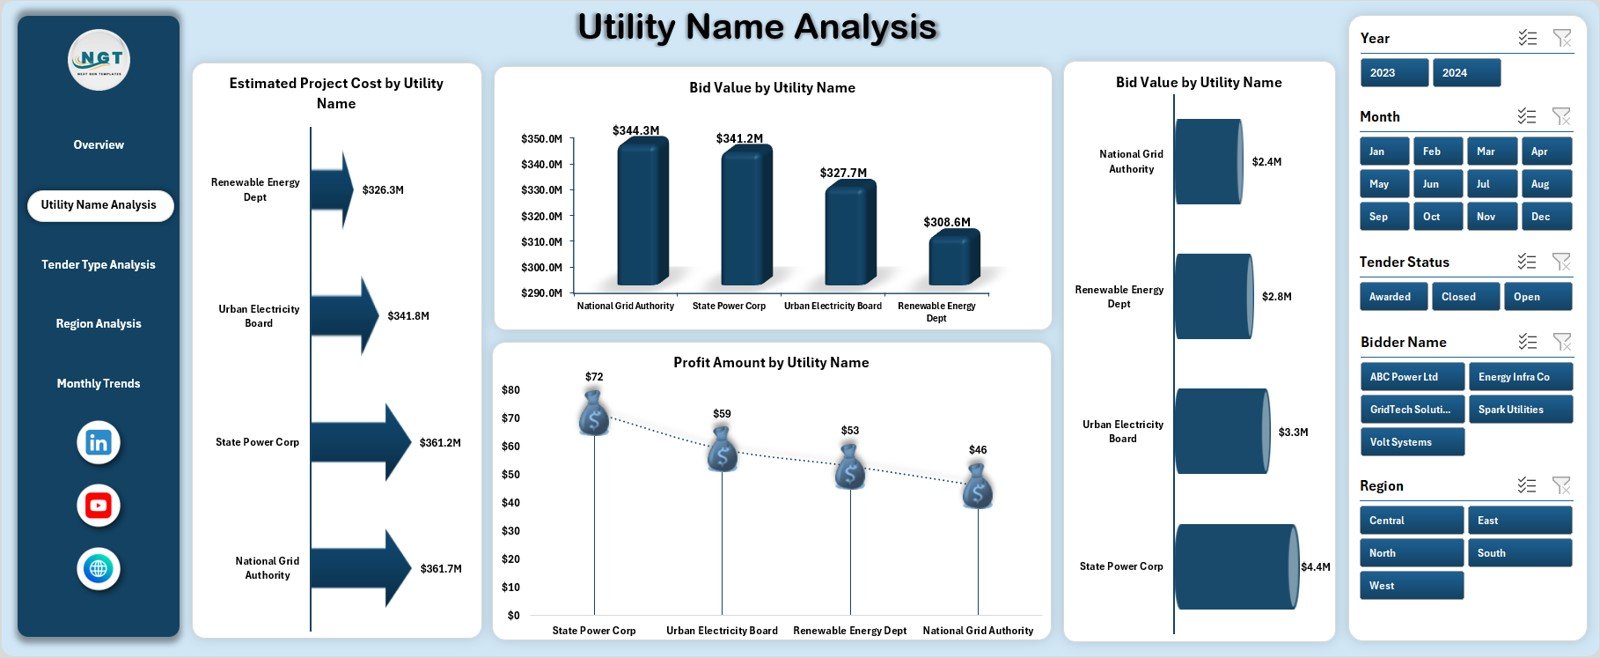
🏢 Utility Name Analysis Page
Provides utility-wise insights using:
-
Estimated Project Cost by Utility
-
Bid Value by Utility
-
Awarded Value by Utility
-
Profit Amount by Utility
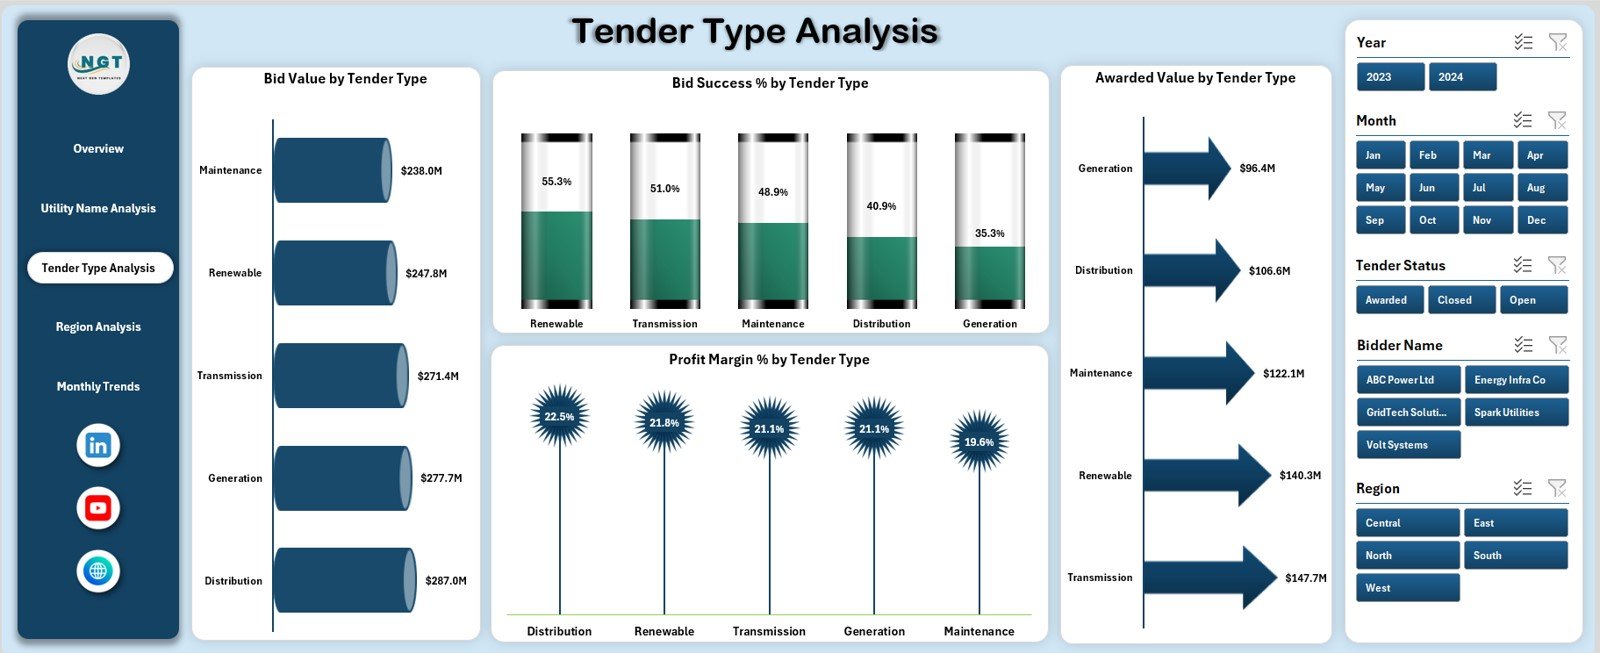
📑 Tender Type Analysis Page
Evaluates performance by tender category with:
-
Bid Value by Tender Type
-
Bid Success % by Tender Type
-
Awarded Value by Tender Type
-
Profit Margin % by Tender Type
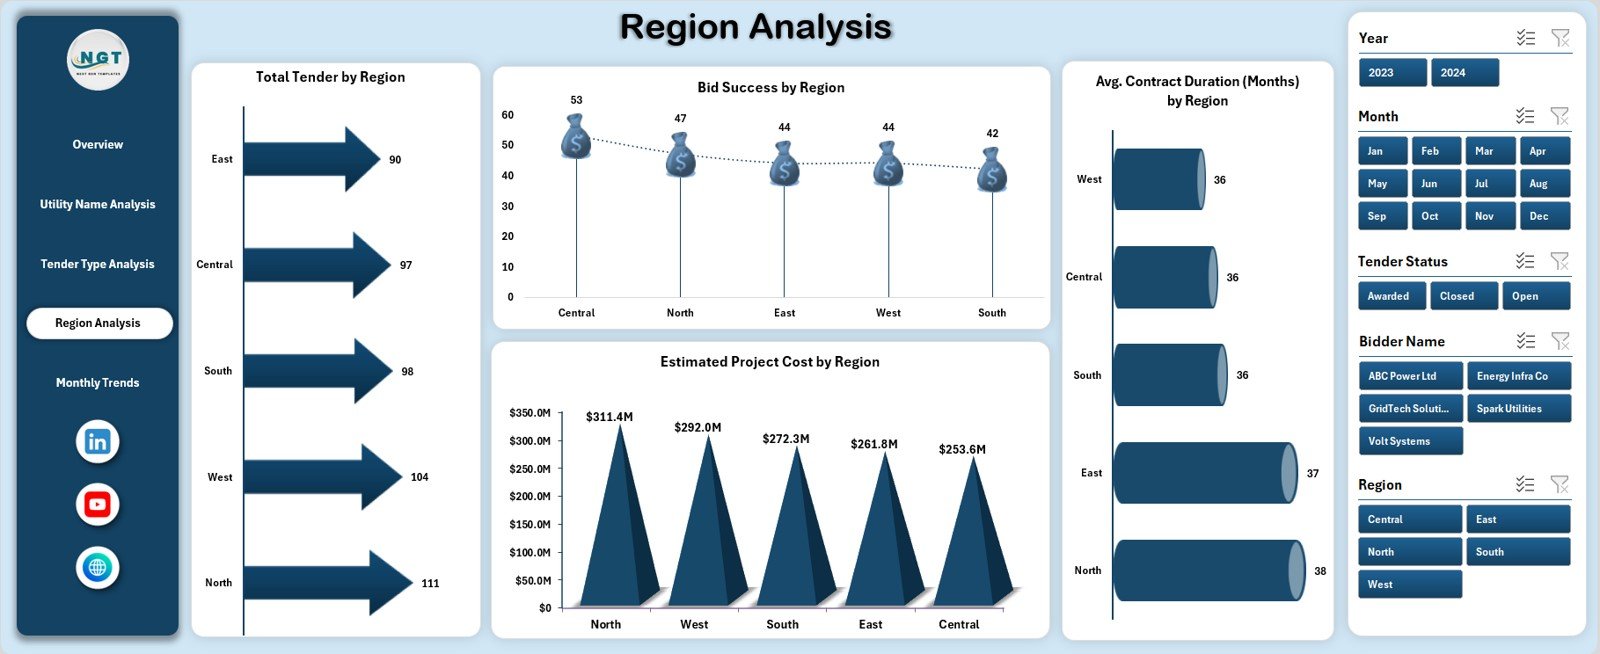
🌍 Region Analysis Page
Focuses on geographic performance using:
-
Total Tenders by Region
-
Bid Success by Region
-
Estimated Project Cost by Region
-
Average Contract Duration by Region
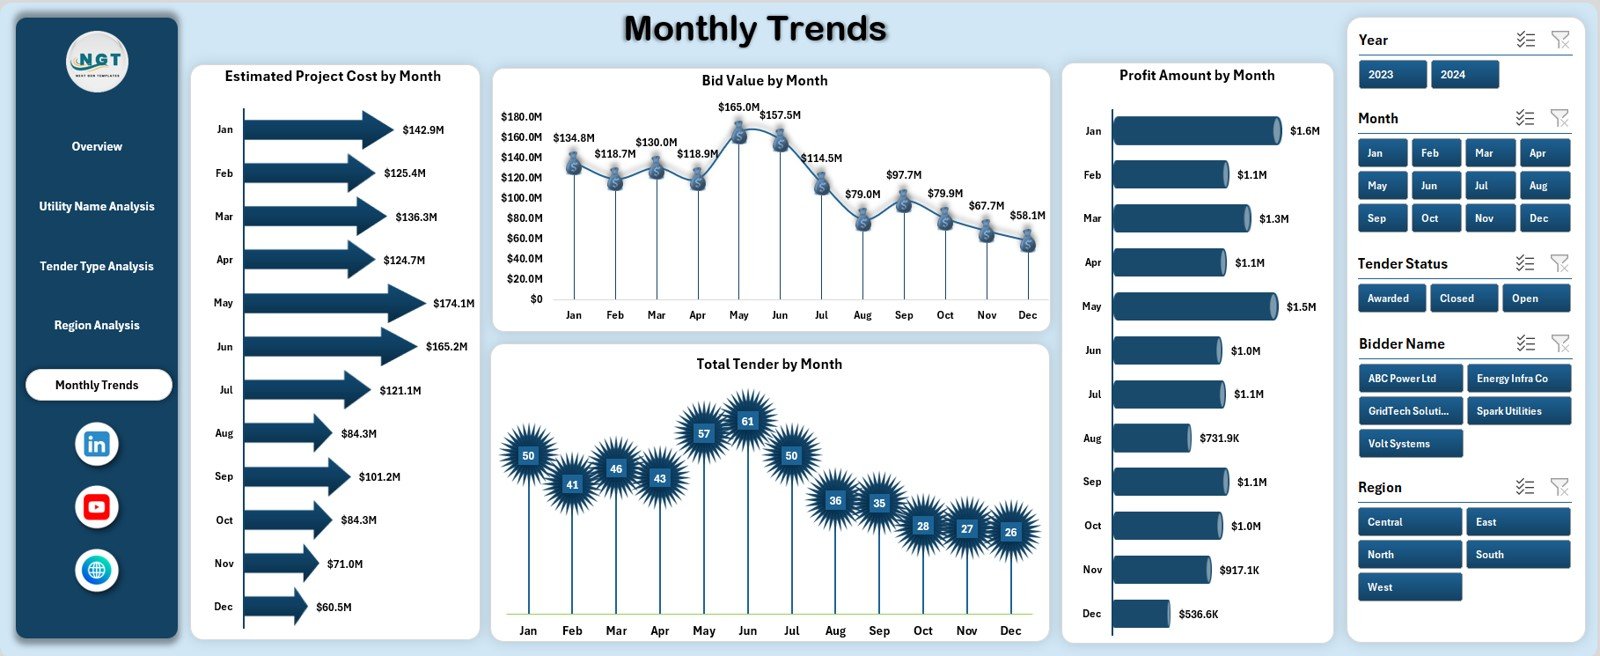
📅 Monthly Trends Page
Highlights time-based insights through:
-
Estimated Project Cost by Month
-
Bid Value by Month
-
Profit Amount by Month
-
Total Tenders by Month
🗂️ Data Sheet
Stores all raw tender data in a structured format.
🧩 Support Sheet
Contains helper calculations, validation lists, and backend logic to keep the dashboard clean and scalable.
▶️ How to Use the Electricity Tender Dashboard in Excel
Using the dashboard is simple and practical:
1️⃣ Enter or update tender data in the Data Sheet
2️⃣ Refresh pivot tables if required
3️⃣ Use slicers to filter by region, utility, tender type, status, or month
4️⃣ Review KPIs and charts on the Overview Page
5️⃣ Analyze utilities, regions, and tender types
6️⃣ Track monthly trends and seasonality
7️⃣ Make informed bidding and procurement decisions
No advanced Excel skills or macros are required.
🎯 Who Can Benefit from This Electricity Tender Dashboard in Excel
⚡ Electricity Distribution Companies – Improve tender visibility and control
🏗️ EPC & Power Contractors – Optimize bidding strategies and margins
🏛️ Government Procurement Teams – Ensure transparency and accountability
💼 Tender & Bid Management Teams – Track success rates and performance
💰 Finance & Commercial Teams – Analyze cost and profit drivers
📊 Energy Consultants – Deliver insights to clients quickly
The dashboard supports both operational execution and strategic planning.
👉 Click here to read the Detailed Blog Post
🔔 Visit our YouTube channel to learn step-by-step video tutorials
👉 YouTube.com/@PKAnExcelExpert


Reviews
There are no reviews yet.