Managing a loan portfolio requires constant attention to performance, risk, and portfolio quality. Financial institutions such as banks, NBFCs, MFIs, and credit unions handle thousands of loans across products, regions, and customer segments. Without a structured system, tracking delinquency, repayments, defaults, and growth becomes difficult. Manual spreadsheets and scattered reports often delay decisions and increase risk exposure. The Loan Portfolio KPI Dashboard in Google Sheets solves this challenge with a centralized, automated, and data-driven monitoring solution.
This ready-to-use dashboard transforms raw loan data into meaningful KPIs, comparisons, and trends. Credit teams, finance managers, risk officers, and leadership can instantly view portfolio health, track Month-to-Date (MTD) and Year-to-Date (YTD) performance, and compare results against targets and previous-year benchmarks. Because the dashboard runs entirely in Google Sheets, it is cost-effective, easy to maintain, and accessible from anywhere.
✨ Key Features of the Loan Portfolio KPI Dashboard in Google Sheets
📊 Centralized Loan Performance Monitoring
Track all critical loan KPIs in one place, eliminating dependency on multiple reports and manual calculations.
📈 MTD & YTD KPI Tracking
Monitor Month-to-Date and Year-to-Date performance instantly for better short-term and long-term analysis.
🎯 Target vs Actual & YOY Comparison
Compare actual portfolio performance against defined targets and previous-year results to identify gaps early.
📉 KPI Trend Analysis
Analyze month-wise trends for each KPI to understand delinquency patterns, repayment behavior, and portfolio stability.
🔄 Automated Calculations & Visual Indicators
Conditional formatting with up/down arrows highlights favorable and unfavorable movements at a glance.
🤝 Real-Time Collaboration
Multiple users can update and review the dashboard simultaneously using Google Sheets.
📦 What’s Inside the Loan Portfolio KPI Dashboard
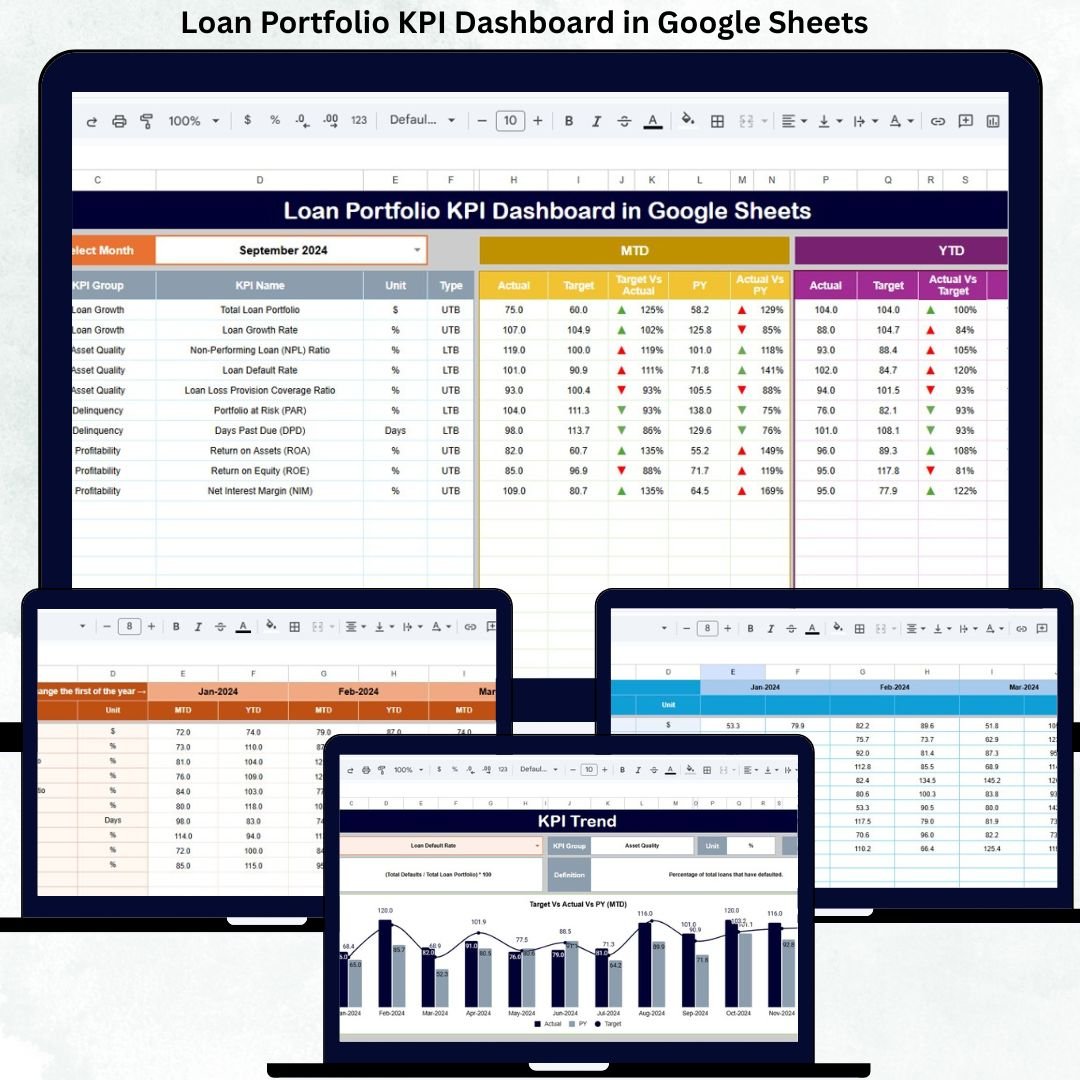
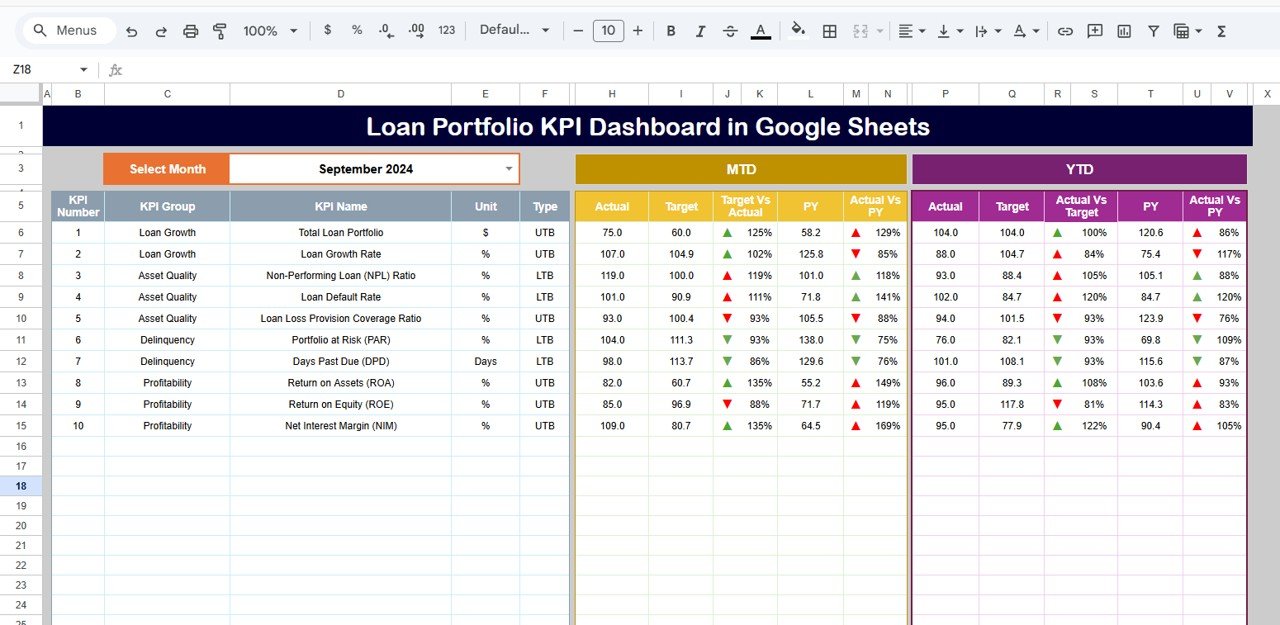
🖥 Dashboard Sheet Tab – Executive Portfolio Overview
This is the main control panel of the dashboard. Users select the reporting month from a dropdown in cell D3, and the entire dashboard updates automatically.
Displayed Metrics Include:
MTD KPIs
-
Actual
-
Target
-
Previous Year
-
Target vs Actual
-
Previous Year vs Actual
YTD KPIs
-
Actual
-
Target
-
Previous Year
-
Target vs Actual
-
Previous Year vs Actual
Visual Indicators
-
🟢 Green Arrow → Favorable performance
-
🔴 Red Arrow → Unfavorable performance
This sheet enables leadership to assess loan portfolio health within seconds.
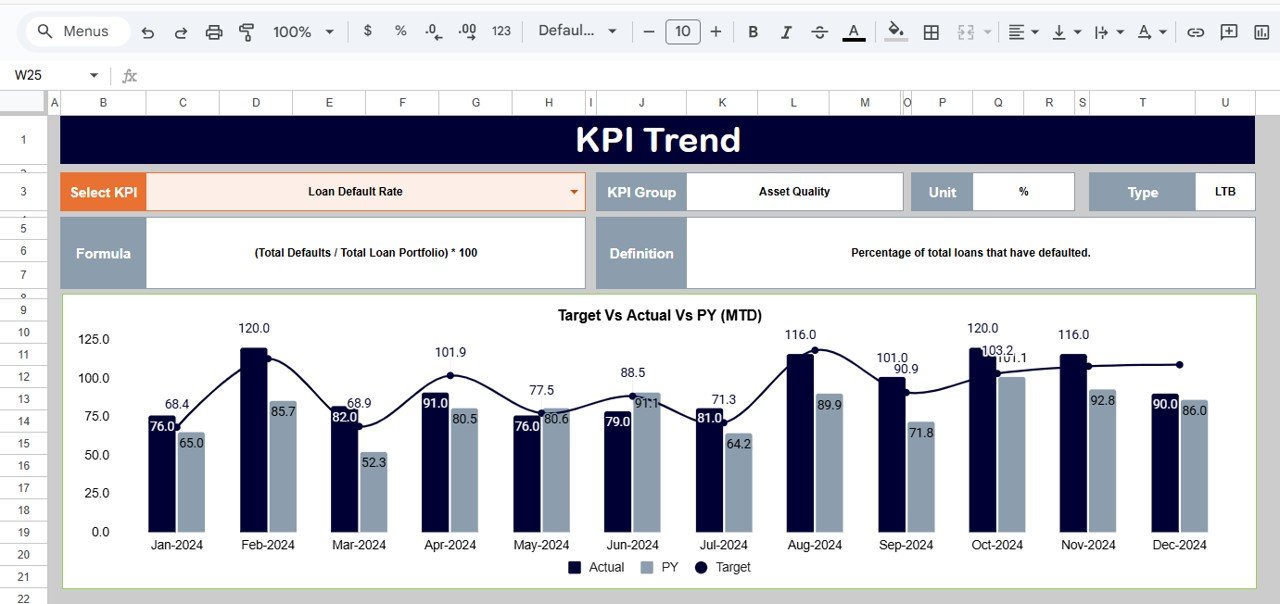
📈 KPI Trend Sheet – Deep Dive Analysis
Select a KPI from the dropdown in cell C3 to view:
-
KPI Group
-
Unit of Measurement
-
KPI Type (Lower the Better / Upper the Better)
-
KPI Formula
-
KPI Definition
Monthly trend charts show performance movement across the year, helping teams identify risk build-up or improvement trends early.
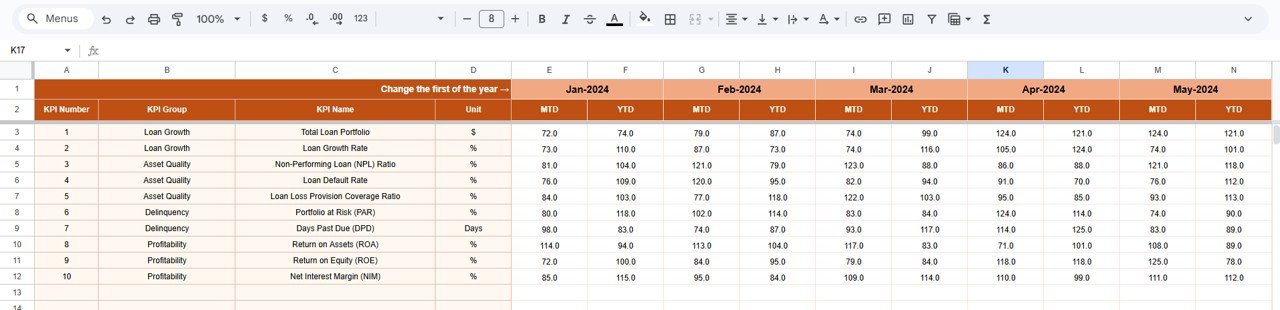
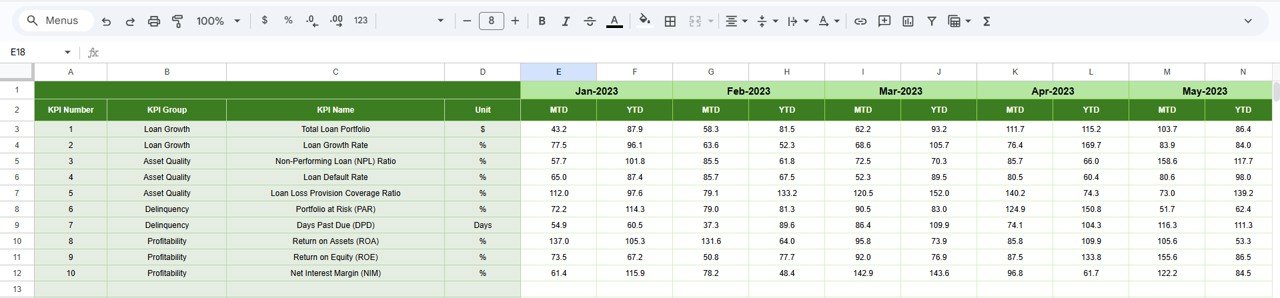
📋 Actual Number Sheet – Primary Data Input
This sheet stores:
-
MTD Actual Values
-
YTD Actual Values
Users define the first month of the year in cell E1, and all calculations adjust automatically. This sheet acts as the backbone of the dashboard.
🎯 Target Sheet – Performance Benchmarks
Enter monthly and YTD targets for each KPI. Targets help:
-
Set portfolio growth expectations
-
Control risk levels
-
Improve accountability
The dashboard automatically compares actuals against targets.
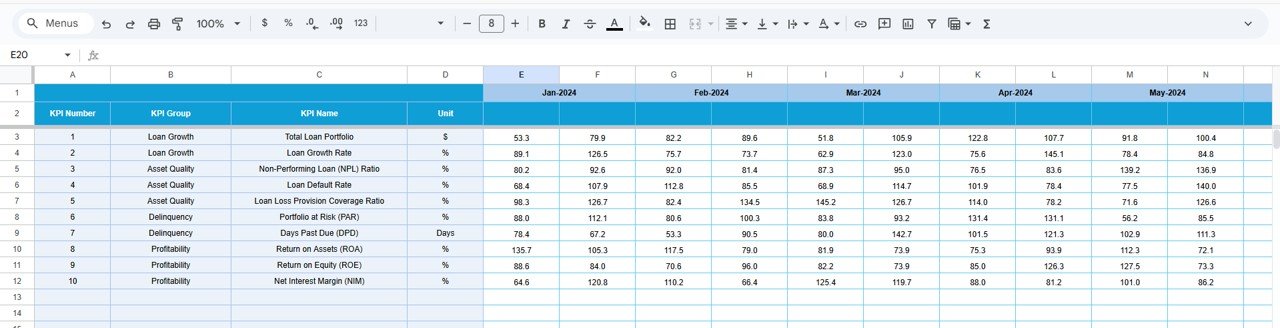
📆 Previous Year Number Sheet – Historical Comparison
This sheet stores last year’s KPI values. It enables:
-
Year-over-year comparison
-
Portfolio growth evaluation
-
Risk trend analysis
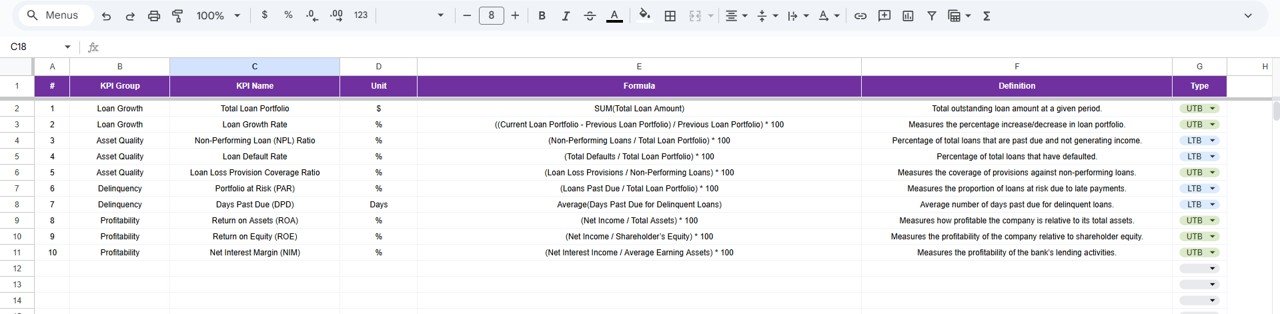
📘 KPI Definition Sheet – Standardization & Clarity
This control sheet contains:
-
KPI Name
-
KPI Group
-
Unit
-
Formula
-
Definition
-
KPI Type (LTB / UTB)
It ensures consistency across reporting and helps new users understand KPIs easily.
🛠 How to Use the Loan Portfolio KPI Dashboard
1️⃣ Enter actual KPI values monthly
2️⃣ Update targets periodically
3️⃣ Select the reporting month
4️⃣ Review MTD, YTD, and YOY performance
5️⃣ Analyze KPI trends during credit reviews
🎯 Who Can Benefit from This Dashboard
-
🏦 Banks & NBFCs
-
💳 Microfinance Institutions
-
📊 Credit & Risk Teams
-
💼 Finance & MIS Teams
-
🧩 Portfolio Managers
-
🚀 Senior Management
### Click here to read the Detailed blog post
Watch the step-by-step video tutorial:


Reviews
There are no reviews yet.