

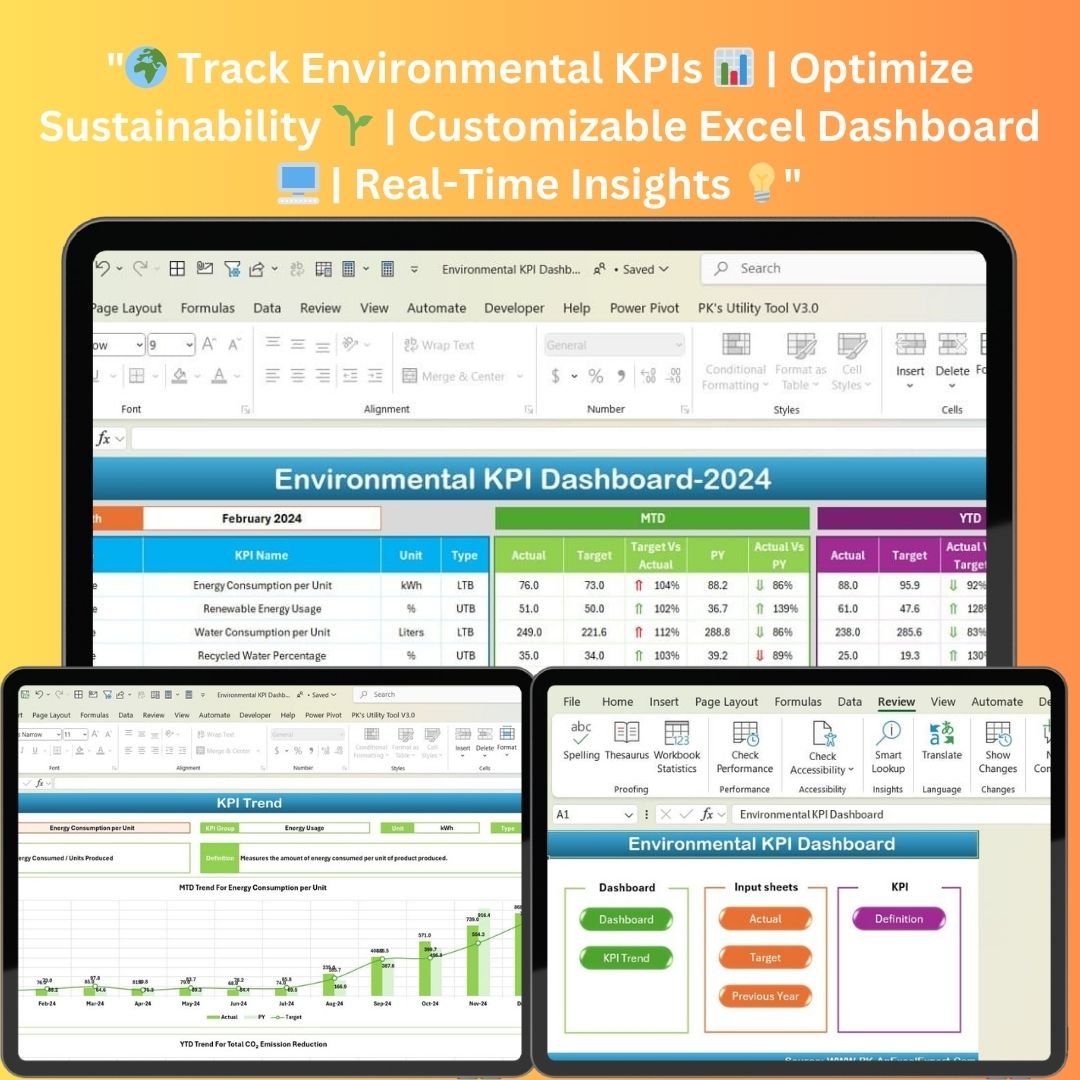



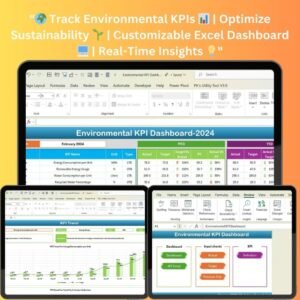
The Environmental KPI Dashboard in Excel is a ready-made template that helps organizations track, monitor and analyze their environmental performance in one place. It suits sustainability teams, facility managers and compliance officers who need a clear view of energy usage, water consumption, waste management and greenhouse gas emissions. The result is a centralized overview of your key performance indicators (KPIs) that makes it easier to manage environmental goals and stay on track with sustainability targets.
Whether you are tracking energy consumption or monitoring waste reduction, this Excel dashboard simplifies how you evaluate your environmental impact. It brings a user-friendly interface, flexible data entry and analysis together in one workbook, so you can make data-driven decisions for improvement.

Key Features
- Track essential environmental KPIs such as Energy Consumption, Water Usage, waste and CO2 / greenhouse gas emissions.
- MTD and YTD monitoring: view Month-to-Date and Year-to-Date performance for every KPI.
- Targets vs. actuals: set monthly and yearly goals and compare actual results against them.
- Year-over-year comparison: compare current year performance with previous year results.
- Conditional formatting: color-coded cells highlight how current performance compares with targets and previous year values.
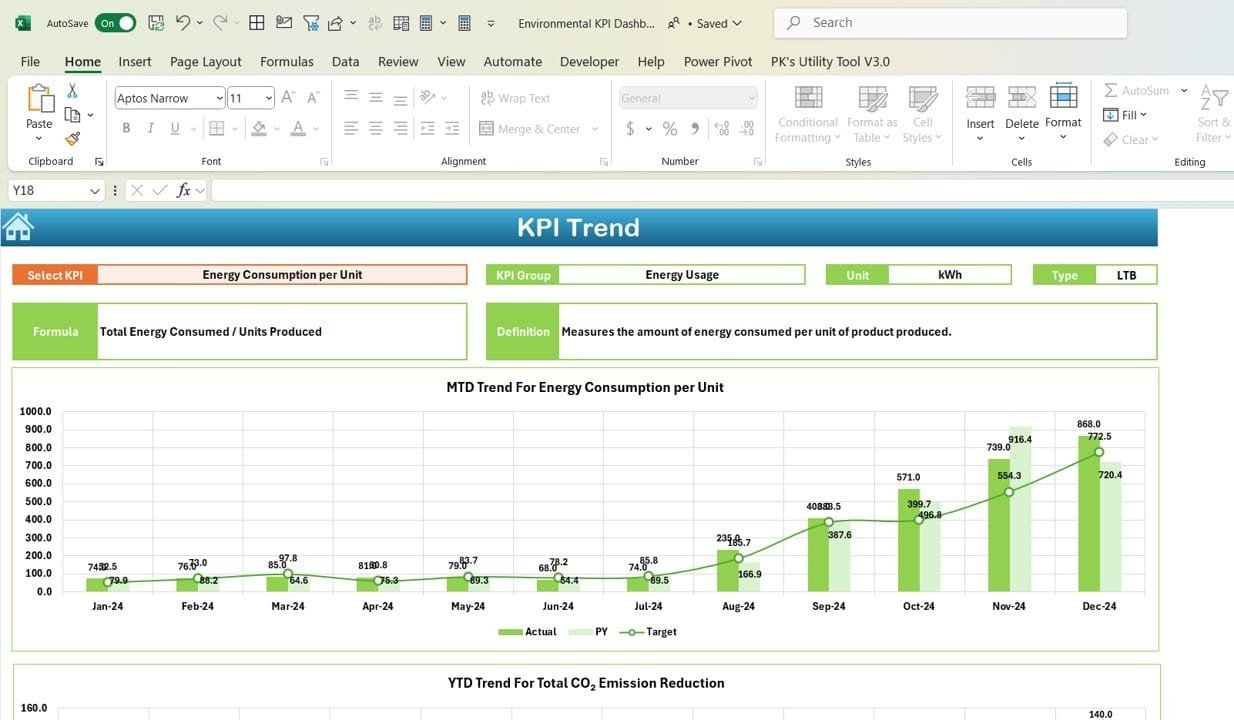
- Trend charts: select a specific KPI and see how it has evolved over time.
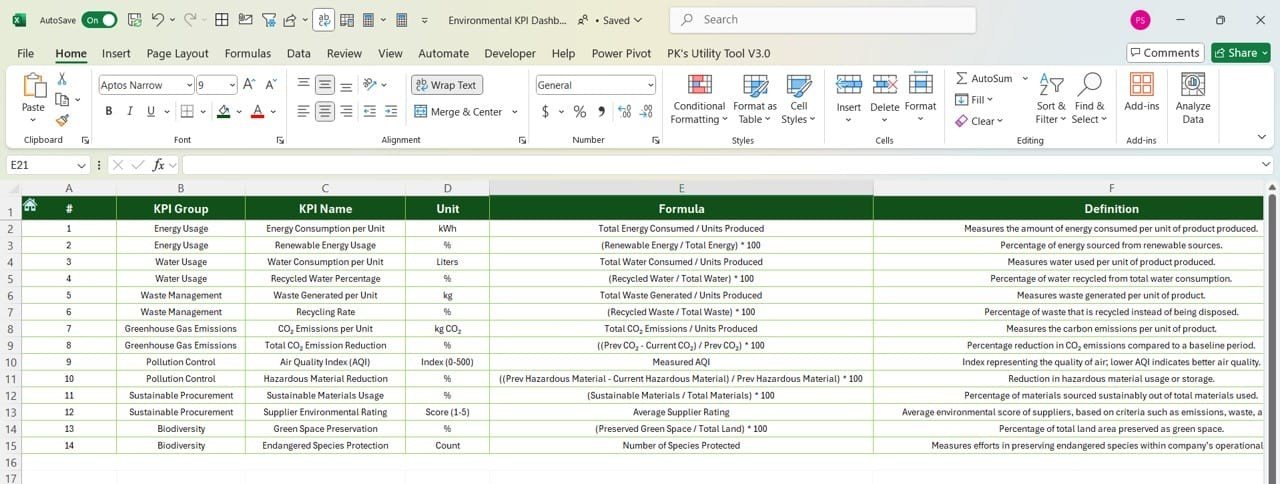
- KPI definitions included: name, unit, formula and a clear definition for every KPI.
- User-friendly layout: no advanced technical skills needed for data entry or navigation.
- Easy customization: tailor the dashboard to your own environmental goals, whether you track energy, water or emissions.
- Instant download after purchase for immediate access.
What’s Inside: Sheets in the Workbook
1. Home Sheet – Easy Navigation
The Home Sheet is the central hub of the workbook. This clean, organized index gives quick access to every other sheet, so you can jump straight to the KPI overview, trend analysis, data entry and definitions sections.
2. Dashboard Sheet – Performance Summary
The Dashboard Sheet is the main overview page and gives a quick snapshot of your organization’s environmental performance. It shows monthly and yearly KPI summaries and uses conditional formatting to highlight how current performance compares with targets and previous year values. Color-coded cells and charts make it easy to spot areas that need attention.

3. KPI Trend Sheet – Historical Insights
The KPI Trend Sheet offers deeper analysis over time. It includes Month-to-Date (MTD) and Year-to-Date (YTD) performance for each KPI, with trend charts showing how your metrics have changed. Select a specific KPI to view its progress and quickly identify positive or negative trends, then adjust your sustainability strategy accordingly.
4. Actual Numbers Input Sheet – Easy Data Entry
The Actual Numbers Input Sheet is the dedicated area for entering MTD and YTD actual performance data. It is organized by month with clearly identifiable fields, so updating your metrics and seeing the latest results is quick and simple.
5. Target Sheet – Goal Setting and Tracking
The Target Sheet is where you set monthly and yearly goals for each KPI, such as energy usage, water consumption, waste generation and emissions. Actual performance is compared against these targets, so you can see whether your organization is on track to meet its sustainability objectives.
6. Previous Year Data Sheet – Year-Over-Year Comparison
The Previous Year Data Sheet stores historical data from the prior year. Comparing current year performance with previous year results helps you evaluate the effectiveness of your sustainability initiatives, measure progress and identify long-term trends.
7. KPI Definition Sheet – Clear KPI Reference
The KPI Definition Sheet is a reference guide listing the name, unit, formula and a clear definition for every KPI. Whether you measure energy consumption, waste reduction or greenhouse gas emissions, everyone on your team can interpret the data the same way.
Benefits at a Glance
| Benefit | What it means for you |
|---|---|
| Centralized data management | All environmental KPIs consolidated in one workbook. |
| MTD and YTD tracking | Progress compared against targets and previous year performance. |
| Goal-oriented | Set specific environmental targets and track progress toward them. |
| Trend analysis | Spot patterns in historical data and refine your strategy. |
| Better decisions | Data-driven insight to improve sustainability practices. |
Who Is This Dashboard For?
This template is designed for organizations of all sizes that want to improve environmental sustainability, from small businesses to large enterprises. It is ideal for:
- Corporate sustainability teams who need simple sustainability tracking and reporting.
- Environmental management departments monitoring energy, water usage, waste and emissions.
- Facility managers keeping an eye on resource consumption.
- Compliance officers checking performance against sustainability targets.
It fits industries such as manufacturing, utilities, construction and waste management, and helps streamline environmental reporting and performance monitoring.
Compatibility
- Excel version: Excel 2016 and later, including Excel 365.
- Operating system: Windows and macOS.
How to Use It
- Download the file instantly after purchase and open it in Excel.
- Review the KPI Definition Sheet and adjust KPIs to match your environmental goals.
- Enter your monthly and yearly goals in the Target Sheet.
- Add last year’s figures in the Previous Year Data Sheet.
- Update MTD and YTD actuals each month in the Actual Numbers Input Sheet.
- Review the Dashboard Sheet and KPI Trend Sheet to analyze performance and act on the results.
Frequently Asked Questions
Which KPIs can I track with this Environmental KPI Dashboard in Excel?
It is built for environmental metrics such as energy consumption, water usage, waste management and greenhouse gas / CO2 emissions. Every KPI is documented in the KPI Definition Sheet with its name, unit, formula and definition.
Does it compare results with targets and last year?
Yes. The Dashboard Sheet compares actual MTD and YTD performance against targets from the Target Sheet and against figures from the Previous Year Data Sheet, using conditional formatting to highlight results.
Which versions of Excel does it work with?
It is compatible with Excel 2016 and later versions, including Excel 365, on both Windows and macOS.
Do I need advanced Excel skills?
No. The Home Sheet provides easy navigation and the input sheets have clearly identifiable fields, so no advanced technical skills are required.
Can I customize the dashboard?
Yes. You can tailor this Excel dashboard to your specific environmental goals, whether your focus is energy, water or emissions.
How do I get the file?
The template is available as an instant download after purchase, so you can start monitoring your sustainability efforts right away.
Learn More
Click here to read the detailed blog post
Visit our YouTube channel to learn step-by-step video tutorials: Youtube.com/@PKAnExcelExpert
Also check our Incentive Dashboard in Excel
Last updated: October 2026
Excel Help for This Dashboard
The dashboard uses standard Excel charts and conditional formatting. Microsoft explains how to build and edit charts in Create a chart from start to finish.
Related Environmental and ESG Templates
- Environmental KPI Scorecard in Excel: a scorecard view of the same KPIs.
- Sustainability Reporting KPI Dashboard in Excel: environmental and social KPIs together.
- Carbon Footprint KPI Dashboard in Excel: focus on emissions and carbon reduction.
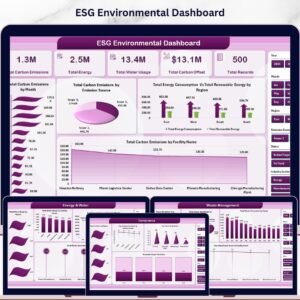
- ESG Environmental Dashboard in Excel: a full ESG environmental dashboard.
- Energy & ESG Sustainability Bundle: 8 Excel and Power BI energy and ESG templates.
Browse all Excel KPI dashboard templates or the Excel dashboard templates.
















Reviews
There are no reviews yet.