


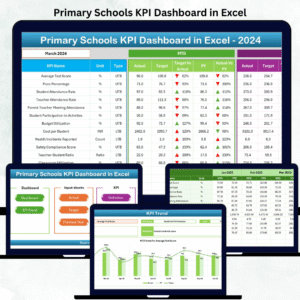
Primary Schools KPI Dashboard in Excel is the perfect all-in-one reporting system for school administrators, academic leaders, and educators who want real-time clarity, faster decision-making, and better academic outcomes. Managing a primary school involves hundreds of tasks—attendance, learning progress, teacher performance, student behavior, facilities, and parent feedback. Tracking all this manually becomes confusing and time-consuming. This ready-to-use Excel dashboard solves that problem by bringing all essential KPIs into one clean, interactive, and easy-to-understand template.Primary Schools KPI Dashboard in Excel,,
This dashboard converts complex school data into simple charts, KPI cards, and comparison visuals. Whether you’re a principal, coordinator, or admin team member, this tool helps you stay informed and make smarter decisions every month. With automated formulas and dynamic visuals, the dashboard updates instantly whenever you add new data—no technical expertise required.
✨ Key Features of the Primary Schools KPI Dashboard in Excel
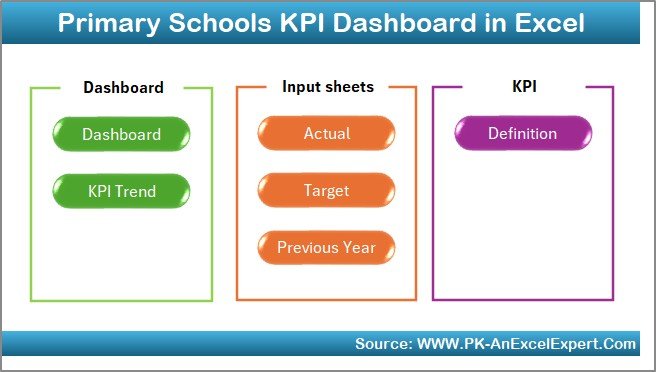
This dashboard is carefully designed with 7 powerful worksheets, each serving an important purpose.
📍 Summary Page – A quick navigation hub with six smart buttons that take you directly to each sheet.
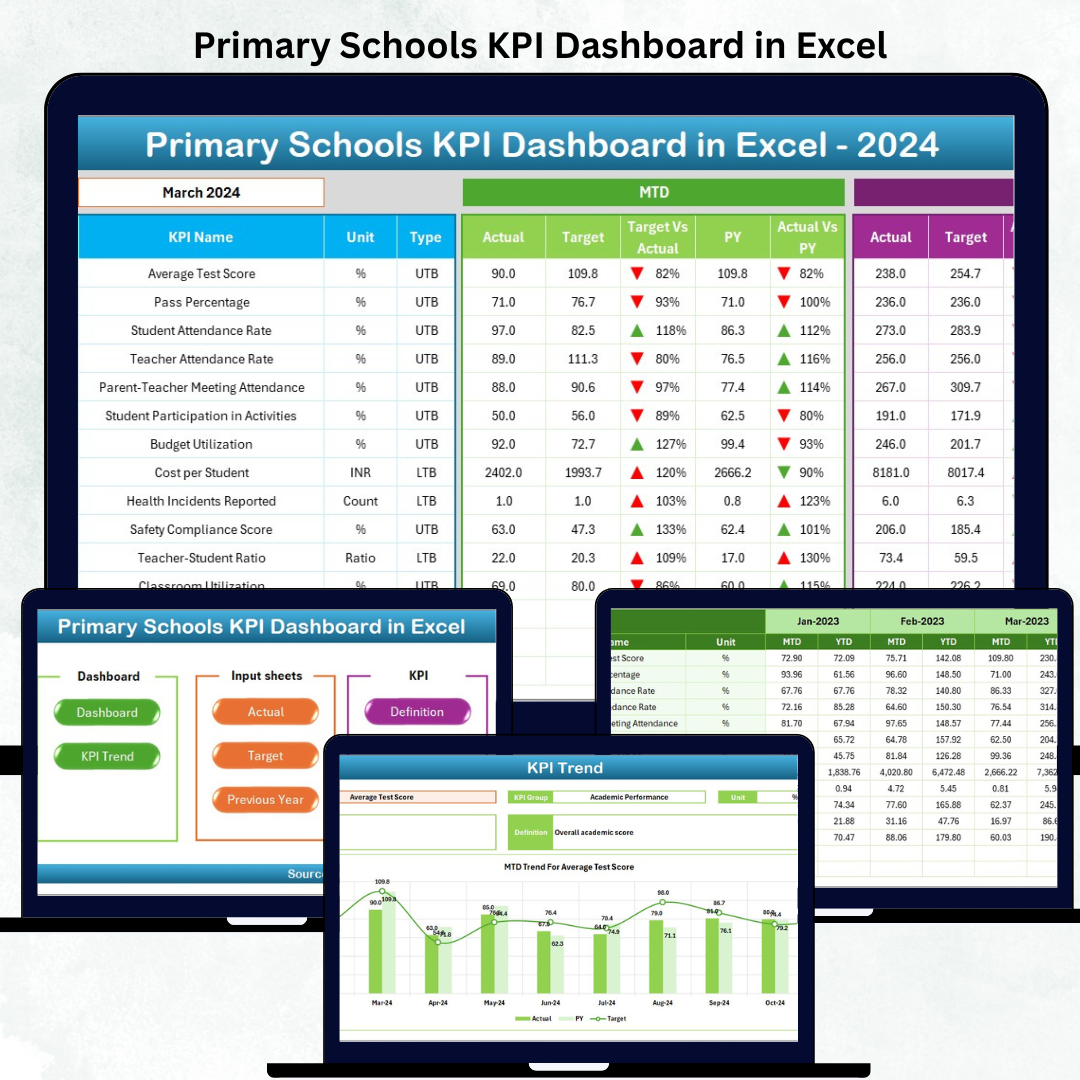
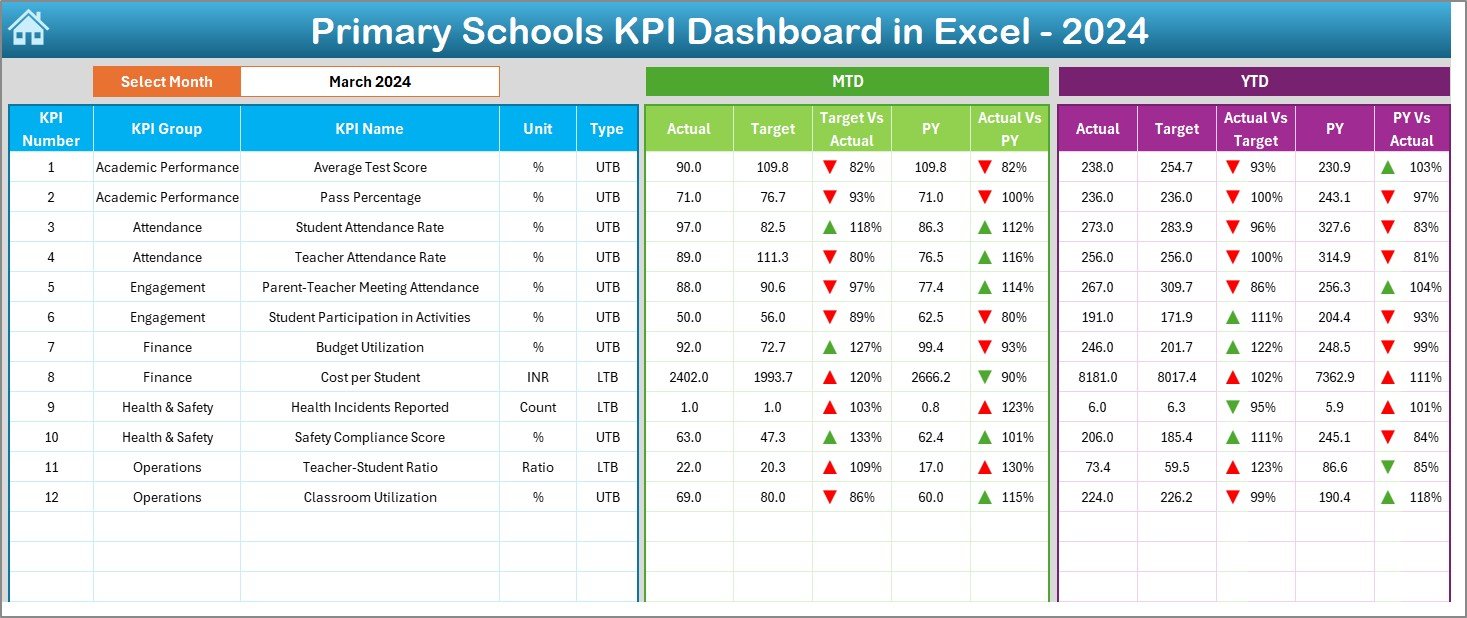
📊 Dashboard Sheet – The main analysis page where you can select any month from a dropdown and instantly view:
MTD Actual, Target & Previous Year
YTD Actual, Target & Previous Year
KPI performance with visual up/down arrows
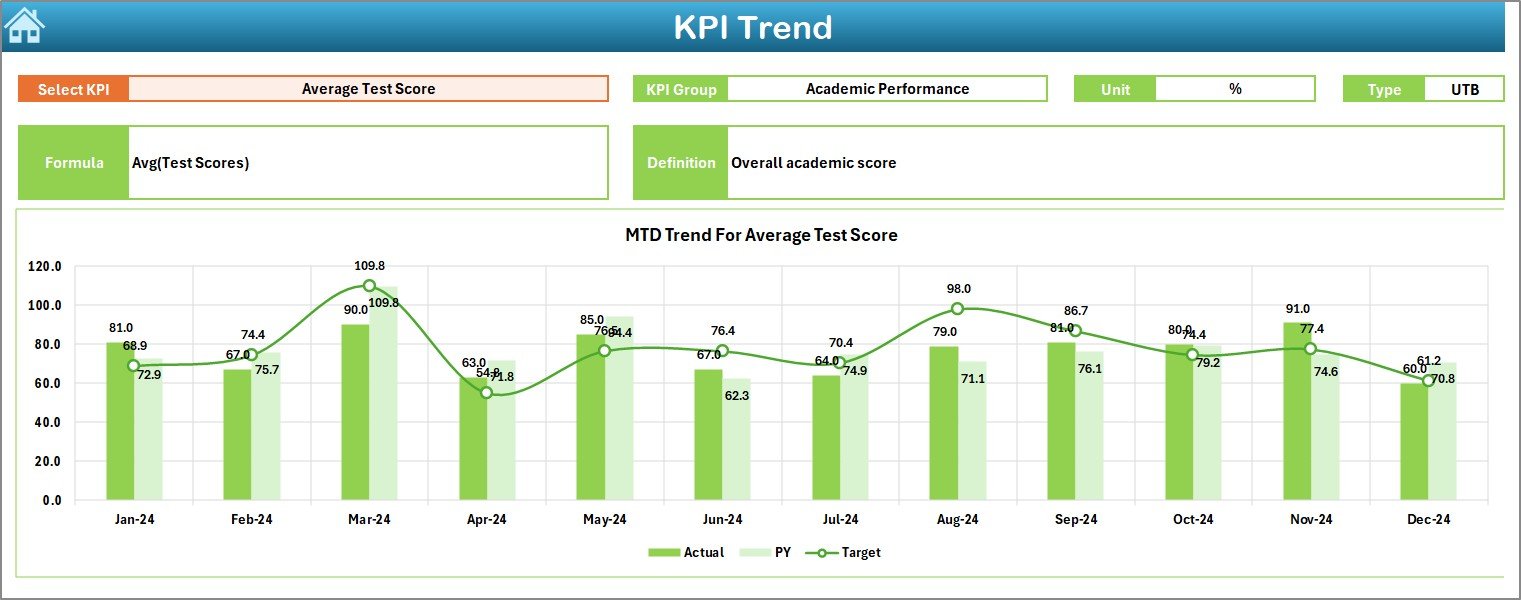
📈 Trend Sheet – Deep dive into each KPI with charts for MTD and YTD trends, KPI type (UTB/LTB), unit, formula, and definition.
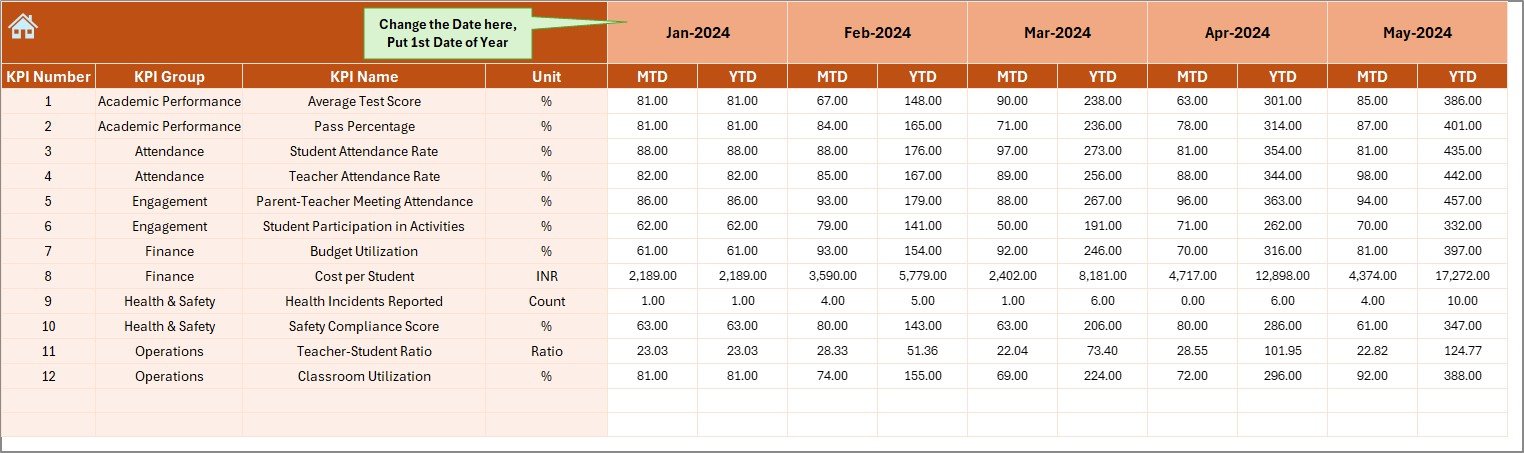
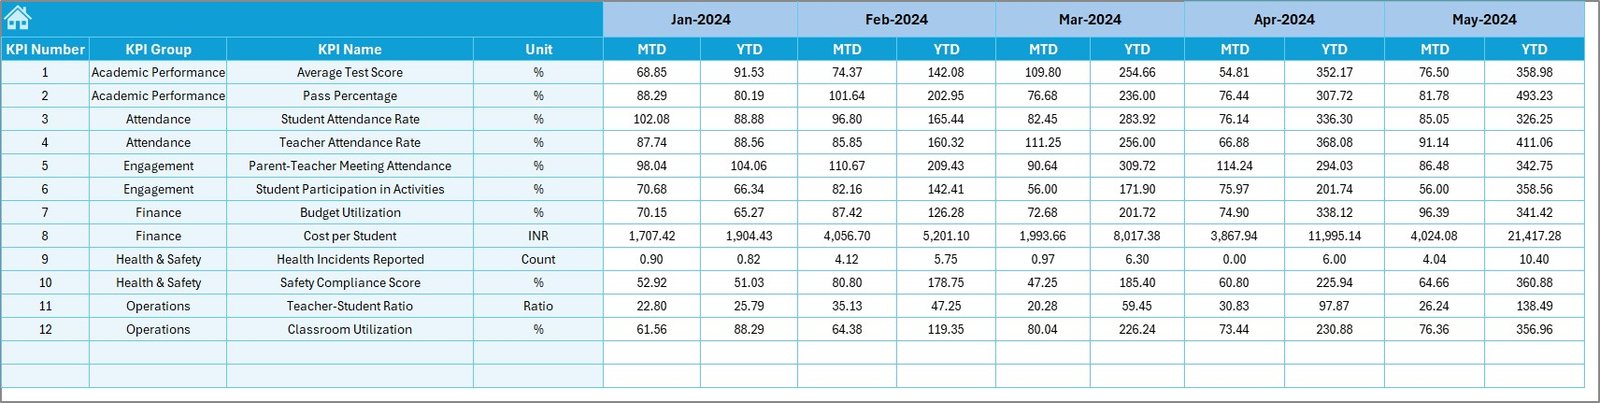
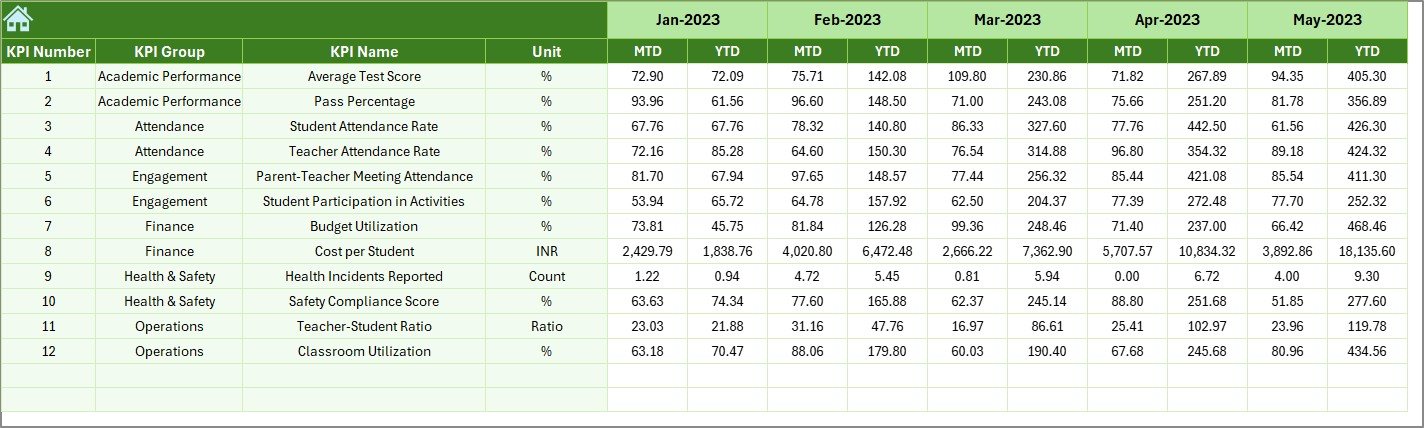
🧮 Actual Numbers Input Sheet – Add monthly school performance data. The dashboard refreshes automatically.
🎯 Target Sheet – Enter MTD & YTD targets for each KPI.
📘 Previous Year Sheet – Add last year’s performance to compare progress.
📑 KPI Definition Sheet – Store all KPI names, formulas, units, and meanings to maintain consistency.
These features make school data easy to understand and improve academic and operational decisions.
📦 What’s Inside the Primary Schools KPI Dashboard in Excel
This product includes everything needed for structured school performance tracking:
A professionally designed Excel file with 7 worksheets
Automated formulas for instant calculations
KPI cards with Actual vs Target vs Previous Year
Conditional formatting for quick performance evaluation
Trend charts for monthly and yearly improvement
Pre-loaded KPI categories (Academic, Attendance, Teacher, Behavior, Resources, Facilities, etc.)
Editable fields for complete customizationPrimary Schools KPI Dashboard in Excel
Clear definitions for every KPI to avoid confusion
Everything is structured so any school can start using it immediately—no setup required.
🛠️ How to Use the Primary Schools KPI Dashboard in Excel
Using this dashboard is extremely simple. Just follow these steps:
Enter actual monthly performance data in the Actual Numbers Sheet
Input monthly or yearly targets in the Target Sheet
Add last year’s data for comparison
Go to the Dashboard Sheet, select the month, and review instant insights
Open the Trend Sheet for detailed charts
Share results with teachers, management, and committees
Use insights to plan improvements and action items
This routine ensures your school stays organized, data-driven, and performance-focused.
🎯 Who Can Benefit from This Primary Schools KPI Dashboard?
This dashboard is perfect for:
School Principals – Evaluate overall performance instantly
Academic Coordinators – Track progress across grades and subjects
Teachers – Understand class-level performance and behavior trends
School Administrators – Monitor attendance, facilities, and operations
Trustees & Management Committees – Get accurate performance summaries
Education Consultants – Analyze multiple schools with consistent KPIs
If your goal is better planning, improved academics, and smart reporting—this dashboard is the ideal solution.






























Reviews
There are no reviews yet.