

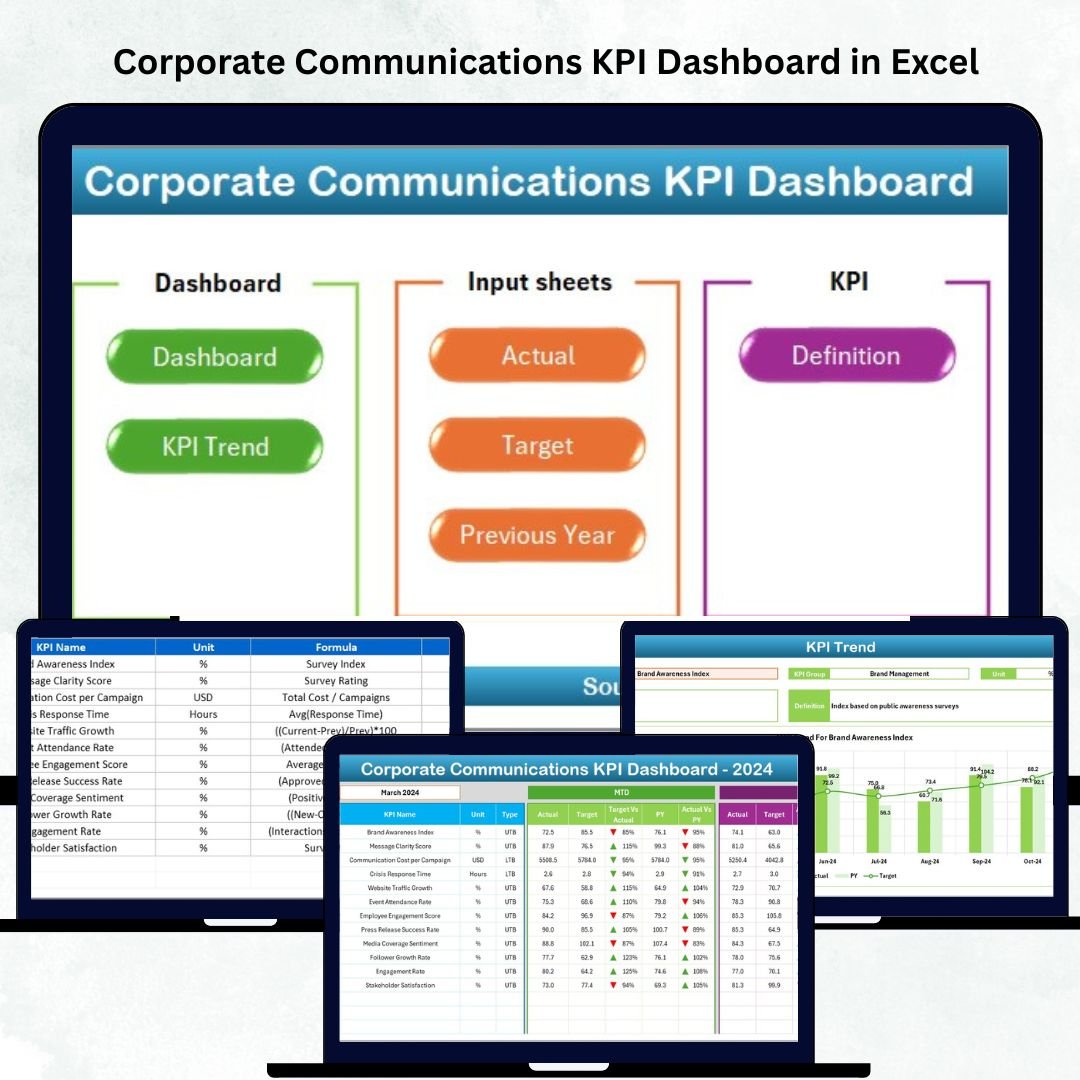

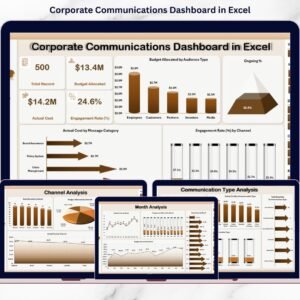
In a fast-paced corporate environment, effective communication is more than just sharing information — it’s building trust, engagement, and alignment. The Corporate Communications KPI Dashboard in Excel is a ready-to-use analytical solution that helps communication leaders track and measure performance across internal, external, and digital channels.
This Excel-based dashboard converts raw data into interactive visuals and actionable insights, allowing corporate communicators, HR leaders, and PR professionals to understand the real impact of their strategies. Whether you’re managing employee engagement campaigns, media relations, or stakeholder updates — this dashboard ensures your communication stays measurable, transparent, and aligned with business goals.
⚙️ Key Features of the Corporate Communications KPI Dashboard in Excel
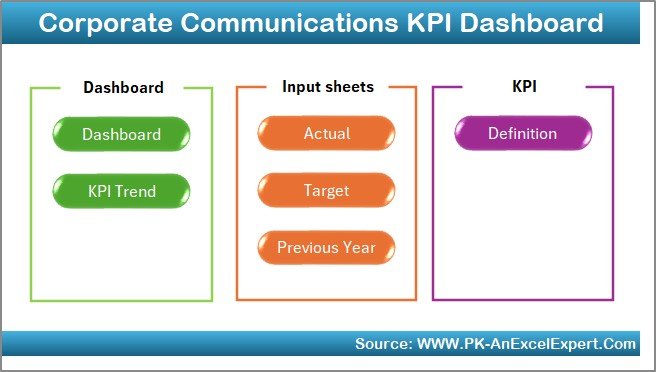
📊 7 Interactive Worksheets: Home | Dashboard | KPI Trend | Input Data | Target Sheet | Previous Year Data | KPI Definition
📅 Dynamic Month Selection: Instantly view monthly or yearly progress.
🎯 MTD & YTD Performance: Compare month-to-date and year-to-date metrics.
📈 Actual vs Target vs Previous Year: Track success against benchmarks.
🟢🔴 Conditional Formatting: Arrows and colors visualize improvement or decline.
🧭 Quick Navigation Buttons: Seamlessly switch between analysis pages.
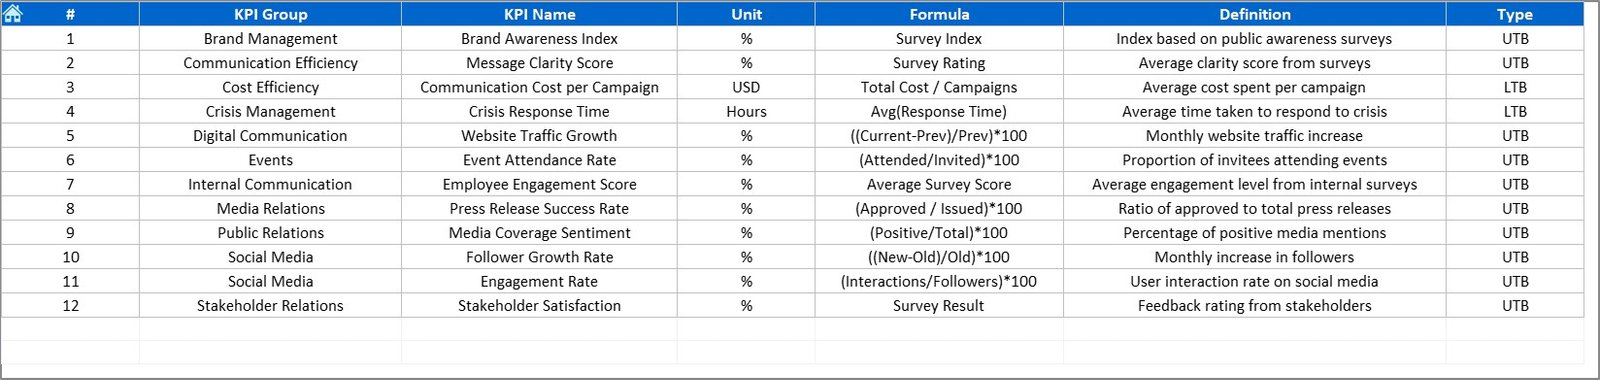
💡 KPI Clarity: Every KPI includes formula, unit, and definition.
💻 Fully Customizable: Add new KPIs or update existing ones easily.
📊 Dashboard Structure and Pages
🏠 1️⃣ Home Sheet – Easy Navigation
A clean index page with navigation buttons linking to Dashboard, KPI Trend, Input Sheets, Target, Previous Year, and KPI Definition.
💡 Purpose: Enhance usability and provide a professional file structure for quick access.
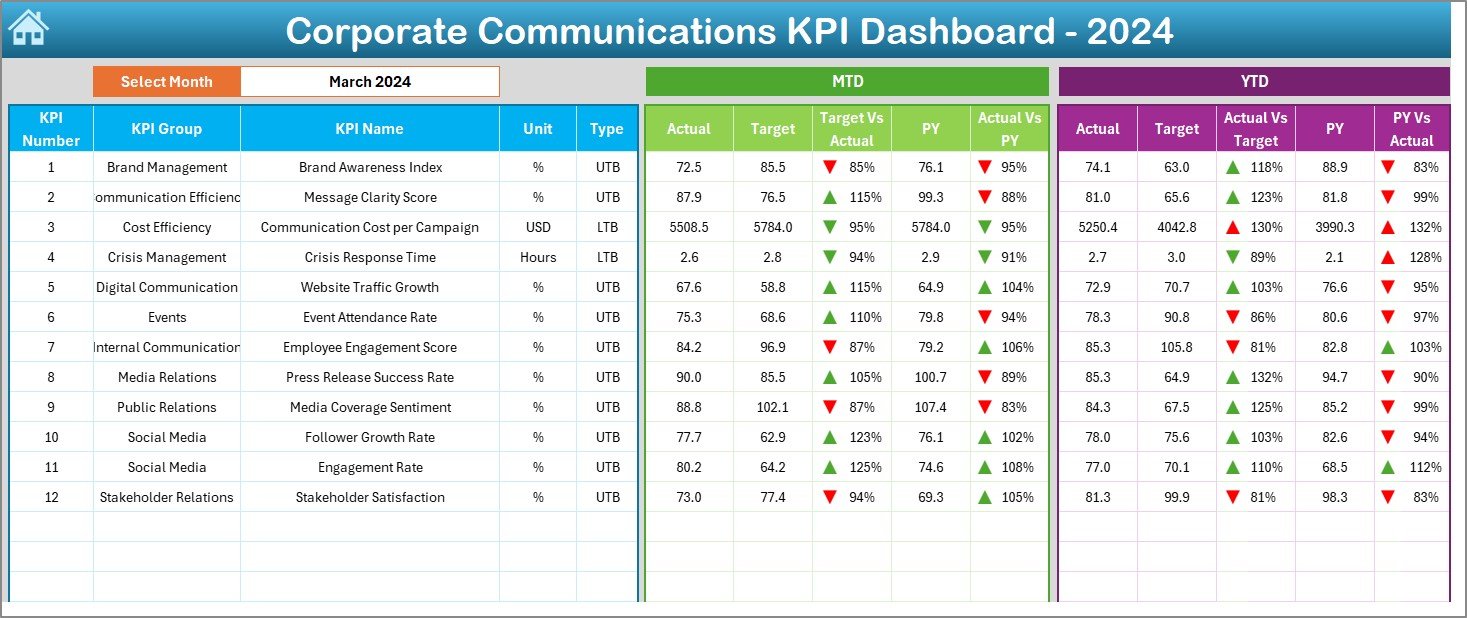
📈 2️⃣ Dashboard Sheet – The Heart of Performance Analysis
This is your main visual summary — the control center of communication performance.
Month Selector (D3): Choose a reporting period to update visuals.
MTD & YTD metrics for all KPIs.
Actual vs Target comparisons.
Conditional arrows for performance trends (green ▲ for improvement, red ▼ for decline).
Previous Year comparisons for long-term insight.
💡 Purpose: Deliver instant visibility into what’s working and what needs improvement.
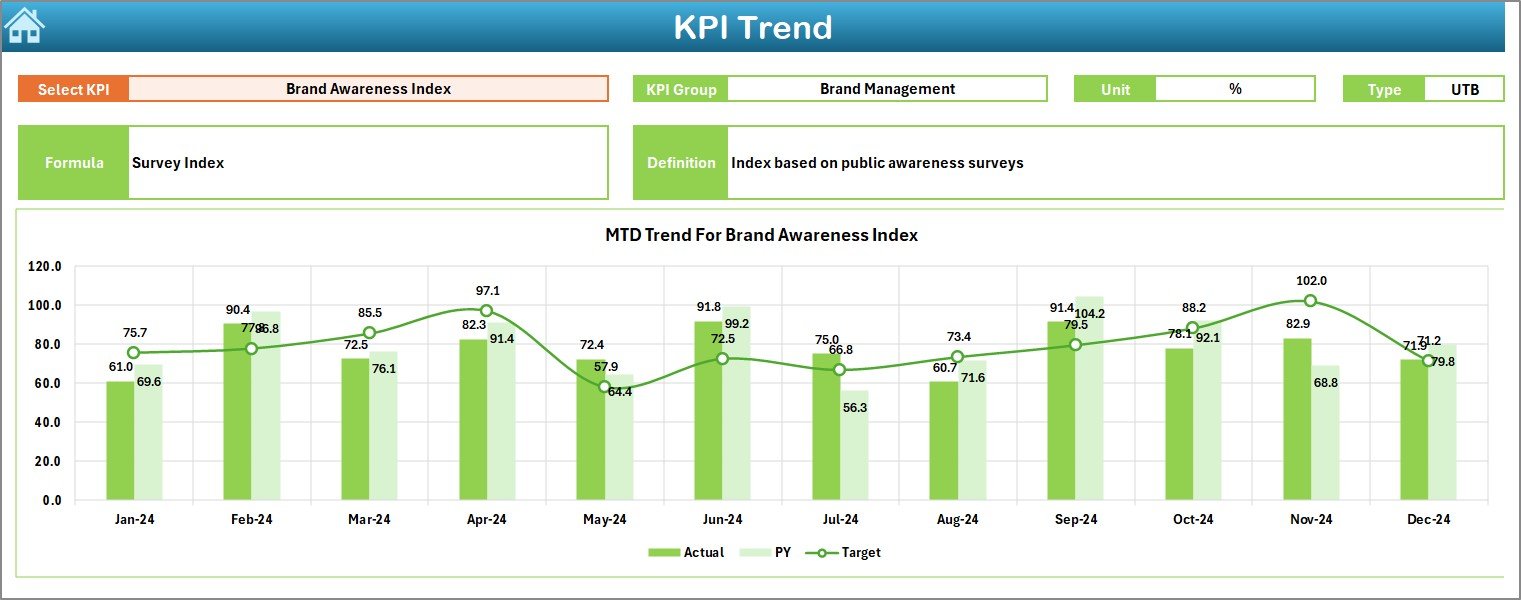
📉 3️⃣ KPI Trend Sheet – Visualize the Journey
Dive deeper into any specific KPI through a dropdown (cell C3).
View KPI Group, Unit, and Type (UTB/LTB).
See interactive MTD & YTD trend charts.
Read KPI Formula and Definition for context.
💡 Purpose: Identify recurring trends, campaign impact, or areas needing adjustment.
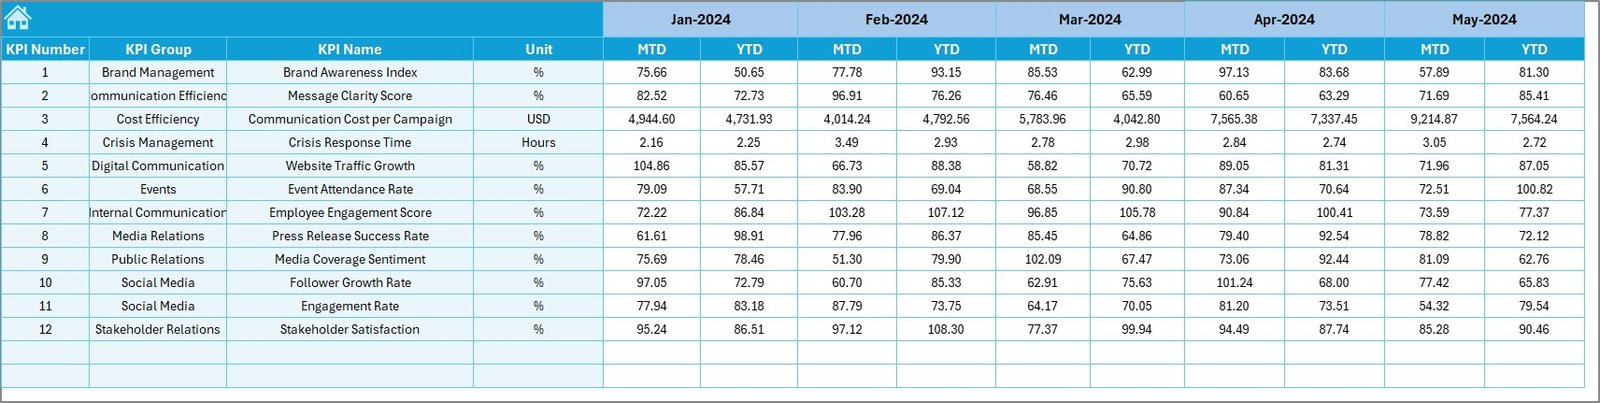
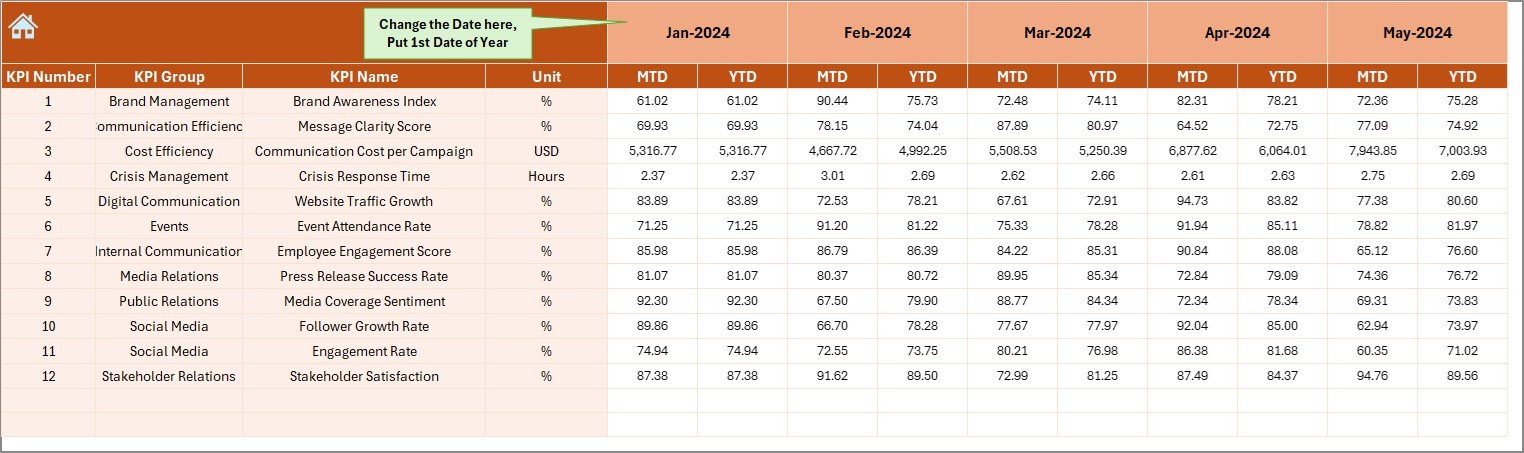
🧾 4️⃣ Actual Numbers Input Sheet – Data Foundation
Enter real-time MTD and YTD values each month.
Auto-updates all linked dashboards.
Monthly selector (E1) ensures correct alignment.
💡 Purpose: Maintain data accuracy and transparency in reporting.
🎯 5️⃣ Target Sheet – Define Success Benchmarks
Record expected monthly and yearly targets for each KPI.
💡 Purpose: Set measurable goals that align with strategic communication objectives.
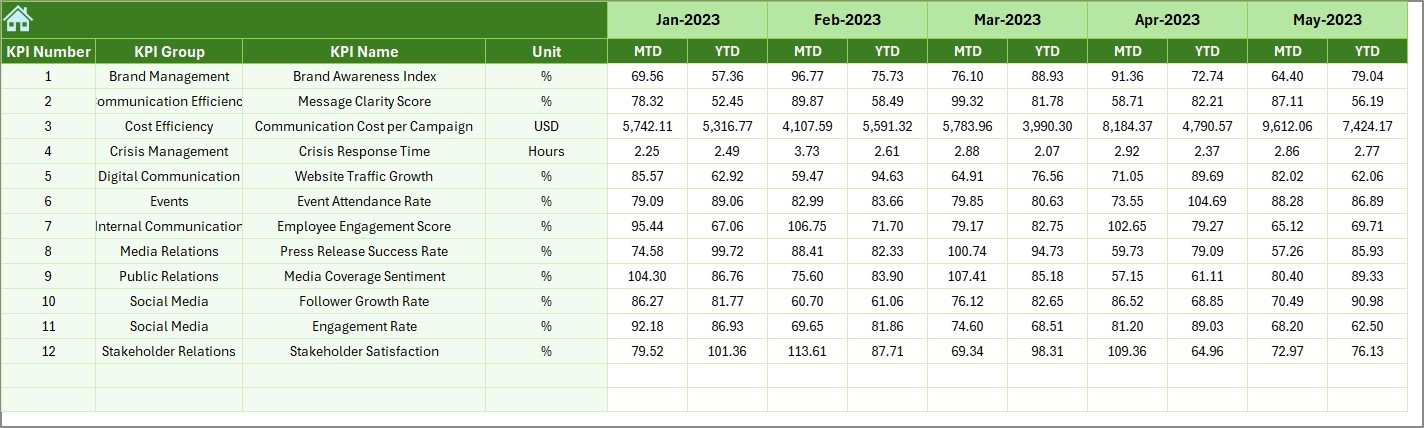
📊 6️⃣ Previous Year Numbers Sheet – Historical Reference
Store prior year data for accurate comparisons.
💡 Purpose: Evaluate growth, spot recurring communication cycles, and assess improvement.
📘 7️⃣ KPI Definition Sheet – Ensure Consistency
Every KPI is clearly defined with its formula, unit, and explanation.
💡 Purpose: Create a shared understanding across departments.
🌟 Advantages of the Corporate Communications KPI Dashboard in Excel
✅ Unified Communication Insights: Track internal, external, and media KPIs in one place.
✅ Accountability & Ownership: Assign metrics to teams or campaigns.
✅ Real-Time Visibility: MTD and YTD comparisons for accurate tracking.
✅ Strategic Decision Support: Identify strengths and areas for improvement.
✅ Cross-Department Collaboration: Encourage transparency between HR, PR, and leadership teams.
✅ Time Efficiency: Automated visuals eliminate manual reporting.
✅ Scalable & Affordable: Built entirely in Excel — no extra tools required.
💡 Best Practices for Using the Dashboard
📅 Update data monthly for real-time accuracy.
📈 Use conditional formatting to highlight key trends.
🧮 Keep KPI definitions updated annually.
🤝 Share dashboard across teams for collaborative reviews.
🔐 Protect formula cells to prevent accidental edits.
📊 Compare MTD vs YTD vs PY for continuous improvement.
🧠 How It Enhances Corporate Communication Strategy
This dashboard helps you:
💬 Track message reach and engagement across channels.
📢 Measure campaign ROI and media coverage.
👥 Improve employee communication effectiveness.
📊 Identify patterns in feedback and sentiment trends.
🎯 Align communication KPIs with overall business objectives.
With every metric measurable, your communication becomes smarter, more consistent, and strategically aligned.
🧩 Conclusion
The Corporate Communications KPI Dashboard in Excel transforms how organizations manage and measure communication. It consolidates all your KPIs — from internal messaging reach to media impact — into one actionable visual file.
By combining clarity, structure, and automation, it empowers communication leaders to make data-driven decisions, enhance transparency, and strengthen trust both internally and externally.
🗣️ Communicate smarter. Measure better. Lead confidently — with NextGen Templates’ Corporate Communications KPI Dashboard in Excel.
🔗 Click Here to Read the Detailed Blog Post
📺 Visit our YouTube Channel for step-by-step tutorials.
Watch the step-by-step video tutorial:
Compatibility and Requirements
- Works in Microsoft Excel desktop (Excel 2016 or later, or Microsoft 365).
- You pick the reporting month from a dropdown on the Dashboard sheet and choose a KPI from a dropdown on the KPI Trend sheet. Microsoft explains dropdowns in Create a drop-down list.
Frequently Asked Questions
Which sheets are included?
Seven sheets: Home, Dashboard, KPI Trend, Input Data (Actual Numbers), Target, Previous Year Numbers and KPI Definition.
How do I update the dashboard each month?
Enter your MTD and YTD figures in the Actual Numbers sheet and your goals in the Target sheet. Then choose the month on the Dashboard sheet and the visuals update.
Can I compare results with last year?
Yes. Add last year’s figures to the Previous Year Numbers sheet and the Dashboard shows them next to your actuals and targets.
How do I see the trend for one KPI?
Open the KPI Trend sheet and pick the KPI from the dropdown. It shows the KPI group, unit and type (UTB or LTB), the MTD and YTD trend charts, plus the formula and definition.
Can I add my own KPIs?
Yes. The template is customizable, so you can add new KPIs or update existing ones.
Is there a Power BI version?
Yes. See the Corporate Communications KPI Dashboard in Power BI.
Related Corporate Communications Templates
- Corporate Communications KPI Dashboard in Power BI: the same KPIs in Power BI
- Corporate Communications Dashboard in Excel: another communications dashboard for Excel
- Corporate Communications Dashboard in Power BI: the dashboard edition in Power BI
- Corporate Social Responsibility Dashboard in Excel: a related corporate dashboard
- KPI Dashboard Library (Excel): 15 KPI dashboard templates in one download
Browse all Excel KPI dashboards.
























Reviews
There are no reviews yet.